


Abstract
A number of studies have investigated the mechanisms that determine changes in precipitation, including how a wet region gets wetter. However, not all monsoon areas get wetter—there is a need to understand the major factors behind changes in regional monsoon precipitation, in terms of external forcing and internal variabilities in the last six decades by a combination of different observed datasets and model runs. We have found that time of emergence of anthropogenic signals is robustly detected in the northern African monsoon before the 1990s with the use of the CESM Large Ensemble Project. From CMIP5 model runs and three reanalysis datasets, the results found are that the change in rainfall over African monsoon (AFM) is mainly due to anthropogenic forcing and that over Asian-Australian monsoon (AAM) is affected by internal variability. Moreover, the cause of American monsoon (AMM) rainfall change cannot be known due to a discrepancy among observed datasets. Here we show that the asymmetry between Northern Hemisphere (NH) and Southern Hemisphere (SH) parts by green-house gas (GHG) is detected over the AFM and AAM regions. However, the land monsoon rainfall in the northern AMM is decreased by a combination of GHG and aerosol forcing. In general, the aerosol forcing causes a decreasing rainfall over the monsoon regions. In future projection, the land rainfall over the AAM and AMM are expected to increase and decrease in the future from most models' results. The asymmetry between an increase in NH and a decrease in SH is dominant in the future from most models' future simulation results, which is well shown over the AFM and AAM. This study suggests that the physical process of GHG and aerosol effects in rainfall should be explored in the context of regional aspects.
Export citation and abstract BibTeX RIS

Original content from this work may be used under the terms of the Creative Commons Attribution 4.0 licence. Any further distribution of this work must maintain attribution to the author(s) and the title of the work, journal citation and DOI.
Corrections were made to this article on 31 March 2020. Changes were made to figure 2 and figure 2 caption.
1. Introduction
Monsoon precipitation is the largest component of the global water and energy cycles and a major driver of general atmospheric circulation (Chang and World Meteorological Organization 2011, Chang et al 2018). The increasing intensity and frequency of heavy rainfall events, heat waves, and severe droughts over the globe have affected the lives of people around the globe and caused huge loss of life, material damages, and associated social costs (Min et al 2011, Qiu 2013). As our climate rapidly changes, we need to improve our understanding of the effect of climate change on monsoons, including on their changes in rainfall and circulation over regionally and geologically different monsoons.
Climate modeling studies (Chou and Neelin 2004, Min et al 2011, Chou et al 2013) predict changes in global precipitation in response to increases in the mean global surface temperature of the Earth. A prevailing theory of precipitation change in a warming world is that wet areas will get wetter (Held and Soden 2006, Chou et al 2009). Under the global warming scenario in phase five of the Coupled Model Intercomparison Project (CMIP5), the Northern Hemisphere (NH) monsoon precipitation will be increased by the increased temperature difference between the NH and Southern Hemisphere (SH) and the enhanced atmospheric moistening (Lee and Wang 2014). However, on a basin scale, this is not always the case (Hsu and Li 2012). In model simulations, a swing in the South Pacific convergence zone due to global warming (GW) has been predicted that might cause catastrophic droughts and food shortages in the region (Cai et al 2012), and the increasing global surface temperature induces a decrease in soil moisture due to increased evaporation (Dai 2013).
As well as GW, natural variability, especially El Niño-Southern Oscillation (ENSO) effect, is also mentioned as the cause of drought (Trenberth et al 2014). On the other hand, past variability in rainfall in the Sahel which depends strongly on the West African monsoon is closely linked to the global sea surface temperature (SST) distributions in both observations and models (Cook 2008). In terms of Asian monsoon precipitation, the decreasing trend of precipitation over South Asia and the increasing trend of precipitation over East Asia are detected and their contrast is attributed to the recent negative Pacific decadal oscillation at the interannual and interdecadal timescales (Yun et al 2014). The westward shifts of the monsoon trough over South Asia and the North Pacific Subtropical High are hypothesized as the physical causes of dry South Asia and wet East Asia (Preethi et al 2017), while more investigations are needed as to whether the impact of global warming on their contrast (Ha et al 2018). These differences are likely manifestations of the different roles played by natural variability and GW in different regions (Kim and Ha 2015). Multidecadal Pacific SST anomalies have been shown to contribute significantly to severe droughts over both the western US and the Great Plains (Meehl and Hu 2006). In addition to the influence of the north–south hemispheric thermal contrast in the Atlantic–Indian Ocean, an east–west thermal contrast in the Pacific Ocean, which is measured by the Interdecadal Pacific Oscillation (IPO) index, is also predicted to increase the decadal variability of NH land monsoon rainfall (Wang et al 2018).
However, the key factors of monsoon rainfall change are not clearly defined due to the uncertainty of climate models and the inconsistency of observed datasets despite many studies on climate change. The urgency of this question is further complicated by the fact that the observed trends lie outside the range of natural variability simulated in climate models (Hoerling et al 2010), but at the same time oppose the simulated response to GW. This conundrum requires an in-depth re-evaluation of the changes in global and regional monsoons and causes and drivers of recent global and regional monsoons. The purpose of this study is, therefore, to identify long-term climatic change by analyzing robust changes in precipitation over monsoons from 1958 to 2015 through various reanalysis datasets based on observations and model simulations from Community Earth System Model (CESM) and various external forcings used in CMIP5.
2. Data and methods
In this study, NOAA's precipitation reconstruction (PREC) (Chen et al 2002), CRU (Harris et al 2014), GPCC (Schneider et al 2014), the ERA-40 (Uppala et al 2005), and the ERA-Interim (Dee et al 2011) are used for precipitation data. We primarily use PREC data to analyze precipitation changes because this data covers global precipitation, while CRU and GPCC cover only land precipitation, and is based on observations at over 17 000 stations. These datasets are re-gridded with a common 2.5° latitude × 2.5° longitude grid by using a bilinear interpolation technique, and then investigated during the period 1958–2015 since these datasets overlap in time since 1958.
To compare changes in simulated precipitation from the CGCMs with observed precipitation, we use the output from the CESM Large Ensemble Project (Kay et al 2015), which consists of a 40-member ensemble of fully-coupled simulations with CESM1 for the period 1920–2100 under historical radiative forcing (up to 2005) and the RCP8.5 radiative forcing scenarios (for 2006–2100). In addition to the CESM, CMIP5 models covering pre-industrial, historical, RCP4.5, greenhouse gas (GHG), natural (NAT), anthropogenic aerosol forcing scenarios are obtained from the Earth System Grid Federation (https://esgf-node.llnl.gov/search/esgf-llnl/) (table S1, available online at stacks.iop.org/ERL/15/034055/mmedia). To investigate the time of emergence (TOE) of anthropogenic signal on precipitation trend in the CESM simulations, the precipitation trend of ensemble mean and the standard deviation across the precipitation trends of ensemble members, respectively, represent the forced response (i.e. signal) and internal variability (i.e. noise) because the same radiative forcing scenario is applied to the ensemble members with a slightly different initial condition in atmospheric state (Chung et al 2019). We assume that the standard deviation across the precipitation trends of ensemble members can be regarded as the internal variability because the internal atmospheric variability contributes substantially to the spread of the precipitation trends of ensemble members (Deser et al 2012). The signal-to-noise ratio (SNR) can be computed by dividing the absolute value of the ensemble mean trend by the standard deviation across the ensemble members. The TOE is defined as the time at which the forced response of rainfall emerges from the noise in the internal variability of the climate system. It can be determined by finding the first year in which the SNR is larger than certain threshold values (Hawkins and Sutton 2012). In this study, the SNR of the linear trends is computed at each grid point for a number of cases in which the time span of a period starting from 1958 is extended by changing the end year of the period by 1 year every time from 1987; then we determine the first case in which the SNR is larger than 1.
3. Results
3.1. Changes in rainfall and emergence time
In linear trend analysis during the last six decades (1958–2015) to investigate recent rainfall changes using PREC data, rainfall in the Indonesian–Australian monsoon region has a significantly increasing trend, but that in the central Pacific region has significantly decreased near 180°E (figure 1(a)). A significant decreasing trend in rainfall over land is also found in West Africa and Mexico, an area that is included in the global monsoon (GM) region (solid black lines in figure 1(a)). The GM domain is defined by the region in which the annual rainfall range exceeds 180 mm and the local summer monsoon rainfall level exceeds 35% of the annual rainfall (Wang and Ding 2006).
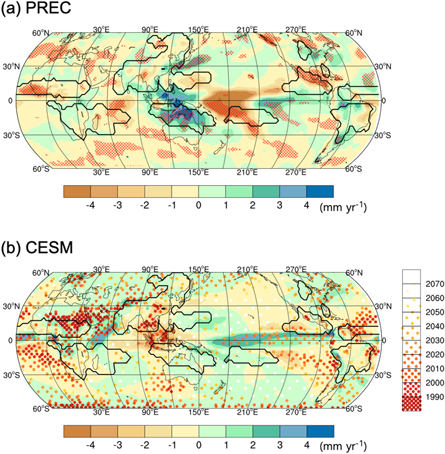
Figure 1. Linear trend of annual global (60°S–60°N, 0°–360°) rainfall. Plots are made using precipitation data from (a) PREC dataset (1958–2015) and (b) the present run which is merged historical run (1958–2005) and RCP8.5 run (2006–2015) of CESM Large Ensemble Project (1958–2015). Color shading shows linear temporal trends (mm yr−1). In (a), the diagonal cross-hatching (red) denotes the statistically significant region above the 95% confidence level, as determined using the Mann-Kendall test. The red stippled areas in (b) denote the end year of a period starting in 1958 for which the linear temporal trend predicts that the signal-to-noise (SNR) ratio exceeds 1 for the first time. The global monsoon domains (black solid) are defined according to Wang and Ding (2006) using PREC data.
Download figure:
Standard image High-resolution imageHowever, the simulated rainfall trend from the CESM model differs from the linear trend of PREC, with a pattern correlation coefficient (PCC) of just −0.16 (figures 1(a) and (b)). In CESM simulations, the TOE of anthropogenic signal on rainfall trend is detected before the 1990s over the northern African and Southeast Asian monsoon regions and spreads to other regions such as the North and South Pacific Ocean (figure 1(b)). However, before the 2020s, the signal of anthropogenic response cannot be detected over most areas except for the northern African monsoon, Southeast Asian monsoons, and the tropical Atlantic Ocean (figure 1(b)). It is denoted that the internal variability is large enough to obscure anthropogenically-induced rainfall change over there, which suggests that it may not be straightforward to unequivocally detect human-induced changes at regional monsoons except for the northern African and Southeast Asian monsoons in both the observations and model simulations during the period 1958–2015. Additionally, in order to the statistical test on the result of the TOE, the Bonferroni test and the 5%–95% range of TOEs across 40-member ensembles are investigated. As a result of the Bonferroni test, the TOEs over tropical Africa, Southeast Asia, tropical and northern Pacific Ocean, and the middle latitude in the SH might not be statistically robust results (figure S1). In terms of the range of TOE, the TOE over the northern African monsoon has the lowest uncertainty (figure S2). Thus, the TOE over the northern African monsoon is statistically reliable in both two statistical tests, and these strongly support that the precipitation trend over this monsoon region is affected by the human-effects.
From the results of the multi-model mean (MMM) in CMIP5 by the external forcings, the GHGs seem to induce a contrast of wet northern and dry southern tropics in the western Pacific, which are associated with the increasing rainfall in Asia and decreasing rainfall in Australia, which seems to differ from the trend in PREC over the same region (figures 1(a) and 2(a)). In NAT simulation, such as solar radiation and volcanic forcings, do not have pronounced trends (figure 2(b)). Aerosol forcing can lead to a decrease in rainfall over West Africa and South Asia (Bollasina et al 2011, Chang et al 2011, Giannini and Kaplan 2019). In anthropogenic aerosol forcing simulations, the significant decreasing trends can be seen over tropical Africa, Asia, western and northern Pacific, and Mexico (figure 2(c)). The anthropogenic aerosol effect can influence the Sahel drought or hurricane through the multidecadal variability of SST over the North Atlantic Ocean (Booth et al 2012). Thus, the observed decreasing trend of rainfall over West Africa and Mexico may be affected by the aerosol forcings (figures 1(a) and 2(c)). The influences of various external forcings as the GHGs, aerosol, natural forcings on the regional precipitation changes will be investigated in chapter 3.4.

Figure 2. Linear trend (mm yr-1) of annual global (60°S–60°N, 0°–360°) rainfall from (a) GHG run (1958–2005), (b) NAT run (1958–2005), (c) Aerosol run (only anthropogenic aerosol forcing, 1958–2005), and (d) pre-industrial run (1–59) from multi-model mean (MMM) in CMIP5. Composite difference of annual precipitation (m yr-1) based on (e) −IPO minus +IPO, and (f) +NAID and −NAID in pre-industrial run of CMIP5. In (a)–(d), the diagonal cross-hatching (red) denotes the statistically significant region above the 95% confidence level, as determined using the Mann-Kendall test. The global monsoon domains (black solid lines) are defined according to Wang and Ding (2006) using PREC data.
Download figure:
Standard image High-resolution image3.2. Importance of natural variabilities and the Walker circulation
Despite a continuous increase in surface temperature, the African monsoon notably does not show any trend after the middle of the 1990s (Hua et al 2016). Since the late 1970s, the correlation between interannual variability in the western North Pacific monsoon and ENSO, a change mediated by the Indian Ocean SST (Huang et al 2013), has strengthened.
In the pre-industrial model experiment, which imposes non-evolving pre-industrial conditions, the simulated rainfall output for 60 years does not reveal any pronounced trend (figure 2(d)). To investigate the effects of natural variabilities on the precipitation changes, an IPO index and a North Atlantic-south Indian Ocean dipole (NAID) index (Wang et al 2018), which denote internal modes of Earth's climate system, are used. The result shows a zonal dipole character in trend with a positive over the Maritime Continent and a negative over both the western and central Pacific (figures 2(e) and (f)). Thus, the wet Indonesian–Australian monsoon and dry central Pacific in PREC can be caused by the natural variability (figures 1(a), 2(e) and (f)).
According to the previous studies (Huang et al 2013, Hua et al 2016, Kim and Ha 2018, Chung et al 2019), the strength and extension of the Walker circulation have been responsible for the changes in rainfall. Here we compare two ensembles of the top 10% (figure S3(a)) and the bottom 10% (figure S3(b)) based on the strength of Walker circulation from CESM Large Ensemble 40 members. The results show that the trends of the two composites are significantly distinguished with equal external forcing. Their patterns are found over a globe, in particular, the difference over the Pacific is virtually clear. In detail, there are strong increasing trends over the western Pacific and decreasing trends over central and eastern Pacific for the top 10% ensembles. The Walker circulation change may be also one of causes in the wet Indonesian–Australian monsoon and dry central Pacific as much as the natural variability.
3.3. Changes in regional monsoon land rainfall using three reanalysis data
In understanding the current rainfall change, the reliability of the reanalysis data is important. To check the reliability, PREC, CRU, GPCC, ERA-40, and ERA-Interim data are used in this study. The regional monsoon systems associated with the three continental pillars in longitudinal and adjacent oceans (Zhou et al 2016) are categorized as the African monsoon (AFM), the Asian-Australian monsoon (AAM), and the American monsoon (AMM) in figure S4. To investigate the different responses of northern and southern tropics, data from the NH and SH for the three monsoons are separately examined as well.
For the six decades from 1958 to 2015, the rainfall time series of PREC, CRU, and GPCC datasets have a high correlation coefficient over the GM and regional monsoons, except for ERA-40 and ERA-Interim data (table S2). The ERA-40 and ERA-Interim data are excluded from further analysis in this study because these are not correlated with others which are based on observations. Regional average of trends over each grid in different monsoons are different in three reanalysis data set, which are compared with CESM and CMIP5 runs, especially in regional monsoons (figure 3). To assess the trends of three reanalysis data, the standard deviation for 141 cases of a 60 year trend with the use of the pre-industrial run is calculated. In this study, the significant change due to external forcing is defined by the signal over the one standard deviation (grey shading in figure 3) of 60 year trends in the pre-industrial run.

Figure 3. Box plots for the distribution of annual land rainfall trends from three reanalysis data, CESM and the CMIP5 MMM over regional monsoons. Linear trend of land annual rainfall (mm yr−1) over the (a) GM, (b) AFM, (c) AAM, and (d) AMM from PREC (blue), CRU (red), GPCC (green), CESM (purple) and the CMIP5 MMM (black) during the period 1958–2015. The gray shading is denoted 1 sigma level of 60 year trends in 141 cases from pre-industrial run simulations during 200 years of MMM in the CMIP5. The box (error bar) is determined by the 25%–75% (15%–85%) within individual monsoon region. The (e)–(h) and (i)–(l) panels show the northern and southern parts of GM, AFM, AAM, and AMM.
Download figure:
Standard image High-resolution imageIn terms of GM, the trends of precipitation from the three reanalysis datasets, CESM and CMIP5 slightly decrease, but these changes are not signals due to external forcings (figure 3(a)). The trends of AFM rainfall in three reanalysis datasets, except for model simulations, significantly decrease (figure 3(b)). The trends of AAM rainfall have no significant detection in all datasets (figure 3(c)). The trend of AMM rainfall in CRU significantly increases, but the significant rainfall trends in other datasets cannot be detected (figure 3(d)). In terms of the land rainfall trend over the AMM, uncertainty exists between the three reanalysis datasets.
The trends in the NH and SH of the monsoon regions are also not detected by signal (figures 3(e) and (i)). The trends of three reanalysis data have comparable values with significantly decreasing values in the northern AFM, while CESM and CMIP5 have significant increasing trends (figure 3(f)). The CRU, GPCC, and CMIP5 in southern AFM have a significant decreasing trend, which is very distinguished with PREC and CESM (figure 3(j)). Regarding AAM, there are significant decreasing trends in southern AAM, while trends in northern AAM have no significant values in three reanalysis data (figures 3(g) and (k)). CESM and CMIP5 cannot detect significant monsoon land rainfall trends in the northern and southern parts of the AAM (figures 3(g) and (k)). In the AMM, the increasing rainfall trend is detected over the northern and southern parts from CRU, but there is a large discrepancy between the three reanalysis data (figures 3(h) and (l)). This discrepancy hinders the causes of land rainfall changes in the AMM.
In terms of the present run in model simulations, the rainfall trend of the northern AFM can be detected by signals due to external forcings in both CESM and CMIP5. This result is consistent with the TOE analysis (figures 1(b) and 3). However, the rainfall trends of the northern AFM which are caused by external forcings have opposite signs between reanalysis datasets and model datasets. In addition, the results imply that we should be aware of the differences between datasets in terms of intensity as well as trend, but the rainfall trends over monsoon regions except for the AMM are consistent within reanalysis datasets.
3.4. Response to monsoon land rainfall changes due to external forcings
To investigate the cause of monsoon land rainfall changes detected by the signal, simulated model results under GHG, NAT, aerosol scenarios are used. The trends of monsoon rainfall by natural forcing cannot be detected as signals because it is within the standard deviation range of the pre-industrial run (figure 4). In terms of GM, GHG forcing can significantly increase and decrease land rainfall over the northern and southern GM (figure 4(e)). The asymmetry between NH and SH parts by GHG can be detected over the AFM and AAM regions (figures 4(f), (g), (j), and (k)). Also, in the northern AMM, the land monsoon rainfall can be decreased by GHG and aerosol forcings (figure 4(h)). The aerosol forcing causes a decreasing rainfall over the monsoon regions, except for the southern AAM (figure 4). In addition, the difference of surface temperature between the NH and SH is enhanced (weakened) by the GHGs (aerosol) forcing (table S3). The warmer (colder) NH-warm (cold) SH by the GHGs (aerosol) forcing generates a cross-equatorial flow from SH (NH) to NH (SH) which favors intensification of the NH (SH) monsoon but tend to decreases the SH (NH) monsoon rainfall (Lee and Wang 2014).
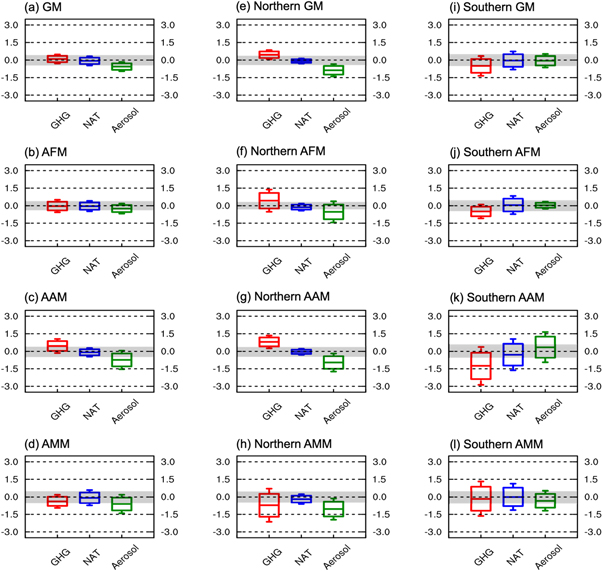
Figure 4. Same as figure 3 except for GHG (red), NAT (blue), and Aerosol (green) runs of MMM in the CMIP5 during the period 1958–2005.
Download figure:
Standard image High-resolution imageComparing these model results with the observed significant changes in monsoon rainfall, we can guess the cause of monsoon rainfall changes in the last six decades. The decreasing rainfall over the northern AFM could be led by aerosol, while the decreasing rainfall over the southern AFM could be caused by GHGs. (Figures 3(f), (j), 4(f), and (j)). The precipitation in tropical Africa tend to be decreased by the aerosols from biomass burning, while that is less sensitive to GHGs forcing (Paeth and Feichter 2006). On the other hand, the decreasing rainfall over the southern AFM seems to be favored by the generated northward equatorial flow due to the GHGs forcing. In terms of the present run in CESM and CMIP5, the factor of an increasing rainfall over the northern AFM can be seen as a GHG forcing (figures 3(f) and 4(f)). It is guessed that the response of land rainfall by GHG forcing is more sensitive than the response of that by aerosol over the northern AFM in the present run from climate models.
The trends of northern AAM can be seen to be affected by the internal variability of climate system despite significant signals which are detected by GHG and aerosol forcings in model simulations (figures 3(g) and 4(g)). In the southern AAM, the aerosol forcing may be one of the causes of increasing rainfall but its influence is not beyond the range of internal variability of the climate system (figures 3(k) and 4(k)). One study was suggested that one of the causes of the increased rainfall over the southern AAM may be the anthropogenic aerosol over Asia which is generated the meridional temperature gradients (Rotstayn et al 2009). The colder NH-cold SH distribution is detected in this study (table S3). If the increasing rainfall over the southern AAM is caused by the aerosol forcing, it is favored by the generated southward equatorial flow due to the thermal contrast between NH and SH such as the colder NH-cold SH. In the northern AMM, unfortunately, the cause of a significant increasing rainfall trend from reanalysis data is not able to determine through the model simulations because the GHG and aerosol forcings can decrease the monsoon land rainfall (figures 3(h) and 4(h)). Thus, it is difficult to investigate the cause of monsoon rainfall change over the AMM due to the uncertainty of model simulation and a discrepancy between the reanalysis data based on observations.
To investigate how the monsoon rainfall will evolve in the future, the difference of annual land rainfall between RCP4.5 (2053–2100) and historical (1958–2005) runs in CMIP5 models over the individual monsoon region are compared. The results show that the GM rainfall will be slightly increased in 6 models in future climate simulations (figure S5(a)). The AFM rainfall is little change but cannot be predictive due to the large uncertainty of models by intra-model variabilities (figure S5(b)). The land rainfall over the AAM and AMM are expected to increase and decrease in the future from most models' results (figures S5(c) and (d)). In terms of NH and SH monsoons, an increasing in NH and decreasing in SH is dominant in the future from most models' future simulation results, except for MRI-CGCM3 (figures S5(e) and (i)). This asymmetry between NH and SH is also shown over the AFM and AAM in the future climate change (figures S5(f), (g), (j), and (k)). The AMM rainfall will decrease in both NH and SH (figures S5(h) and (i)). These results are similar to those of GHGs forcing experiments (figures 4 and S5).
4. Conclusion and discussion
The increasing intensity and frequency of rainfall events and droughts over the various monsoon regions have affected the lives of over two-thirds of the world population. Despite the importance of monsoon change, scientific understanding of monsoon rainfall change is lacking. The present study intends to investigate the reliability of available precipitation data and the trends in rainfall over regional monsoons in order to project the future of monsoons, and its results are summarized as follows.
- By studying the time of emergence of the effects of human activities on the global rainfall change using the CESM simulation, we find that changes in precipitation by the anthropogenic forcing are robustly detected over the northern African monsoon before the 1990s.
- The greenhouse gas forcing drives a meridional dipole in trends over the western Pacific, while natural variabilities induce a horizontal dipole over the western-central Pacific.
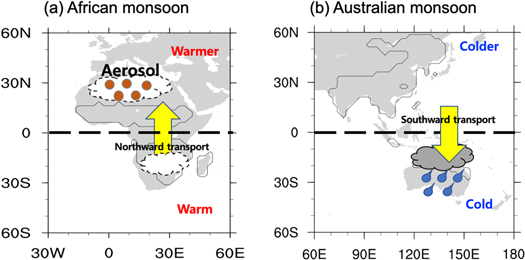
- The decreasing trend in rainfall over the northern African monsoon can be seen to come from aerosol, while that over the southern African monsoon seems to be caused by the generated northward transport due to the thermal contrast between Northern and Southern Hemisphere from the greenhouse warming (figure 5(a)).
- The change in Asian monsoon rainfall may be primarily due to the internal variability rather than external forcings, while the Australian monsoon rainfall has the potential to be increased by the aerosol forcing through the generated southward equatorial flow transport due to the colder Northern Hemisphere and cold Southern Hemisphere (figure 5(b)).
- The cause of an increasing trend of the American monsoon, especially in the northern part, cannot be known through the response of monsoon rainfall by the external forcings because the greenhouse gas and aerosol forcings induce a decreasing rainfall trend. In addition, it is difficult to understand the observed change in land rainfall over the American monsoon due to a discrepancy between reanalysis datasets based on observations.
The discussion on quantification of external forcings or internal variability on the individual monsoon rainfall change still remains unexplored and the effects of aerosol on the increased and decreased rainfall are not investigated in this study. These will be studied in further research. In addition, the usage of groundwater resources such as the irrigation can also affect monsoon precipitation as much as the greenhouse gases and aerosol forcings (Puma and Cook 2010, Cook et al 2015). The extensive irrigation increases the local soil moisture over the Asian monsoon, which results in a decrease of precipitation through a southward shift of the moisture convergence zone (Agrawal et al 2019). Thus, the changes in ground conditions by human activity need to be considered in regional precipitation change. On the other hand, the station-based precipitation datasets are inconsistent between products and are mentioned their differences depending on the number of stations used, their homogeneity and the manner of analysis (Hegerl et al 2015, Sun et al 2018, Lin and Huybers 2019). However, this study shows that a major factor of rainfall change over the individual monsoon region is distinguishable, which is provided through combinations of results from different observed datasets and model runs. These results are expected to provide an improvement in the predictability of individual monsoon rainfall in future climate change. Furthermore, this result suggests that monsoon attribution studies on changes in rainfall should consider thermodynamic factors, wind convergence, water availability, and evaporation in the context of regional aspects.
Figure 5. Schematic illustration of influences of GHGs and aerosol forcings on the observed rainfall changes over the African and Australian monsoon domains.
Download figure:
Standard image High-resolution image
Acknowledgments
We would like to express our sincere thanks to Axel Timmermann and Bin Wang for their insightful comments. This works was supported by the Institute for Basic Sciences (IBS), Republic of Korea, under IBS-R028-D1. The authors thank the National Center for Atmospheric Research for providing the CESM Large Ensemble Project output. We acknowledge the World Climate Research Programme's Working Group on Coupled Modeling, which is responsible for the CMIP, and we thank the climate modelling groups for producing and making available their model output.
Data availability
The data that support the findings of this study are openly available. The CMIP5 model output analysed in this study is available from the Earth System Grid Federation server (https://esgf-node.llnl.gov/search/cmip5/) and the CESM Large Ensemble Project simulation output can be obtained from http://cesm.ucar.edu/projects/community-projects/LENS/data-sets.html. Reanalysis datasets can be accessed at the following websites. ERA-40 and ERA-Interim data: http://apps.ecmwf.int/datasets/. PREC and GPCC: https://esrl.noaa.gov/psd/data/gridded/index.html. CRU data: http://badc.nerc.ac.uk/data/cru/.