

Abstract
Tea is the most consumed beverage in the world apart from water. Climate change is anticipated to affect the tea industry, but quantified large-scale predictions of how temperature and water availability drive tea production is lacking in many regions. Here, we use satellite-derived observations to characterize the response of tea yield to water and heat stress from 2008 to 2016 across Kenya, the third largest producer of tea. We find that solar-induced fluorescence captures the interannual variability in tea yield remarkably well (Pearson's correlation coefficient, r = 0.93), and that these variations are largely driven by the daily dynamics of soil moisture and temperature. Considering rising temperature in isolation suggests that yields in 2040–2070 would decrease by 10% relative to 1990–2020 (ranging between −15% to −4% across 23 models), but most climate models also simulate an increase in soil moisture over this interval that would offset loss, such that yields decrease by only 5% (ranging between −12% to +1%). Our results suggest that adaptation strategies to better conserve soil moisture would help avert damage, but such changes require advanced planning due to the longevity of a tea plant, underscoring the importance of better predicting soil moisture over the coming decades.
Export citation and abstract BibTeX RIS

Original content from this work may be used under the terms of the Creative Commons Attribution 4.0 licence. Any further distribution of this work must maintain attribution to the author(s) and the title of the work, journal citation and DOI.
1. Introduction
Tea plants are primarily grown in rainfed systems and are strongly dependent on weather conditions for optimal growth [1–3]. Kenya has ideal growing conditions for tea in the cool, wet, highlands east and west of the Great Rift Valley, and provides 8% of the world's tea [4]. Field studies in Kenya have demonstrated that tea is particularly sensitive to water availability and extreme temperature [5, 6], with temperature damage amplified by moisture deficits [3, 7].
Climate change has the potential to disrupt the tea industry in Kenya by altering temperature and precipitation patterns. Global climate models predict that precipitation will increase in Kenya's tea growing zones [8], likely increasing root-zone soil moisture, but it remains unclear if this increase in water supply will outweigh the adverse effects of future warming. Quantifying the response of tea yield to climate change is of high economic and social value, as tea is Kenya's leading export [9], employs approximately 10% of the country's population [1], and is largely managed by smallholders [1, 10].
In this study, we aim to predict the response of Kenyan tea yield to changes in heat and water stress associated with climate change. Our analysis framework is divided into three parts: (1) relating tea yield to remotely-sensed observations of solar-induced fluorescence (SIF); (2) resolving the response of SIF to daily heat and water stress using remotely-sensed observations of soil moisture and weather-station-based estimates of temperature; and (3) evaluating future yield responses using simulations from global climate models. We utilize low-order statistical models such that free parameters can be well-constrained by available data. Such an approach complements process-based modeling approaches that more fully represent the biophysical controls upon yield outcomes (e.g., [11–13]).
2. Yield from SIF
Annual tea yield observations (in units hg ha-1) are from the Food and Agriculture Organization Statistical Databases at the national level [4]. Yield observations span from 1961 to 2016, and generally increase from 1961 until the early 2000s (figure S1(a)–(b) available online at stacks.iop.org/ERL/15/044003/mmedia). Tea growing zones are identified using a 0.021 eight-degree crop distribution map for 2015 provided by SERVIR-Eastern and Southern Africa (SERVIR-ESA) under the Regional Center for Mapping of Resources for Development (RCMRD). Because we ultimately wish to relate tea yield to soil moisture, we conduct our analysis at the 0.25 degree resolution and over the 2008–2016 period that soil moisture and yield data are both available. There are 28 one-quarter-degree resolution grid boxes that encompass Kenya's tea growing region (figure 1).
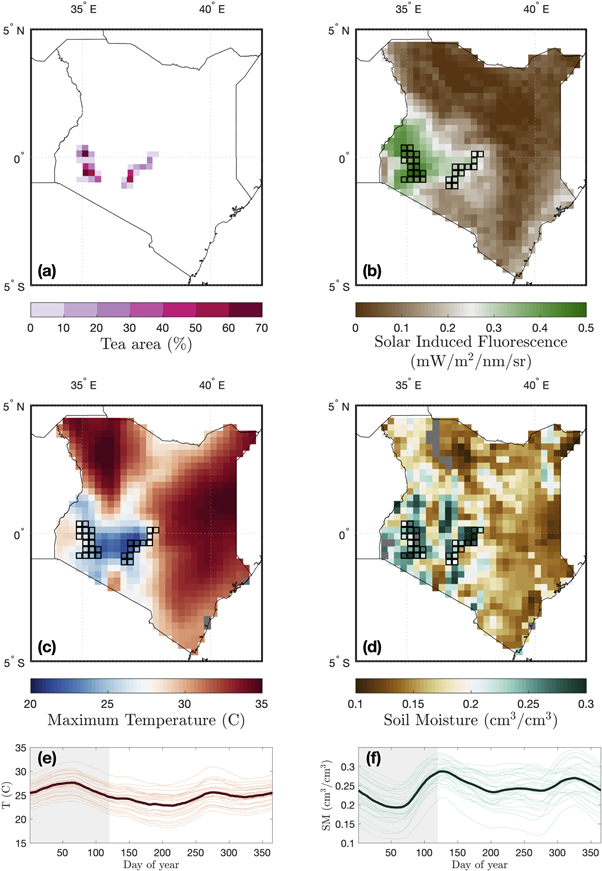
Figure 1. Tea growing areas and environmental variables across Kenya. The spatial distribution of (a) tea cultivation and annual average (b) SIF, (c) maximum daily temperature, and (d) soil moisture at 0.25-degree resolution, with tea growing regions outlined in black. There are 30 grid boxes growing tea, though no soil moisture observations are available in two of the thirty (as shown in gray in (d)), resulting in a total of 28 tea grid boxes for the analysis. The climatological seasonal cycles of (e) maximum daily temperature and (f) root-zone soil moisture are shown for each of the 28 tea grid boxes (light colors) and averaged across the 28 tea grid boxes (dark colors). To estimate a climatological seasonal cycle for each variable, we smooth the daily observations from 2008 to 2016 using a 30-day moving window and then average across years. The 'critical growing season' (January through April) is shaded in light gray.
Download figure:
Standard image High-resolution imageRather than directly model tea yield as reported by the Food and Agriculture Organization, we utilize satellite observations of vegetation activity to spatially downscale reported national yields and isolate the season that contributes most to interannual yield variability. Following previous analyses [14], we relate yield to vegetation activity via SIF. SIF directly monitors processes involved in photosynthesis, and the majority of photosynthesis in tea plants occurs in the leaves [3]. Furthermore, in the case of tea, SIF provides a unique opportunity to directly monitor the product being harvested, as opposed to its being an indirect measure of yield as in fruiting crops. SIF observations are only related to tea yield, as opposed to tea quality, which would require more nuanced considerations [2, 15].
SIF observations are from the Global Ozone Monitoring Experiment-2 (GOME-2) instrument flying on the Metop-A satellite. We utilize level-2 daily average estimates of SIF (version 27), which are pixel data, as opposed to the level 3 gridded data [16]. The daily averages are approximated from observed SIF assuming a clear sky photosynthetic active radiation proxy at the observation time and a similar clear-sky photosynthetic active radiation weighting for all other hours. Days that are flagged as poor quality (labeled 'bad' in the provided data) are excluded. Daily average SIF observations, which have a footprint of 40 km by 40 km (40 km by 80 km before 15 July 2013) [16], are gridded to 0.25 degree resolution by binning and averaging the observations.
There are two major advantages afforded by SIF relative to using national yield data alone. First, SIF allows for examination of subseasonal variability in growth such that we can better isolate the 'critical growing season' in which vegetation activity contributes most to interannual variability in yield. To determine the critical growing season of tea using SIF observations, we temporally average SIF over all sets of consecutive months, fit a least-squares linear regression between SIF and yield for all sets of months, and select the set that minimizes the root mean square error. Note that we do not specify the number of months in the critical growing season, allowing the length of consecutive months to vary between one and twelve. Using this methodology, we isolate January through April as the critical growing season, consistent with previous studies [17]. Tea yield corresponds well with SIF in Kenya's tea growing regions during the critical growing season (Pearson's correlation coefficient, r = 0.93; figure 2(a)), whereas annual average SIF is a weaker predictor of yield (r = 0.56; figure S2). Although tea is an evergreen perennial, the critical growing season encompasses a regular dry season (figures 1(e)–(f)) when tea is hydrologically vulnerable [17], with the start of the first rainy season occurring in April.

Figure 2. Observations of yield, SIF, maximum temperature, and soil moisture at varying time scales. Time series of (a) tea yields and SIF, and (b) soil moisture and maximum temperature, and (c) the daily distribution of soil moisture and temperature across the tea regions in Kenya. In subplots (a) and (b) yields are reported at the annual time scale, and SIF, soil moisture, and temperature are averaged from January through April.
Download figure:
Standard image High-resolution imageThe good initial match between spatially-averaged SIF and national-level yields suggests that a more detailed spatial analysis is warranted. The second major advantage of SIF is that it allows us to characterize subnational levels of tea productivity as a function of soil moisture and temperature, increasing our sample size from 9 (years) to 237 (years and grid boxes). We assume that yield is correlated with SIF averaged over the critical growing season in each of these grid boxes. This local assumption is supported by the fact that seasonal variability in soil moisture and temperature variability is similar across each grid box within the domain (figures 1(e)–(f)). Evaluation at the grid-box level allows us to relate well-resolved observations of soil moisture and temperature to a regional indication of yield.
Although the spatially-resolved analysis permitted by SIF increases the combinations of years and grid boxes to 237, the actual degrees of freedom increase more slowly than data points because of spatial covariance and because some boxes are composed of small percentages of tea. According to a 2015 crop distribution map (figure 1(a)), the 28 grid boxes that we examine are composed of between <1% to 73% tea crop. We perform two additional analyses to evaluate the degree to which our results are sensitive to the inclusion of boxes with low tea coverage. First, we average across only those grid boxes containing over 10% tea area, reducing the number of grid boxes from 28 to 17, and fit a least-squares linear regression. Secondly, we fit a least-squares linear regression to all 28 grid boxes but weight each grid box by the corresponding percentage tea area. In both of these analyses, we find that these methods of accounting for crop distribution reduce the correlation with nationally reported tea yield (table S1), possibly because of large interannual variability in tea harvest area (figure S3). On account of uncertainty in the representivity of the 2015 crop distribution for other years, all 28 grid boxes are considered equally.
3. Yield variations in response to soil moisture and temperature
Consistent with the dry season being critical for tea yield [7, 17], we develop a model of how variations in water status influence yield outcomes, as monitored by SIF. Yield variability is represented as a function of root-zone soil moisture and maximum daily temperature because they are the primary determinants of tea plant water status, with soil moisture representing the supply of water available to the roots and maximum daily temperature representing the demand of moisture exerted on transpiration by the atmosphere.
Daily near-surface soil moisture observations (in units cm3 cm−3) are from the European Space Agency's Climate Change Initiative (ESA-CCI) soil moisture project version 4.2 [18–20], and are provided at a 0.25 degree spatial resolution. This data product combines various single-sensor active and passive microwave remotely-sensed soil moisture products. Root-zone soil moisture is estimated by applying a recursive exponential filter to the near-surface soil moisture observations [21, 22], as described in the supplementary information. While soil moisture observations exist prior to 2008, they are temporally too sparse to permit for evaluating how weather variations influence yield (figure S1(d)). Note that we exclude 2007, which has substantially more data than previous years, because only five grid boxes have over 60% of days available during the critical growing season.
Maximum daily temperature is selected to represent atmospheric demand, rather than the commonly used vapor pressure deficit, because temperature is more widely measured in this region and is highly correlated with vapor pressure deficit. Daily maximum temperature estimates based on weather station observations are from the National Oceanic and Atmospheric Administration's Climate Prediction Center [23]. These data are provided at a 0.5 degree spatial resolution, and are regridded to match the 0.25 degrees soil moisture data. For consistency when comparing models, we exclude temperature data on days when soil moisture is missing.
Studies have often used seasonal averages when relating weather and yield outcomes (e.g. [7, 17]), but at seasonal timescales temperature and root-zone soil moisture are strongly anticorrelated (r = −0.74 from 2008 to 2016; figure 2(b) and figure S1(c)). Tight coupling between temperature and moisture at seasonal timescales makes it difficult to statistically determine if yield damages in warm, dry years are due to high temperatures, which are expected to increase with climate change in this region, or water limitations, which are expected to decrease with climate change in this region. Soil moisture and temperature are less physically coupled at the daily timescale (r = −0.28; figure 2(c)), however, because root-zone soil moisture integrates water fluxes from days to months and, thus, is often in disequilibrium with the overlying atmosphere. We, therefore, construct a statistical model of yield variability that resolves daily soil moisture and maximum temperature observations.
First, we consider a 1D model of the influence of temperature on SIF wherein daily effects are cumulative over time during the January through April period, and thus additively substitutable over a given season [24]. We model the seasonal average  , rather than daily SIF, in order to help suppress noise in daily SIF observations [16],
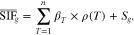
SIF in grid box g is modeled as sensitivity, βT, in units of mW m−2nm−1 sr−1 day−1, times exposures, ρ, in units of number of days associated with a given temperature, summed over n different bins that temperature is resolved into. Also included is a grid-box level fixed effect, Sg, that represents mean-state variations independent of temperature and soil moisture. To account for the fact that soil moisture and temperature observations are not necessarily available every day, the value of ρh is multiplied by No/Ng, where No is the total number of days between January through April and Ng is the total number of days in which SIF is observed in grid box g. T indexes intervals of temperatures that are bounded by the 2.5% and 97.5% quantiles of temperature on all days between January through April, which are 21 °C and 32 °C, respectively. βT and Sg are estimated using a linear mixed effects model without a global intercept. An analogous equation is written for soil moisture with the 2.5% and 97.5% quantiles equal to 0.10 cm3 cm−3 and 0.33 cm3 cm−3, respectively. The 1D fits for temperature and soil moisture are shown in figure S4.
In order to account for interactions between moisture supply and temperature, a 2D version of equation (1) is postulated [25],
Values of T and soil moisture (SM) are resolved at the same spacing as for equation (1). Results from equation (2) indicate that soil moisture and temperature interact in determining tea productivity, with yields remaining high regardless of temperature when sufficient soil moisture is present (figure 3(a)).

Figure 3. Modeling Kenyan tea outcomes as a function of soil moisture and maximum temperature. (a) Using observations, we infer the daily response of yield, for which we use SIF as a proxy, to maximum daily temperature and root-zone soil moisture. Each square represents an estimate of daily-yield sensitivity (i.e., β coefficients). All fit coefficients significantly differ from zero (p < 0.05). The size of the square represents the relative number of days within each bin (see figure 2(c) for a complete 2D histogram of the data). A polynomial surface fit to daily SIF sensitivities is plotted behind the squares. Each orange arrow represents the predicted change in root-zone soil moisture and maximum temperature from one CMIP5 model simulation from current (1990–2020) to future climates (2040–2070; see table S3 for a list of the 23 CMIP5 models). For reference, the average of the observations (2008–2016) is plotted with an open circle. (b) Observed yield is predicted directly from SIF observations (r = 0.93; RMSE = 506 hg/ha) and from soil moisture and temperature observations (r = 0.99; RMSE = 362 hg/ha).
Download figure:
Standard image High-resolution image
Codependencies of SIF on temperature and moisture are consistent with plant physiology, in general [26], and tea plants, in particular [27, 28]. In tea plants the foliar relative water content and water potential decline when moisture in the soil is limiting, decreasing the photosynthetic rate via stomatal closure [5, 27]. Leaf temperature, which is typically 2 °C–12 °C higher than air temperature [3], also directly influences the photosynthetic rate of tea, shoot growth, and the rate of shoot initiation [2], with adverse effects at high temperature. When soil water is not limiting, transpiration can reduce leaf temperature via latent cooling, as demonstrated by the sustained productivity when both temperature and soil moisture are high. Field studies have, in fact, demonstrated a strong linear relationship between transpiration and tea yield [29]. Detrimental effects of waterlogging, which are strongly exhibited by maize [25], are not evident in this region from 2008 to 2016, likely because tea plants require deep, well-drained soils [2] and, as a perennial, are more efficient at transporting excess moisture via leaves and roots.
Modeled estimates of SIF using the 2D response function are well correlated with observations at the grid-box scale when averaged over the critical growing season (r = 0.77; figure S5a). For each year, the spatial correlation varies from 0.62 in 2015 to 0.83 in 2013 with a median of 0.75 across all nine years (figure S6). Averaging across space gives a higher correlation between model results and SIF (r = 0.96, figure S5b). In constructing the average, missing grid-box data is infilled with the mean across all other years in order not to introduce spurious correlations associated with missing data. Though there are 28 grid boxes in total, there is at least one grid box missing for each year due to a lack of sufficient soil moisture observations, with 2008 missing three, 2009 missing two, and 2012 missing four. Furthermore, the linear relationship between observed SIF and yield allows for annual national yields to be predicted from our soil-moisture and temperature model, capturing nearly all possible variability (r = 0.99, figure 3(b)).
When compared to other statistical models for this nine-year interval, the soil moisture and temperature yield model predicts yield outcomes better than fitting a linear regression to either seasonally averaged temperature or soil moisture alone (figure S7), or using either daily soil moisture or temperature observations to predict yields (table S2). Using only soil moisture or only temperature, the correlation declines from 0.99 to 0.92 and 0.90, respectively, and the RMSE increases from 362 hg ha-1 to 623 hg ha-1 and 744 hg ha-1, respectively, highlighting the importance of including interactions between moisture supply and demand in the yield model framework (figure S8). Without modeling interactions, the response of SIF to each variable alone (figure S4) would suggest that warmer or drier conditions invariably lead to reduced yield. In fact, increases in temperature can be beneficial when combined with sufficient increases in soil moisture.
4. Future yield anomalies
As a final point of analysis, we use our historical fit to observations along with climate model simulations to explore possible future changes in yield. Specifically, a single simulation from each of 23 global climate models in the Coupled Model Intercomparison Project Phase 5 (CMIP5) for Representative Concentration Pathway (RCP) 8.5 (table S3) is used to evaluate changes in root-zone soil moisture and maximum air temperature between present (1990–2020) and future (2040–2070) climates. We grid near-surface maximum air temperature (variable name 'tasmax' in CMIP5) and each layer of soil moisture (variable name 'mrlsl' in CMIP5) from all CMIP5 models to a common one-degree spatial resolution using netCDF operators (NCO) [30]. In the regridding process, we use a bilinear algorithm for temperature and an algorithm that conserves the total amount of water globally in each soil layer for soil moisture. To estimate root-zone soil moisture between 0 to 100 cm, we weight the layers of soil moisture by the fraction of the depth each represents.
To simulate daily conditions in future climates, we shift the daily root-zone soil moisture and maximum temperature observations by the average predicted change from current (1990–2020) to future (2040–2070) climates across Kenya's tea regions for each CMIP5 model. We use two methods to estimate the associated change in yield, both of which give similar responses. First, we use the daily SIF response inferred from equations (1)–(2) directly. Where simulated data extends beyond the observational range, we specify the corresponding sensitivity in the edge bin. In the second method, we extrapolate the SIF response beyond those conditions observed in 2008–2016 by fitting functional forms to the inferred daily SIF responses. Specifically, we fit lines to the temperature and soil moisture responses inferred from equation (1) (figure S4) and a polynomial surface with two degrees for temperature and two degrees for root-zone soil moisture to the nine coefficients in equation (2) (background in figure 3(a)). Results from both methods are listed in table S3, and those from the latter are reported in the main text.
The 23 global climate models from CMIP5 show consistent increases in maximum daily temperature and more variable, though generally increasing, changes in root-zone soil moisture from 1990–2020 to 2040–2070 after averaging across Kenya's tea growing region (3(a); table S3). Specifically, maximum daily temperature is predicted to rise by an average of 1.6 °C across the tea growing region during the critical growing season, with a range of 0.7 °C to 2.4 °C across CMIP5 models. Soil moisture is predicted to rise by an average of 0.01 cm3 cm−3, ranging from −0.016 cm3 cm−3 to 0.045 cm3 cm−3. Predicted changes in root-zone soil moisture are spatially variable, with only 15 of the 23 models predicting increases across all 28 grid boxes, but all 23 models predict increases in temperature across the 28 grid boxes (figure S9–S10). The greatest seasonal warming is predicted to occur during the summer (June–August) with the average across models being 2 °C (figure S9), but lower baseline temperatures and higher soil moisture relative to the critical growing season is anticipated to minimize damages.
Using our yield model (equation (2)), we estimate a decline in tea yields in 2040–2070, relative to 1990–2020, that averages 5% across the 23 CMIP5 models, ranging from a loss of 12% to a gain of 1%. If only dependence on temperature were considered, the damages inferred from the simulated warming in CMIP5 would be erroneously inferred at approximately twice the magnitude (table S3). This difference in damage magnitudes relates to the strong correlation between warmer and drier conditions in historical interannual variations, such that estimates based solely on temperature implicitly equate warming with drying, whereas the CMIP5 simulations indicate that the yield effects associated with multidecadal trends towards warming will be partially offset by wetter conditions. These predictions assume that the CMIP5 simulations are capturing changes well from historical to future climate conditions. Note that these predictions are based upon CMIP5 simulations that may not accurately predict either present or future climate conditions. There are large differences in the historical (1990–2020) mean states between climate models (start of arrows in figure 3(a)). Furthermore, substantial differences between observed rainfall trends and those simulated across CMIP5 models are evident in Eastern Africa [31].
5. Conclusions
SIF affords a spatially and seasonally resolved indication of growth that appears linearly related to yield. Training a model about how soil moisture and temperature variations influence yield upon these SIF observations affords greater constraint for model parameters than would be possible from the available nine years of nationally-reported yield data alone. That said, our model does not capture a number of important processes. Factors such as frost, hailstorms, and pests, are not included, though losses incurred by such events can be substantial for tea [2]. The timing of climatic events, such as the onset and retreat dates of the seasonal rains, may also play a role in historical and future tea production [32] and should be investigated in future studies.
Increases in atmospheric carbon dioxide concentration may also affect yield by improving photosynthetic rates in tea leaves [33]. This effect of carbon fertilization has the potential to alter the terrestrial water balance by increasing water use efficiency [34]. Given the relatively short time series of observational data, however, these effects would be better explored in future studies using process-based crop models (e.g. [13]) or free air concentration experiments (e.g. [33, 35]).
There is only a limited amount of suitable land that would allow for the adaptation of Kenyan tea production to a changing climate by moving farms to higher elevation [36], but there does appear to be the potential for adapting to warmer conditions through planting tea cultivars with higher optimal temperature thresholds and improved ability to access soil moisture through greater rooting depths [3]. Such tea cultivars maintain a higher relative water content and exhibit less decline in photosynthesis under water stress [5]. Planting such cultivars, however, involves a long-term commitment because tea plants require at least three years of maturation before harvest and have an economic lifespan of 50–60 years [3]. Improving predictions of changes in temperature and soil moisture in the Kenyan highlands, along with further research into the implications for yield outcomes, thus seems warranted prior to major investments in planting different cultivars.
Acknowledgments
We thank Missy Holbrook for helpful comments. Financial support was provided by The Rockefeller Foundation Planetary Health Fellows program at Harvard University (AR), the Harvard University Center for African Studies (VO), and the Harvard Global Institute (PH).
Data Availability
All data used in this study are freely available online. The data that support the findings of this study are also available from the corresponding author upon request.