

Abstract
The Air Pollution Prevention and Control Action Plan (referred to as the Action Plan henceforth) provides a golden opportunity for China to evaluate whether the remarkable air quality improvements as a result of the plan have brought about health benefits to residents. Based on the ground-level particulate matter with an aerodynamic diameter of less than 2.5 μm (PM2.5) concentrations and the daily respiratory–cardiovascular mortality, we aimed to assess changes in the mortality effect associated with short-term exposure to PM2.5 due to the implementation of the Action Plan in Beijing. We analyzed the changes in PM2.5 concentrations and air quality during the pre- and post-emission reduction periods. We then used the generalized additive model to estimate the changes in mortality risk associated with PM2.5 exposure during both periods. We found that following the introduction of the Action Plan, the annual average PM2.5 concentrations declined from 101.7 μg m−3 in 2013 to 58.6 μg m−3 in 2017, attaining the target of the plan (60 μg m−3). The remarkable reduction in PM2.5 concentrations has led to a marked decrease in mortality risk. Compared with the pre-emission reduction level, total respiratory mortality decreased from 0.56% (95% CI: 0.40%–0.73%) to 0.43% (95% CI: 0.23%–0.63%), while the total cardiovascular mortality decreased from 0.44% (95% CI: 0.37%–0.52%) to 0.29% (95% CI: 0.19%–0.39%). Significant decreases were also observed in sex-specific subgroups. Our study implied that the significant efforts of the nation to clean China's air has yielded positive results of air quality improvement and human health protection in Beijing. However, the ambient air pollution in Beijing remains severe. The PM2.5 concentrations still exceed the level (annual average of 10 μg m−3) recommended by the World Health Organization. Thus, consistent efforts are required to implement the emission abatement measures to continuously curb air pollution and protect public health.
Export citation and abstract BibTeX RIS

Original content from this work may be used under the terms of the Creative Commons Attribution 4.0 licence. Any further distribution of this work must maintain attribution to the author(s) and the title of the work, journal citation and DOI.
1. Introduction
Over recent decades, China has sprung up as a global economic power, largely through the energy-intensive construction of infrastructure [1]. The rapid economic expansion and industrial development are accompanied by increasingly severe air contamination, causing China to be identified as one of the global 'hot spots' in terms of the large anthropogenic aerosol emission. Due to the huge impact on social and economic development as well as on human health [2–5], air pollution, in which particulate matter with an aerodynamic diameter of less than 2.5 μm (PM2.5) constitutes the major pollutant, has become a matter of deep public concern in China.
To improve air quality and secure public health, the Chinese government has launched a number of ambitious national work plans to control PM2.5 pollution in the last decade. Such plans include the sulfur dioxide (SO2) and nitrogen oxides (NOX) emission reduction plan during the 11th (2006–2010) [6] and 12th (2011–2015) Five Year Plan periods [7]. However, these strategies seemed to be insufficient, since eastern China has continued to experience severe, frequent, and long-lasting haze episodes in recent years. To prevent further deterioration of air quality, the State Council of China promulgated the toughest and largest-scale unprecedented clean air action plan, the Air Pollution Prevention and Control Action Plan (referred to as the Action Plan henceforth) in September 2013 [8]. The Action Plan clearly set the target of reducing PM2.5 concentrations by 25%, 20%, and 15% in Beijing-Tianjin-Hebei, Yangtze River Delta, and Pearl River Delta regions by 2017 compared to the 2012 level, respectively.
Inspired by the strong willingness and enthusiasm of China's government to curb air pollution, the national and local governments have taken substantial measures to support the implementation of the Action Plan. Encouragingly, dramatic declines have been noted in PM2.5 concentrations throughout China since 2013 [9–11]. Meanwhile, the most stringent clean air action in the history of China provides a crucial opportunity for the nation to evaluate whether the remarkable air quality improvements brought about health benefits to residents. Such assessment has far-reaching importance. On one hand, it is valuable to evaluate the effectiveness of the Action Plan, because of the important implication for further decision-making on air pollution control strategies in China. On the other hand, at present, despite the great improvement in some regions globally, air pollution in many parts of the world has continued to worsen, particularly in developing countries. This is due to the industrialization and global industrial transfer (the major reason for economic progress, as in China). Thus, China's strategies to tackle air pollution could provide a useful reference for other developing countries.
To date, several studies have been conducted at regional and national levels to evaluate the effectiveness of the Action Plan. These studies have consistently indicated the health benefits of the improved air quality following the implementation of the Action Plan [12–19]. However, such studies had limitations, as follows. (1) Uncertainties in deriving estimates from PM2.5 exposure data. Due to the advantage of not being restricted in terms of spatial and temporal coverage, chemical transport model (CTM) simulations or satellite measurements are widely used to estimate PM2.5 concentrations, which inevitably also lead to limited accuracy of the PM2.5 data compared to that of data from ground observations. (2) Uncertainties deriving estimates using the health effect assessment approach. Most studies used the integrated exposure–response model (IER model) to estimate the health benefits of PM2.5 reduction; however, the IER parameters were estimated from limited epidemiological studies and need to be refined in relation to updated studies. To our knowledge, so far, there has been no study that simultaneously utilized ground-level PM2.5 concentrations and real health data to assess the health benefits of the Action Plan in China. In addition, it is unclear whether and how the exposure–response associations between air pollutant exposure and health endpoints have changed following the pollution control policy.
In the capital, one of the most densely populated and severely polluted cities in China, air pollution and associated health hazards have led to deep national and international public concerns [20, 21]. In the present study, based on the ground-level PM2.5 concentration data and the daily respiratory–cardiovascular mortality data, we assessed changes in PM2.5 concentrations, air quality level and mortality effects associated with short-term exposure to PM2.5 in Beijing during the pre- and post-emission reduction periods.
2. Materials and methods
2.1. Meteorological data
Daily meteorological data, including the mean temperature, precipitation, pressure, wind speed, and relative humidity (RH), were obtained from the Beijing Meteorological Observation Center, a national basic weather station (see figure S1, available in the online supplementary material at stacks.iop.org/ERL/15/034052/mmedia). With the most advanced meteorological instruments, the station is mainly devoted to the observation and collection of meteorological data at high altitudes and on the ground. The station has a good regional representation of changes in Beijing meteorological conditions, and is the only station in Beijing that participates in the exchange of meteorological data globally. All acquired data are subject to strict quality control and inspection by specially trained observers at the station.
2.2. PM2.5 concentrations
Daily average concentrations of PM2.5 were derived from the US Embassy (USE) in Beijing (figure S1), which is located in the Chaoyang District, a densely populated urban area with no industrial pollution source nearby. Hourly PM2.5 concentrations are measured using beta ray methods and are reported and made available via the Internet in real time by the USE. Days with consecutive data gaps of more than 3 h or with cumulative missing data exceeding 12 h for the hourly PM2.5 concentrations were excluded from the analyses [21]. Ultimately, we retrieved successive PM2.5 observations which covered the period from March 1, 2009 to December 31, 2017.
PM2.5 concentrations were not routinely monitored in Beijing on a large scale until 2013; thus, only few stations carried out the observation of PM2.5 concentrations before 2013. To demonstrate the credibility of the USE PM2.5 data to characterize the Beijing changes in PM2.5 concentrations, we collected the daily average PM2.5 concentrations of 35 monitoring stations (which were average values of the daily average PM2.5 concentrations in 35 monitoring stations) in Beijing (figure S1) during 2013–2017 from Beijing Municipal Environmental Monitoring Center (BMEMC). As shown in figure 1, during the period from 2013 to 2017, from both monthly and annual temporal perspectives, PM2.5 data from the USE matched well with the data trend from BMEMC. In addition, we calculated the Spearman correlation coefficients of the daily PM2.5 concentrations between the two stations for each year. The Spearman correlation coefficients were all statistically significant (P < 0.01), at 0.98, 0.98, 0.99, 0.98, and 0.98 for 2013, 2014, 2015, 2016, and 2017, respectively. The above analyses indicated that PM2.5 data derived from the USE showed a good regional representation for the changes in PM2.5 concentrations in Beijing and are reliable for further analysis.
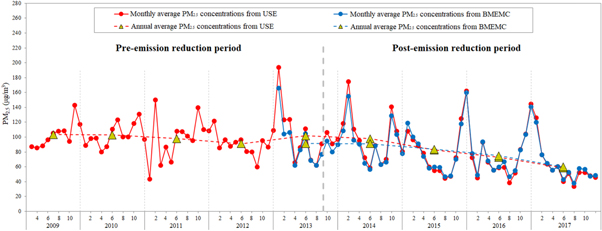
Figure 1. The monthly and annual trend of average PM2.5 concentrations in Beijing, China. The blue solid and dotted lines represent monthly and yearly variations of PM2.5 concentrations from 1 January 2013 to 31 December 2017 measured by Beijing Municipal Environmental Monitoring Center, respectively. The red solid and dotted lines represent monthly and yearly variations of PM2.5 concentrations from 1 March 2009 to 31 December 2017 measured by the US Embassy in Beijing, respectively.
Download figure:
Standard image High-resolution image2.3. Mortality data
Daily mortality data from 1 March 2009 to 31 December 2016 for urban residents in Beijing were obtained from the Chinese Center for Disease Control and Prevention. Causes of death were coded according to the International Classification of Disease, 10th Revision (ICD–10). Mortality data were classified into cause-specific categories, inclusive of deaths due to respiratory disease (RD) (J00–J98) and cardiovascular disease (CVD) (I00–I99). The total mortality data for each specific cause were further classified by sex (male and female).
2.4. Statistical methods
It is generally assumed that the number of daily deaths is a small probability event and follows the Poisson distribution. Therefore, we used the generalized additive model (GAM) to estimate the mortality risks associated with PM2.5 exposure. The potential nonlinear effects of some confounding factors, such as the long-term trend, seasonal variations, and weather conditions, can be adjusted for by nonparametric smoothing functions in the GAM. The model is given as follows:
where E(Yk) is the expected number of deaths on day k; α is the intercept; DOW is the indicator variable for the day of the week; β is the log-relative risk of mortality associated with a 10 μg m−3 increase in PM2.5; Xk is the PM2.5 concentrations on day k; s is the smoothing spline function; time is the calendar time; df is the degrees of freedom; Zk is a term that represents the influence of meteorological elements on day k. Akaike's information criterion (AIC) is deployed to determine whether a meteorological element is incorporated in the model and the value of df. A model with lower AIC values fits the data better than one with higher AIC values. Daily mean temperature and RH, which could lower the AIC values of the model, were finally incorporated with 6 df and 3 df, respectively.
Since the continuous monitoring data for PM2.5 observations were available from 1 March 2009, thus, in the present study, taking the day when the Action Plan was released (10 September 2013) as the cut-off time point, we defined the period from 1 March 2009 to 9 September 2013 as the pre-emission reduction period and the period from 10 September 2013 to 31 December 2016 as the post-emission reduction period. Mortality estimates associated with PM2.5 exposure on the current day and over a lag of up to six days (lag0–lag6) were examined. For example, lag0 represents the current exposure day, lag1 represents the exposure of the previous day.
2.5. Sensitivity analyses
We performed a series of sensitivity analyses to verify the robustness of our findings as follows: (1) Changing the df of the smoothing spline function from 4 to 7 for calendar time. (2) Changing the df of the smoothing spline function with 3, 5, 7, and 9 for mean temperature and RH. (3) Adjusting for other meteorological factors including precipitation, wind speed, and pressure in the core model. The results of the sensitivity analyses are presented in tables S1–S4.
The excess risk (ER%) was used to express the increase in the percentage of daily mortality per 10 μg m−3 increase in PM2.5 concentration. All analyses were performed using the MGCV package in R software (R 3.5.1). All statistical tests were two-sided and P < 0.05 was considered statistically significant.
3. Results
3.1. Data Description
Table 1 summarizes the descriptive statistics of the meteorological variables, PM2.5 concentrations, and daily deaths due to RD and CVD, during the pre- and post-emission reduction periods. The boxplots of PM2.5 concentrations and the number of daily deaths during the two periods are also shown in figure 2. After the emission reduction, the daily average PM2.5 concentrations decreased from 99.3 μg m−3 to 85.7 μg m−3; the daily average deaths from CVD also decreased obviously, from 103.2 to 90.6 for the total population. However, the daily average deaths from RD increased, from 20.9 to 21.6 for the total population. There were no obvious changes in meteorological conditions between both periods.
Table 1. Summary statistics of daily deaths, meteorological factors, and PM2.5 concentrations during the pre- and post-emission reduction periods in Beijing, China.
| Pre-emission reduction period | Post-emission reduction period | |||||
|---|---|---|---|---|---|---|
| 1 Mar 2009 to 9 Sep 2013 (1654 days) | 10 Sep 2013 to 31 Dec 2016 (1209 days) | |||||
| Mean | SD | IQR | Mean | SD | IQR | |
| Meteorological variables | ||||||
| Mean temperature (°C) | 13.8 | 11.6 | 21.8 | 13.5 | 10.8 | 20.6 |
| Precipitation (mm) | 1.8 | 7.5 | 0.0 | 1.3 | 9.0 | 0.0 |
| Wind speed (m s−1) | 2.2 | 0.9 | 1.0 | 2.1 | 0.9 | 1.0 |
| Pressure (hPa) | 1011.6 | 10.2 | 16.4 | 1013.5 | 9.8 | 16.6 |
| Relative humidity (%) | 52.1 | 20.2 | 33.0 | 52.8 | 19.9 | 32.0 |
| PM2.5 concentrations | ||||||
| PM2.5 (μg m−3) | 99.3 | 74.4 | 87.1 | 85.7 | 75.6 | 79.6 |
| Daily death counts | ||||||
| Respiratory disease | ||||||
| Total | 20.9 | 6.6 | 9.0 | 21.6 | 6.7 | 8.0 |
| Male | 11.7 | 4.3 | 5.0 | 12.4 | 4.3 | 5.0 |
| Female | 9.1 | 3.8 | 5.0 | 9.2 | 3.7 | 5.0 |
| Cardiovascular disease | ||||||
| Total | 103.2 | 20.2 | 29.0 | 90.6 | 17.7 | 24.0 |
| Male | 56.6 | 12.1 | 16.0 | 49.8 | 10.5 | 14.0 |
| Female | 46.6 | 10.6 | 15.0 | 40.8 | 9.4 | 13.0 |
PM2.5: particulate matter with an aerodynamic diameter less than 2.5 μm; SD: standard deviation; IQR: interquartile range.
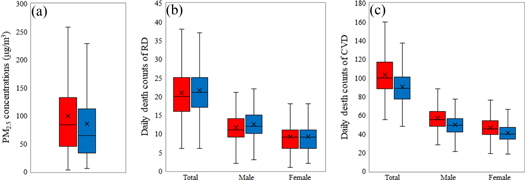
Figure 2. Boxplots of (a) PM2.5 concentrations, (b) daily death counts of respiratory disease, and (c) daily death counts of cardiovascular disease during the pre-emission reduction (red shade) and post-emission reduction (blue shade) periods in Beijing, China. In the box-and-whisker plots, the whisker top and whisker bottom represent the maximum and minimum, respectively. The box top and box bottom represent the 75th and 25th percentiles, respectively. The line across the box is the median value, and the cross symbol is the mean value.
Download figure:
Standard image High-resolution image3.2. Changes in PM2.5 concentrations and air quality level
Figure 1 exhibits the monthly and yearly trends in average PM2.5 concentrations in Beijing during 1 March 2009 to 31 December 2017. In terms of monthly variations, the highest PM2.5 concentrations were observed in autumn and winter (September to February of the following year). For instance, the average PM2.5 concentrations peaked in November at 142.8 and 131.1 μg m−3 for 2009 and 2010, respectively. Over the nine-year period, the monthly average PM2.5 concentrations reached its peak in January 2013 at 194.0 μg m−3. For the yearly variations, the annual average PM2.5 concentrations declined slightly from 103.3 μg m−3 to 91.0 μg m−3 between 2009 and 2012, then increased to 101.7 μg m−3 in 2013. By comparison, following the release of the Action Plan, the annual average PM2.5 concentrations showed a clear decreasing trend from 101.7 μg m−3 in 2013 to 58.6 μg m−3 in 2017.
Furthermore, according to the Technical Regulation on Ambient Air Quality Index (on trial) (HJ 633—2012), we classified the daily PM2.5 concentrations into six levels to analyze the changes in air quality level during the pre- and post-emission reduction periods. As shown in table 2, compared with the air quality level before emission reduction, the proportion of relatively clean days (defined as a daily PM2.5 concentration ≤ 75 μg m−3) increased and weather conditions with mild, moderate, and serious pollution decreased after emission reduction. However, the proportion of weather conditions with severe pollution increased slightly. These changes indicated overall improvements in air quality in Beijing following the release of the Action Plan.
Table 2. Changes in air quality during the pre- and post-emission reduction periods in Beijing, China.
| Pre-emission reduction | Post-emission reduction | ||||
|---|---|---|---|---|---|
| PM2.5 concentrations (μg m−3) | Air quality | Number of days | Percentage (%) | Number of days | Percentage (%) |
| 0–35 | Excellent | 319 | 19.3 | 323 | 26.7 |
| 35–75 | Good | 427 | 25.8 | 381 | 31.5 |
| 75–115 | Mild pollution | 385 | 23.3 | 214 | 17.7 |
| 115–150 | Moderate pollution | 197 | 11.9 | 107 | 8.9 |
| 150–250 | Serious pollution | 253 | 15.3 | 125 | 10.3 |
| > 250 | Severe pollution | 73 | 4.4 | 59 | 4.9 |
PM2.5, particulate matter with an aerodynamic diameter less than 2.5 μm.
3.3. Changes in mortality risks
To analyze changes in mortality risks of RD and CVD between the pre- and post-emission reduction periods in detail, we classified the daily average PM2.5 concentrations into ten levels, i.e., 0–30 μg m−3, 30–60 μg m−3, 60–90 μg m−3, ...... , 240–270 μg m−3, and > 270 μg m−3. We then calculated the daily average deaths due to RD and CVD by different PM2.5 concentration levels (figures 3(a) and (b)). During both periods, the daily average death counts due to RD and CVD showed upward trends with increases in PM2.5 concentrations. After the emission reduction period, the daily deaths from CVD generally decreased except an increase when PM2.5 was within the range of 150–180 μg m−3, whereas daily deaths due to RD generally increased.

Figure 3. (a) and (b) Average daily death counts due to respiratory disease (RD) and cardiovascular disease (CVD); (c) and (d) death rates of RD and CVD. The red circles represent the mortality risks during the pre-emission reduction period. The blue circles represent the mortality risks during the post-emission reduction period.
Download figure:
Standard image High-resolution imageHowever, these changes in the number of daily deaths may be affected by changes in the number of permanent residents in Beijing. According to the statistics issued by Beijing Municipal Bureau of Statistics, the number of permanent residents in Beijing showed a consistent increase during our study period (http://tjj.beijing.gov.cn/tjsj/cysj/201907/t20190709_153988.html). Therefore, we analyzed variations in the death rates of RD and CVD to control for the influence of changes in the number of permanent residents (figure S2). From 2009 to 2016, RD death rates decreased slightly (from 40.5 10−5 in 2010 to 34.8 10−5 in 2015), while CVD deaths rates decreased significantly (from 201.1 10−5 in 2010 to 140.6 10−5 in 2015). Furthermore, we analyzed changes in the deaths rates of RD and CVD during the pre-emission (from 2012 to 2012) and post-emission (from 2014 to 2016) reduction periods, by different PM2.5 concentration levels (figure 3(c) and (d)). After the emission reduction period, CVD death rates generally declined at different PM2.5 levels. For example, when PM2.5 concentrations ranged from 120 to 150 μg m−3, CVD death rates decreased from 18.0 10−5 before the emission reduction to 10.6 10−5 after the emission reduction period. However, despite the general decline, the obvious increase in RD death rates at low PM2.5 concentrations (≤60 μg m−3) is also noteworthy. Meanwhile, we changed the definition of the pre-emission reduction period, which may have an influence on death rates. These results indicated that the obvious increases in RD death rates at low PM2.5 concentrations after emission reduction was robust (figures S3–S5).
3.4. Changes in short-term effect of PM2.5 exposure on daily mortality
Figure 4 graphically presents the lag patterns of the associations between PM2.5 exposure and daily mortality before and after the emission reduction in Beijing. After emission reduction, the lag patterns did not change significantly, whereas the ER% generally decreased. The effect estimates at lag0 and lag1 were all statistically significant for both mortality outcomes during both periods. Generally, the estimated mortality risks peaked at exposure day (lag0) and gradually declined to below zero with the increase in lag days.
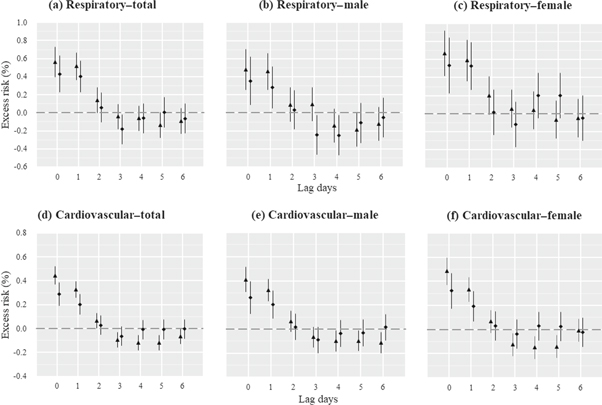
Figure 4. Estimated excess risk (ER%) for (a) total, (b) male, and (c) female respiratory mortality; and (d) total, (e) male, and (f) female cardiovascular mortality per 10 μg m−3 increase in PM2.5 concentrations at lag0–6 and the associated 95% confidence intervals during the pre-emission reduction (triangle symbols) and post-emission reduction (diamond symbols) periods in Beijing, China.
Download figure:
Standard image High-resolution imageAs listed in table 3, ER% at lag0 was chosen to analyze changes in mortality risks associated with each 10 μg m−3 increase in PM2.5 concentrations during the pre- and post-emission reduction periods. Changes in mortality risks are also graphically delineated in figure 5 to visually reflect the mortality benefits of improved particulate matter pollution. After the implementation of the Action Plan, the estimated risks associated with each 10 μg m−3 increase in PM2.5 concentration decreased for respiratory mortality, from 0.56% (95% CI: 0.40%–0.73%) to 0.43% (95% CI: 0.23%–0.63%) for the total, 0.48% (95% CI: 0.26%–0.70%) to 0.36% (95% CI: 0.09%–0.62%) for males, and 0.67% (95% CI: 0.42%–0.92%) to 0.54% (95% CI: 0.23%–0.84%) for females. For cardiovascular mortality, the estimated effects also reduced from 0.44% (95% CI: 0.37%–0.52%) to 0.29% (95% CI: 0.19%–0.39%) for the total, 0.41% (95% CI: 0.31%–0.51%) to 0.26% (95% CI: 0.13%–0.39%) for males, and 0.48% (95% CI: 0.37%–0.60%) to 0.32% (95% CI: 0.18%–0.47%) for females.
Table 3. Estimated excess risk (ER%) of respiratory and cardiovascular mortality (95% CI) per 10 μg m−3 increase in PM2.5 concentration during the pre- and post-emission reduction periods in Beijing, China.
| Pre-emission reduction period | Post-emission reduction period | |||
|---|---|---|---|---|
| ER (%) (95% CI) | P value | ER (%) (95% CI) | P value | |
| Respiratory disease | ||||
| Total | 0.56 (0.40–0.73) | <0.001 | 0.43 (0.23–0.63) | <0.001 |
| Male | 0.48 (0.26–0.70) | <0.001 | 0.36 (0.09–0.62) | 0.009 |
| Female | 0.67 (0.42–0.92) | <0.001 | 0.54 (0.23–0.84) | <0.001 |
| Cardiovascular disease | ||||
| Total | 0.44 (0.37–0.52) | <0.001 | 0.29 (0.19–0.39) | <0.001 |
| Male | 0.41 (0.31–0.51) | <0.001 | 0.26 (0.13–0.39) | <0.001 |
| Female | 0.48 (0.37–0.60) | <0.001 | 0.32 (0.18–0.47) | <0.001 |
CI: confidence interval; PM2.5: particulate matter with an aerodynamic diameter less than 2.5 μm.

Figure 5. Changes in respiratory and cardiovascular mortality risks associated with short-term exposure to PM2.5 in Beijing during the pre-emission reduction (red columns) and post-emission reduction (blue columns) periods.
Download figure:
Standard image High-resolution image
3.5. Sensitivity analyses
In the sensitivity analyses, altering the df value for temporal trends in the range of 4–7 (table S1), 3, 5, 7, and 9 for the mean temperature (table S2) and RH (table S3), and adjusting for precipitation, wind speed, and pressure (table S4), produced consistent results. These results indicated that the mortality effect assessments associated with PM2.5 exposure before and after the emission reduction periods were robust.
4. Discussion
The Action Plan aimed to control the annual PM2.5 concentrations in Beijing within the limit of 60 μg m−3 by the end of 2017. Based on the general guidelines of the Action Plan and the local situation, Beijing formulated its own detailed plan (known as the Beijing Clean Air Action Plan of 2013–2017) to promote the goal. The stringent control measures led to noticeable reductions in PM2.5 concentrations and significant improvements in air quality. As shown in our study, the annual average PM2.5 concentrations declined from 101.7 μg m−3 in 2013 to 58.6 μg m−3 in 2017, with a percentage decrease of 42%, to attain the Action Plan target. Meanwhile, compared with the pre-emission reduction level, we observed certain decreases in daily mortality risks associated with short-term exposure to PM2.5 after reduction in emission, from 0.56% (95% CI: 0.40%–0.73%) to 0.43% (95% CI: 0.23%–0.63%) for total respiratory mortality and from 0.44% (95% CI: 0.37%–0.52%) to 0.29% (95% CI: 0.19%–0.39%) for total cardiovascular mortality. Significant decreases were also observed for sex-specific subgroups. Our study contributes to the existing evidence that the determined efforts by the nation against air pollution in China have yielded positive changes in air quality as well as improvement in human health protection.
Ambient air pollution is a significant but preventable risk factor influencing environmental and human health [22]. It has been widely confirmed that national air quality control policies can effectively curb air pollution and improve human health. In the US, reductions in particulate matter pollution due to the enactment of the Clean Air Act led to increased life expectancy [23], decreased mortality risks [24, 25], and improved growth and development of lung function in children [26]. In Western Europe, National and European Union air quality regulations have also led to pronounced improvements in air quality as well as positive health effects [27–29]. In China, besides the Action Plan, a series of short-term but significant pollution control measures were enforced to ensure good air quality during large-scale events, including the 2008 Beijing Olympic Games, 2014 Asia-Pacific Economic Cooperation summit, and the 2015 Grand Military Parade. These measures dramatically ameliorated the air quality [30–32], demonstrating the ability of the Chinese government to control regional air pollution. The improved air quality has also brought about certain health benefits to local residents, including decreased cardiovascular mortality [33] and improvements in lung function [34], cardiac autonomic function [35], and biomarker levels related to systemic inflammation among healthy young adults [36, 37]. However, the implementation and effectiveness of these control measures in China was temporary. After the large-scale events, the air pollution rebounded to previous levels and remained severe [38]. Compared to these temporary plans, the Action Plan is China's longest-term, largest-scale, and toughest clean air policy to date. The implementation of the Action Plan has made significant achievements in both air quality improvement and public health protection, which can be evidenced from the results of our study and several other studies [18, 19, 39, 40].
However, despite the pronounced improvement attributable to the implementation of the Action Plan, the ambient air pollution issue remains severe in Beijing. The level of annual average PM2.5 concentrations is yet to meet the secondary standard (35 μg m−3) of the National Ambient Air Quality Standards (GB3095-2012), let alone the Air Quality Guideline (10 μg m−3) recommended by the World Health Organization (WHO). Moreover, as shown in our results, short-term exposure to daily PM2.5 at the current level is still associated with increased mortality risks related to RD and CVD, so the current air quality is still hazardous to local residents. Thus, more efforts are required to implement the emission abatement measures to continuously mitigate particulate matter pollution in Beijing. A three-year plan called the Blue-Sky Protection Campaign in Beijing was announced by the Beijing government in 2018, which is aimed at decreasing PM2.5 concentrations and the number of days of heavy pollution, as well as improving the air quality and wellbeing of residents.
In addition, it is worth noting that despite the decreased respiratory mortality risk associated with PM2.5 exposure, the daily death count due to RD was higher in the post-emission reduction period than in the pre-emission reduction period. To control for the effect of the yearly increase in the number of permanent residents in Beijing on the number of daily deaths, we analyzed the changes in RD death rates according to different PM2.5 levels during both periods. The results showed a notable increase at low PM2.5 concentrations (≤ 60 μg m−3) after the emission reduction. To explore the possible reasons for this phenomenon, we first assessed the respiratory mortality risk associated with low PM2.5 concentrations before and after emission reduction (figure S6). There was almost no significant change in the risk estimates between both periods, with values of 1.12% (95% CI: −0.27%–2.52%) and 1.14% (95% CI: −0.20%–2.49%) at lag0 before and after emission reduction, respectively. The results indicated that changes in PM2.5 concentration due to the implementation of the Action Plan may not have been the main reason for the increase in RD death rates at low PM2.5 concentrations. Besides PM2.5, abnormal ambient temperature was also a critical risk factor for adverse health outcomes [41, 42]. Thus, we examined the associations between ambient temperature and respiratory mortality at low PM2.5 concentrations (see S1 in the online supplementary information). Compared to the level before emission reduction, the effect estimates of low temperatures after emission reduction increased for each lag day (from lag0 to lag14). For example, every 1 °C decrease in temperature was associated with 1.72% (95% CI: 1.48%–1.96%) and 2.04% (95% CI: 1.72%–2.37%) increases in respiratory mortality at lag7 before and after emission reduction, respectively. These results suggested that the increased death rates of RD after emission reduction may be related to the increased risk of low temperatures for respiratory mortality. However, due to the complexity and varying factors influencing death rates, other possible reasons for the increment in RD death rates at low PM2.5 concentrations after emission reduction remain to be investigated further.
Compared with prior studies, the key strength of our study lies in the fact that we evaluated changes in mortality risks due to the implementation of the Action Plan by comparing the exposure–response associations between daily PM2.5 exposure and mortality (pre- and post-emission reduction periods); earlier studies generally assumed that such an association remained unchanged over time. Our results indicated that different exposure–response relation coefficients should be used for the pre- and post-emission reduction periods when the associations between mortality and short-term exposure to PM2.5 are evaluated in China.
Our study is also subject to several limitations. First, we used PM2.5 observations from only one monitoring station to denote the population exposure across the whole city, thus leading to measurement errors due to spatial variations in air pollution. However, the strong correlations between PM2.5 observations derived from the USE and the 35 monitoring stations in Beijing indicated a good regional representation of PM2.5 data from the USE for changes in PM2.5 concentrations in Beijing. Second, compared with the longer time series of PM2.5 observations from March 2009 to December 2017, the mortality data time limit utilized in our study was up to December 2016. These limited data restricted our ability to estimate the mortality effect of the pollution control policy over the whole implementation time of the Action Plan (from 2013 to 2017). Third, we only estimated the beneficial mortality effects associated with short-term exposure to PM2.5 due to the release of the Action Plan. However, epidemiological evidence suggests that adverse health effects of particulate matter are dependent on both exposure length and exposure concentrations and that the effects of long-term exposure to PM2.5 are larger and more persistent than those of short-term exposure [43]. Therefore, changes in the health effects of long-term PM2.5 exposure due to emission reduction need to be considered and evaluated in future studies.
5. Conclusion
The pollution control measures proposed by the Action Plan in China led to decreased daily mortality risks of short-term exposure to PM2.5 in Beijing due to the remarkable reduction in PM2.5 concentrations. These achievements in such a severely polluted megacity inspire future action against air pollution in China and also serve as a useful reference for other developing countries. However, ambient air pollution in Beijing remains severe. The PM2.5 concentrations still exceed the level recommended by the WHO (annual average of 10 μg m−3 and daily average of 25 μg m−3). Thus, more efforts are needed to implement the emission abatement measures to continuously alleviate particulate matter pollution.
Acknowledgments
This work was supported by grants from the National Key Research and Development Program of China (2016YFA0602004), Special Foundation of National Science and Technology Basic Research (2017FY101201) and Beijing Natural Science Foundation (7182094).
Data availability statement
The data that support the findings of this study are available from the corresponding author upon reasonable request. The data are not publicly available for legal and/or ethical reasons. We also thank the three anonymous referees for their constructive comments.