

Abstract
The physical expansion of urban areas lead to lasting impacts on landscapes and livelihoods. Here, we conduct a global synthesis of trends in urban land expansion, in urban population densities, and lands converted into urban from 1970 to 2010. We find that small-medium urban areas lead their larger counterparts in both rates of urban land expansion and decreases in urban population densities. Urban population densities have consistently declined only in India, China, North America, and Europe with significant exceptions across city sizes. Over 60% of the reported urban expansion was formerly agricultural land with China, Southeast Asia, and Europe in the lead. Counterfactual analysis suggests that, due to the decrease in urban population densities, an estimated 125 000 km2 land was converted to urban land uses that could have otherwise remained in cultivation or as natural vegetation. In particular, in India and Nigeria, with much of their populations dependent on agriculture, 85% and 30% more land, respectively, was converted to urban land due to decreasing urban population densities. With increasing urbanization, proactive management of urban land expansion, especially in small and medium cities, will be critical for saving agricultural lands in peri-urban regions while creating equitable and affordable urban landscapes.
Export citation and abstract BibTeX RIS

Original content from this work may be used under the terms of the Creative Commons Attribution 3.0 licence. Any further distribution of this work must maintain attribution to the author(s) and the title of the work, journal citation and DOI.
1. Introduction
Urban areas directly consume land as their physical footprints expand, often resulting in complete landscape transformation [1–3]. High rates of urban expansion around the world have been shown to lead to the loss of agricultural lands [4, 5], reduce wildlife habitat [6, 7], and alter regional hydrology and climate [8–10]. The speed of growth of urban areas around the world, but especially in developing countries, also stretches the capacity of local and regional governments and institutions to provide sufficient infrastructure and services for their residents [11–13]. These impacts of urbanization are related to the spatial extent and density of urban areas [14, 15]. In particular, higher density urban areas can serve to protect agricultural land and natural habitats and, are generally associated with several social and economic co-benefits [15–18].
Although there is growing evidence from the scientific literature that urbanization is accompanied by declining land-use efficiency, decreasing urban population densities, and loss of agricultural land [19–21], there is little systematic analysis of these trends across different parts of the world, particularly for small to medium-sized cities [22]. One limitation of our current understanding is a lack of knowledge on changing urban land cover in cities of different population sizes and implications of urban land expansion on efficient use of land. The latter takes on a particular significance in rapidly growing small and medium cities in developing countries as urban land expansion outpaces the governance capacity of these cities [23] and affects livelihoods in peri-urban areas [24]. Consequently, how urban areas change the physical landscape within and around them influence several of the specific targets in the United Nations Sustainable Development Goals (SDG) [25, 26]. Among these targets, direct conversion of prime agricultural lands around cities into urban has implications for food security and agricultural livelihoods in peri-urban areas (SDG 2.1 and SDG 2.3). At the same time, rapid urbanization—often synonymous with unplanned and haphazard growth—presents challenges in providing adequate housing and infrastructure such as transport systems to support increasing populations over expanding urban spaces (SDG 11.1, SDG 11.2, and SDG 11.3).
Here, we conduct a synthesis of urban land expansion, urban population density, and urban land conversion from 1970 to 2010. The study synthesizes individual local-level case studies of urban land expansion from around the world (Methods; supplementary section 2 is available online at stacks.iop.org/ERL/15/044015/mmedia). We first study the global and regional trends in rates of urban land expansion as well as in urban population densities since 1970, the earliest year for which we could generate reliable estimates of urban population densities. In addition to the aggregate estimates, we analyze these trends separately in small-medium and large urban centers. We then conduct a counterfactual analysis to explore the implications of these trends in urban population densities for land use. Specifically, we compare the amount of land required to accommodate the urban population growth since 1970 at urban population densities in 2010, and at urban population densities in 1970. Finally, we estimate the extent of agricultural and natural land converted into urban from 1970 to 2010. We discuss the implications of the trends we identify in urban land expansion, urban population densities, and lands converted into urban within the broader context of strategic management of urban growth for saving land and improving urban livelihoods.
2. Methods
2.1. Literature review
We carried out the data analysis on a decadal scale and for the entire time period between the years 1970 and 2010 for area of urban expansion, average annual rates of urban expansion, and urban population density. We reviewed the peer-reviewed English language literature for studies that monitor urban land change. Studies must use satellite or airborne remotely sensed data and be published between 2009 and 2017. We then merged with these studies those published prior to 2009 that were identified in a previous meta-analysis [19]. We used keywords in the SCOPUS database that focused on remote sensing data, cities, urban, and land change. We extracted the urban area extent for different years from studies that we identified in our systematic review of the literature. A detailed description of the data collection methods is provided in the supplementary information. Our criteria for including a study in our database are:
- 1.Study must quantify the urban area extent for at least in one point in time.
- 2.Study must quantify either the rate or amount of urban land expansion over a specific period of time.
- 3.Study area extent must be defined at city, metro, or regional scale (<100 000 km2).
- 4.Study must not repeat the results presented in another paper.
Average annual geometric percent change in urban area extent is calculated as

where  is the extent of the urban area at the beginning of time period, y, measured in years and
  the extent of the study at the end of the time period y.
The utility of using individual case studies is in their sensitivity to the local context, which is, by their nature, absent in global datasets. Moreover, there is currently no global dataset that covers the same time period as we did (1970–2010) at the 30 m spatial resolution (typically, the spatial resolution of the studies included in our synthesis). Thus, the best use of global coverage land cover products remains to be capturing broad regional and global trends. They remain ill-suited for our purpose in this synthesis, that is capturing long-term local-level urban expansion dynamics around the world (see supplementary section 2).
2.2. Estimating urban land expansion rates
We estimate uncertainty in the rates of urban land change using nonparametric bootstrapping of the means by region and globally for each decade. Bootstrapping is particularly effective when sampling from an approximating distribution, that is, when working with limited sample sizes given the entire population of data to estimate a property of an estimator (such as the variability in the regional rate of urban land change) [27]. In each bootstrap sample, a given observation from the original dataset may appear once, multiple times, or not at all. This, in effect, simulates what would happen if a new experiment were conducted. For the entire 40 year study period and each decade, we resample the regional data with replacement. The size of each resample is equal to the size of each of the original datasets. We compute the mean value from the resample for each region and time period. We repeat this procedure 1000 times to derive an estimate of the bootstrap distribution of the means of each region and time period. We report bootstrapped estimates of the means as well as the quartiles of the resulting bootstrap distribution for each region and for each time period. We then use these bootstrapped estimates of decadal rates of urban land change to estimate urban land extents at the turn of each decade as well as urban population densities and their variability across the urban centers in each region.
2.3. Trends in urban population density
To analyze trends in urban population per built-up area, we use a subset of our database that consists of all urban centers for which we could obtain consistent and reliable population estimates over time. To this end, we use the United Nations World Urbanization Prospects (WUP) database [28] that provides urban population count for individual urban areas with a population above 300 000 in five-year intervals. However, the spatial extents to which urban population counts in the WUP database [28] refer may differ from those in the papers that report urban land for respective cities. To minimize this discrepancy, we include in urban population density estimates only those studies where the reported study area extent is consistent with the extent of the corresponding urban center on which the population counts are based in the WUP database. Thus, we eliminate those studies that focus on regions that include more than one urban center as well as those that include the surrounding lands. Typically, such studies take boundaries of a watershed, a basin or an otherwise geographically defined region as the study area boundary. We also eliminate those studies that focus on parts of urban centers (e.g. inner districts or recently developed parts of a metropolitan area). Then, we eliminate any remaining studies that focus on urban centers that are not included in the WUP list of cities with population greater than 300 000 people (as of year 2010). Of the remaining studies, we retain those with study areas of interest that corresponded to urban or metropolitan area boundaries for which population counts are reported in the WUP list. As an additional check, whenever a population count is reported for an urban center in a study, we compare that population count to that reported for the nearest year in the WUP list.
There are two major sources of uncertainty in this approach. First, while we can reasonably assume that the administrative boundaries used to report population counts in the WUP and those used in the studies retained for estimating urban population densities broadly agree, we could not guarantee that these boundaries match exactly. This is because, in the WUP, it is simply stated that corresponding administrative boundaries are used in reporting population counts for each city and metropolitan area but the maps of those boundaries are not provided. Second and more importantly, the administrative boundaries used in the studies and in the WUP may have changed over time; it was not possible for us to ensure the level of congruence between the two for the earlier decades. We adopted a bootstrapping approach in part to address these sources of uncertainty in estimating the population densities for each geographical region around the world. That is, in addition to the variation in the estimates of the urban expansion rates across study sites, we used nonparametric bootstrapping methods to also represent the uncertainty introduced by our approach of combining the population estimates and the estimates of urban land extents.
Overall, this resulted in 611 case studies from 330 urban centers (corresponding to 54% of all case study locations in our synthesis) to generate decadal estimates of urban population density from 1970 to 2010. To capture differences in urban land expansion trends between the small-medium and large urban centers, we plotted trends in urban population, urban land, and urban population density separately for those urban centers with population fewer than 2 million people (small and medium urban centers) and for those with 2 million people or more (large urban centers). We choose 2 million people as the overall threshold population level at which we observe a distinct difference in the coverage of smaller and larger urban centers in our database (figure S5). Setting the threshold at this level—rather than 1 million people, the population level below which the UN considers urban centers as small and medium—also allowed us to have sufficiently large numbers of urban centers for both smaller and larger urban centers.
Following the approach outlined above to generate estimates for decadal urban population densities for each region required leaving aside a large portion of the collection of case studies. Hence, we report annual average rate of urban land expansion also for the entire collection of case studies (figure S6). Urban land expansion rates based only on the case study locations used in urban population density estimates and across the entire set of case study locations largely agree (figures 1(A) and S6).
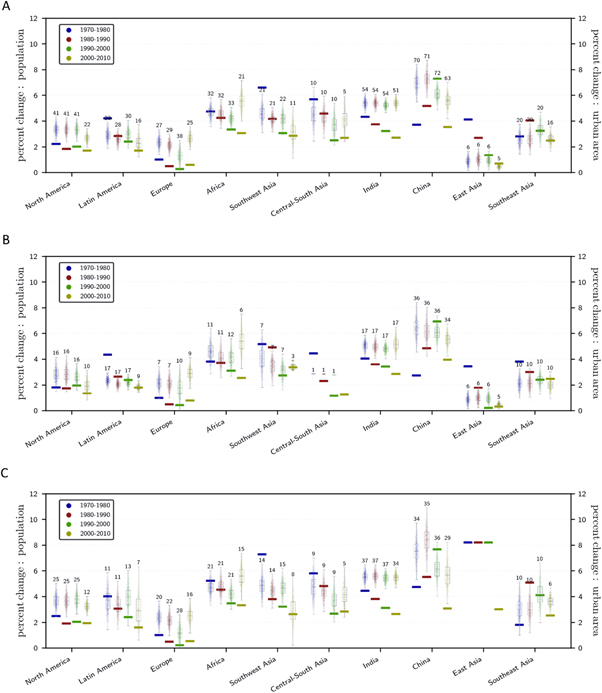
Figure 1. Comparison of two different urban growth measures, urban land and urban population, by region and by decade. Average annual rate of change for urban land and for urban population for (A), all case study locations in our synthesis with a population >300 000; (B), those with a population >2 million (large urban centers), and (C), those with a population >300 000 but <2 million (small-medium urban centers). Box plots show the median, 1st and 3rd quartiles, and lower and upper mild outlier thresholds of bootstrapped averages of annual rate of change for urban land. Population data, aggregated from individual case study locations to the geographic regions in the synthesis, are derived from the UN data on populations of urban agglomerations with a population of 300 000 people or more. Number of locations used in each decadal bootstrapped estimate is shown above the respective box plot. Dashes represent the percent change in urban population. Oceania has too few data points for any trend to emerge and is hence omitted.
Download figure:
Standard image High-resolution imageWe rely on a narrower definition of 'urban' used by most remote-sensing based studies on urban land expansion, which is typically equivalent to impervious surface cover, or built-up land. Our estimates of urban population density are close enough to, for those decades that are available, corresponding published estimates of urban population density [20, 22, 29] (supplementary section 2). Notwithstanding the uncertainties noted above, our approach is consistent across the decades so we emphasize the trends over time, i.e. the relative change in urban population density for a particular region over time, rather than absolute values of urban population density in any particular point in time.
2.4. The counterfactual analysis
Our rationale behind the counterfactual analysis is to provide an illustrative example of the scale of loss, over the 40 year period, in land savings afforded by the urbanization. Given that the world population in urban areas increased at the scale that has been observed between 1970 and 2010, the comparison between the two scenarios have meaningful policy implications. This comparison serves as a first-order estimate of how much land is consumed due to the general decline in our estimated urban population densities around the world from 1970 to 2010.
2.4.1. 1970 urban population densities
Additional population growth in each country that took place in urban areas of that country between 1970 and 2010 were instead spread out at that country's estimated urban population density as of the year 1970.
2.4.2. 2010 urban population densities
Additional population growth in each country that took place in urban areas of that country between 1970 and 2010 were spread out at that country's estimated urban population density as of the year 2010.
2.5. Conversion of natural and agricultural lands to urban
In estimating the direct impact of urban expansion on different land covers, we utilized a land classification scheme that is broad enough to capture the diversity of land-cover types in different parts of the world but also specific enough to allow us to simplify the variety of terms and definitions used in the studies in our synthesis (table S1). We grouped land-cover types reported in the identified studies and assigned them to the most relevant of the eight redefined land classes. Still, there may be inconsistencies because of the interpretation of different land covers among the studies; this is the most obvious for the 'vegetation' class which may overlap to varying extents with 'forest', 'grassland', and 'bushland' depending on the specifics of the relevant case study included in our synthesis. Likewise, 'other' includes any reported land-cover types that do not correspond to any of our seven redefined land classes. Unlike the estimates of urban land change where conversion is essentially unidirectional (i.e., from any land cover to urban), a given land cover may be converted to/from other land covers in large magnitudes. Therefore, we use a slightly different version of the annual rate of change formula to estimate the annual rate of conversion from a given land cover to urban:
Average annual rate of conversion from land cover l to urban is calculated as

where El,start is the extent of the land cover l at the beginning of time period, y, measured in years, EUl,end the amount converted to urban from land cover l by the end of the time period.
We report percent urban expansion converted from various land covers because it is a more meaningful indicator of which land covers are relatively more impacted from direct urban expansion than absolute amounts converted to urban.
3. Results and discussion
3.1. A global synthesis of urban land expansion: 1970–2010
Across all regions, urban land expansion rates are generally higher than or equal to urban population growth rates (figures 1; S1). Only in North America, Europe, and India, however, rates of urban land expansion are consistently higher than corresponding rates of urban population growth (figure 1(A)). Whereas China's rate of urban land expansion shows a decreasing trend over the past three decades, that of India tends to increase. Globally, annual urban land expansion rate remained close to 5% over the entire study period while urban population growth rates generally were much lower (figure 2). If China is excluded, the divergence between the trends of urban land expansion rates and urban population growth rates is even more clear (figure S2).

Figure 2. Global aggregated decadal trends in urban land and urban population (top panel), and urban population density (bottom panel) for (A), all case study locations in our synthesis with a population >300 000; (B), case study locations with a population >2 million (large urban centers); and (C), case study locations with a population >300 000 but <2 million (small and medium urban centers). Box plots show the median, 1st and 3rd quartiles, and lower and upper mild outlier thresholds of respective bootstrapped estimates. Number of locations used in bootstrapped estimate is shown above the respective box plot. Dashes represent the percent change in urban population. The same estimates excluding the data on cities in China are presented in the supplementary file (figure S2).
Download figure:
Standard image High-resolution imageSmall and medium urban areas (with populations between 300 000 and 2 million) have higher rates of urban land expansion across all regions except Europe compared to larger urban areas (with 2 million people or more) (figures 1, 2; see Methods). However, both small–medium and large urban centers exhibit similar trends in their rates of expansion over time. The exception is China where small and medium urban centers expand faster than their larger counterparts until the 1990s after which both groups exhibit similar rates of expansion. The difference in urban expansion rates between small–medium urban centers and large urban centers grows particularly large in Southeast Asia after 1990 (mean rate of urban land expansion being 4% versus 2%, respectively).
The urban land expansion trends identified in our synthesis work against making cities and human settlements inclusive, safe, resilient, and sustainable (SDG 11). One of the indicators of SDG target 11.3 ('By 2030, enhance inclusive and sustainable urbanization and capacity for participatory, integrated and sustainable human settlement planning and management in all countries') is the ratio of land consumption rate to population growth rate [30]. According to this indicator, designed to reflect many dimensions of land-use efficiency, North America and Europe exhibit consistently low levels of land-use efficiency. India and China, however, represent the most inefficient trends in urban land use (figure 1). Notably, India is alone among the rest in exhibiting consistently decreasing levels of urban land-use efficiency. However, the larger cities in Southeast Asia exhibit consistently higher land-use efficiencies, while the small and medium cities in this region and those in Africa also trend toward lower land-use efficiencies. These findings suggest that there may be a typology of cities based on the trends exhibited by the two underlying determinants of urban land-use efficiency. Such a typology could, thus, acknowledge the dynamic nature of land-use efficiency and allow for a more informative interpretation to measure progress towards SDG target 11.3.
3.2. Trends in urban population density vary by region and by city size
Closely related to urban land-use efficiency is urban population density, defined here as urban population per built-up area. Globally aggregated estimates for urban population density reflect a consistent decline across all decades and all city sizes from 1970 to 2010 (figure 2). There are, however, large differences in urban population density trends across the world as well as between larger and smaller urban centers (figure 3). Overall, only 4 of the 11 world regions, North America, Europe, India, and China, exhibit discernible, consistent declining trends in their urban population densities from 1970 to 2010. In Latin America, Africa, Southwest Asia, and Southeast Asia, urban population densities fluctuated from one decade to another but remained fairly unchanged.

Figure 3. Urban population density by region and by decade. Urban population density by region and by decade for (A), all case study locations in our synthesis with a population >300 000; (B), those with a population >2 million (large urban centers), and (C), those with a population >300 000 but <2 million (small and medium urban centers). Box plots show the median, 1st and 3rd quartiles, and lower and upper mild outlier thresholds of bootstrapped average urban population densities at the turn of each decade. The estimates are shown on a log scale. The same estimates on a linear scale are in the supplementary file (figure S3). Number of locations used in each turn-of-the-decade bootstrapped estimate is shown above the respective box plot. Oceania has too few data points for any trend to emerge and is hence omitted.
Download figure:
Standard image High-resolution imageEven these regionally disaggregated trends, however, mask significant differences in urban population density between smaller and larger urban centers. Declines in urban population density globally as well as by region are driven by small and medium urban centers (figures 2, 3). Across nearly all the regions, the decreases in urban population densities have been more robust among small-medium urban areas (figures 3(B), (C)). Many of these small- to medium-sized urban centers are also expanding their land area faster than their larger counterparts (figures 1(B), (C) and 2(B), (C)). In North America, Europe, India, and China, the decreases in urban population densities are much clearer in small-medium urban centers. Notably, overall urban population densities among the small-medium urban centers in North America decreased from about 3500 people km−2 to nearly 500 people km−2, the lowest across all regions. In Africa and Southeast Asia, only small-medium urban centers exhibit clear decreasing trends.
The declines in urban population densities as these urban centers extend their physical footprint increase the cost of provisioning of public services such as water and electricity. Further, already limited financial and institutional capacities remain inadequate in many developing countries leading to sharply decreasing access to service infrastructure such as paved roads, sewage and water infrastructure away from the city centers [13]. The pace of growth in cities strain municipal utilities, already having to function in increasingly fragmented and incongruent urban governance structures, leading to unequal access to several basic services across different parts of the city [31, 32]. Poorly planned or unplanned expansion of cities can also increase the socio-spatial segregation perpetuating unequal access to jobs, green space, and other amenities [26, 33].
Although the provisioning of housing, basic infrastructures, and municipal services in cities in developing countries remains inadequate compared to the magnitude of their populations, urban in-migration persists because urban areas continue to offer the possibility of a better quality of life than in rural areas [34, 35]. In this respect, the prevalence of informal settlements is closely related to a broader set of factors beyond the scale and rate of increase in urban populations [36]. In particular, regulatory frameworks that govern the delivery of planned residential land tend to place undue financial and bureaucratic burdens on low-income households discouraging them from settling in formal housing [37–39]. The proliferation of informal settlements in turn lead to the emergence of informal land and housing markets that function beyond the purview of city or national governments [13]. A major challenge is, then, to fold these informal settlements and the market mechanisms under the formal economy and formal governance [36].
These are particularly large challenges to overcome for municipal governments of small and medium urban centers that lack the financial resources to catch up with the increasing demand. An effective strategy to preempt these trends may be planning land use and infrastructure provision at the outskirts of a city in anticipation of its growth [13, 20]. Nevertheless, even if basic infrastructure is built in anticipation of urban growth, the lack of governance capacity may complicate an orderly accommodation of this growth. For example, to accommodate increasing urban population in China, many cities initiated huge housing initiatives complete with basic water, energy, and transport infrastructure [40]. However, in many of these initiatives, poor oversight and economic prerogatives of local governments that rely on large-scale land transfers as a major revenue source [9], precluded an orderly, coordinated, and realistic planning effort [41] resulting in conversion of large expanses of agricultural and natural land cover to underutilized brand new infrastructure [42–44]. Hence, integral to an anticipatory planning strategy is more effective coordination of the relevant governance structures –in the form of cross-agency collaboration within urban and peri-urban jurisdictions [26, 45] but also across the governance hierarchy, regionally and nationally [44, 45]. Such advance planning strategies in anticipation of future urban expansion may be more effective in small and medium-sized cities in developing regions where decreasing trends in urban population densities are more evident and where the competition for land may be less intense compared to larger urban centers [45].
Equally important is to study those cities where urban population density increased over the past decades to understand the factors that engendered these densification patterns. Singapore, in this respect, is a notable example where increasing densities were achieved while preserving a high quality of life [46]. It is, however, as a city-state with a strong governance system, also an exception. In most cases, haphazard densification in cities can pose significant problems increasing traffic congestion [47], reducing air quality [48], and access to green space [49, 50]. Notably, in our study, only the large urban centers in Latin America and Southeast Asia exhibit clear increasing trends in urban population density (figures 3(B), (C)). These findings appear to be corroborated, by Inostroza et al [51] and Montejano et al [52] for Latin America and by Schneider, Mertes [29] for Southeast Asia. The reasons for densification in larger Latin American cities largely stem from historical factors that favored concentration of labor in the largest cities [51, 52]. The increasing population densities in the large cities of Southeast Asia, however, are likely an indirect result of the national agricultural policies in this region rather than any intentional effort on the part of the city or regional governments to densify their cities [29, 53].
3.3. Has urbanization saved land? A counterfactual analysis
Our counterfactual analysis highlights the land cost of decreasing urban population densities in much of the world from 1970 to 2010. We estimate that, assuming urban land expansion took place at each region's respective mean 2010 urban population density, 325 000 km2 of additional urban land would be needed to accommodate the increase in global urban population from 1970 to 2010 (see Methods). This is nearly 60% more land than would be needed at each region's respective 1970 urban population density. Thus, globally, the decreases in urban population densities have caused the conversion of an estimated nearly 125 000 km2 land—nearly one-third of the size of Japan—to urban land uses that could have otherwise remained in cultivation or as natural vegetation. The land requirements differ the most for China between the two urban population density assumptions. Estimated urban expansion in China at its mean 2010 urban population density amounts for more than twice as much urban land (about 45 000 km2) than if the country's urban population density had remained the same since 1970 (figure 4). Likewise, in India and Nigeria, the next two most rapidly urbanizing countries but with much of their populations still dependent on agriculture, 85% and 30% more land, respectively, is converted to urban due to declining urban population densities.

Figure 4. Additional land that would have been needed to accommodate urban population growth from 1970 to 2010 at Urban Population density at 2010 versus at Urban Population density at 1970 by Country. The horizontal and vertical lines correspond to the first and third quartiles. The region bordered with the small gray square is expanded at the upper right. The same plot by region is shown in the supplementary document (figure S4).
Download figure:
Standard image High-resolution image3.4. What types of land covers are lost to urban expansion?
The types and amounts of different land covers that were converted to urban were specified for nearly one third of the reported amount of urban land expansion (over 64 000 km2 from 1970 to 2010) (figure 5). The majority of this additional urban land (60%, over 39 000 km2) was formerly agricultural land. In terms of percent of total urban land expansion from 1970 to 2010, the largest conversions of agricultural lands to urban land uses took place in Europe, China, and Southeast Asia. In each of these three regions, over 65% of all urban expansion took place on agricultural lands. In East Asia, more than half of all urban expansion occurred on agricultural lands. Natural land covers constituted one third of the total reported land that was converted to urban. The largest proportional losses of natural land cover were reported for North America and Oceania, which are followed by Southwest Asia, Latin America, and India. Globally, forest cover had the largest loss to urban expansion among all other natural land covers (about 13%). The largest proportional forest conversion occurred in North America and East Asia (particularly in Japan and Taiwan). In North America, more than half of all urban expansion occurred on forested land. Documented large scale forest loss in North America due to urban expansion is representative more of the urban expansion patterns in the eastern half of the US where a large majority of the case studies in our synthesis come from (figure S1). The largest proportional conversion from bare soil, however, were in India; most case studies there were from urban areas in arid or semi-arid lands.

Figure 5. Percent of total urban land expansion from other land covers (1970–2010).
Download figure:
Standard image High-resolution image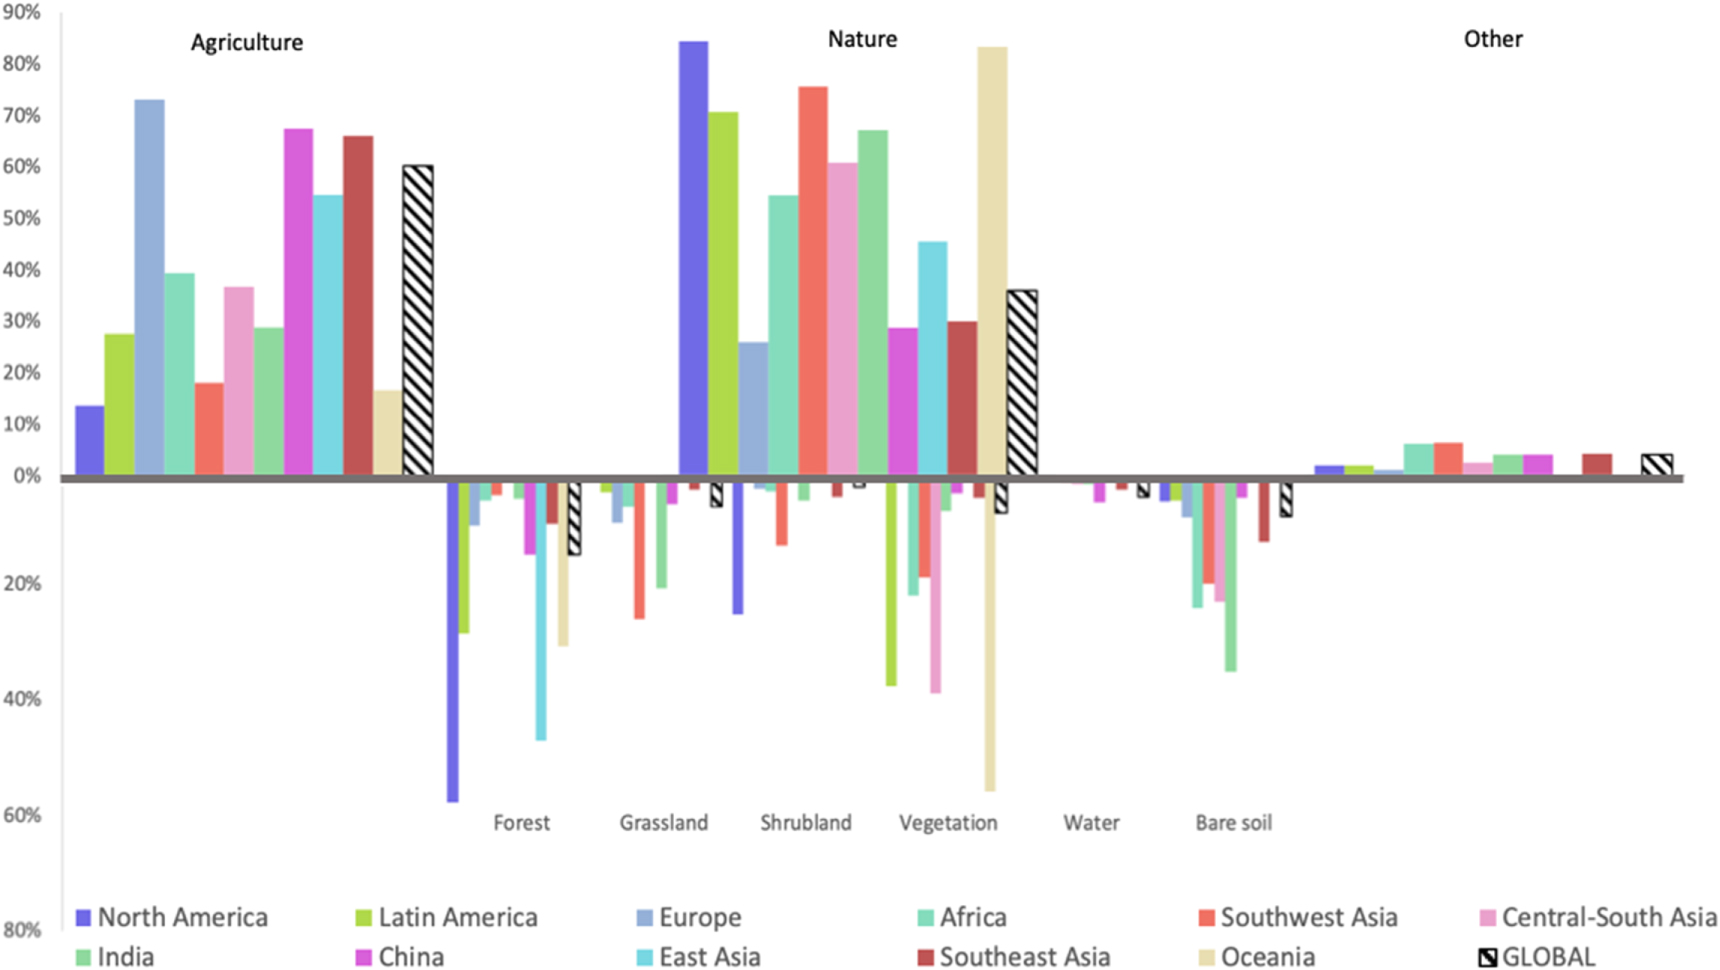
Our estimates on the conversion of different land covers to urban land and our counterfactual analysis together imply that, particularly in China, India, and North America, large areas of croplands and forests could have been spared had urban population densities remained at their 1970 levels or at least did not decline as much as they did since then (figure 5). The loss of agricultural land to urban may appear to be negligible given the total amount of arable land around the world, about 15 million km2 [54]; however, most land lost to urban expansion tends to be of highest quality [55, 56], any loss of which is of critical importance for countries with large populations to feed [57] and little room to improve yields [58] or to expand arable land cover [4, 5].
According to a recent study, the total cropland area within ten km of urban areas constitutes nearly a quarter of the global cropland area [59]. These peri-urban croplands can play important roles for food security in many countries, especially in Asia and Africa. Indeed, sprawling urban land expansion would most matter in countries like China, India, and Nigeria with large projected increases in their urban populations [28] as well as in urban land cover [60, 61]. Further, if current trends continue, 80% of the forecasted global loss of croplands to urban land expansion will take place in Asia and Africa, where the impacts on food security and rural livelihoods will be felt most acutely [4].
The urban land expansion trends identified in our synthesis have important implications for land use and livelihoods. The decline in urban population density in China throughout our study period, accounts for 55% of urban land expansion from 1970 to 2010 (figure 5), even though cities in China are overall still twice and four times as compact as those in Europe and North America, respectively (figure 3). This suggests that losses in farmland to urban land expansion may continue apace if urban population densities in the country continue to approach levels seen in more developed regions. The loss of farmlands to urban expansion in China, a country concerned with food self-sufficiency [62, 63], is driven by the overreliance of city governments on revenue from leasing state-owned lands [64]. Our findings reflect this preferential loss of agricultural lands to urban expansion in the country [65, 66]. For countries such as India and Nigeria, additional urban land expansion due to the decline in their urban population densities suggests similarly undue impacts on peri-urban agriculture in the absence of the concentrating influence of urbanization [4, 67]. With much of their populations dependent on agriculture paired with significant projected urban growth over the next few decades, effective management of urban expansion in these countries especially matters for the overall welfare of their residents and national food security concerns [24, 68]. In this respect, the large and growing inefficiency in urban land-use in India is particularly concerning (figure 1). Compared to China, India has been slower in responding to its urban transformation through investments in urban infrastructure and associated changes in its land use policy and planning practices [69]. Like China, however, India too faces severe limitations to compensate the loss of agricultural lands near expanding urban centers as nearly half of the country's land resources are already degraded [70]. Yet, housing demand from growing urban populations coupled with restrictive building height regulations enacted to limit population densities in the cities [71], facilitated large-scale but low density development. Notwithstanding extensive agricultural land loss caused by such developments, inadequate provisions to resettle the affected farmers contribute to the deterioration of livelihood of the world's largest rural population [28].
The growth of urban centers sets forth a complex set of interactions with their peri-urban and rural hinterlands. If one consequence of these interactions is the loss of croplands in these areas, then the other is transformation of livelihoods of people in both rural and urban areas [72]. These interactions between urban and peri-urban areas tend to be stronger in the case of small and medium cities [73]. For example, the small and medium urban centers tend to rely on agricultural produce from their peri-urban areas more than their larger counterparts [72, 74]. Also, it is common in peri-urban regions in developing countries for people to commute to work between the city and their villages or towns nearby [75, 76]. More often than not, inequalities in access to services as well as employment opportunities facilitate these interactions [75, 76] bringing out in sharp contrast the linkage between urban sustainability and rural livelihoods—especially in the context of growing small and medium urban centers. Thus, in a sound urbanization strategy, the role of peri-urban agriculture would also be acknowledged in improving the links between urban, peri-urban, and rural areas (SDG target 11a) while contributing to food security (SDG 2) [67, 68, 77].
Our synthesis shows that physical expansion of large urban agglomerations is relatively well studied in the literature; however, there are proportionally fewer studies on urban agglomerations with small to medium population sizes (i.e. less than 2 million in population) (figure S5) even though it is these urban centers that are growing the fastest. Already, nearly 60% of the world's urban population live in small-sized urban areas with fewer than 1 million people that also see the fastest growth in their populations [28], especially in Africa (figure 1). In Sub-Saharan Africa, nearly 200 million people live in such urban areas, more than half the total urban population in the region [72]. Yet, our synthesis also shows that physical expansion of these smaller but rapidly growing urban centers is relatively poorly studied in the literature (figure S5), lagging behind their larger, better connected counterparts [33]. In particular, cities in large swaths of Sub-Saharan Africa are completely absent from our synthesis (figure S1). This lack of coverage of urban-land expansion patterns in some of the most rapidly urbanizing parts of the world is significant and mirrors a bias that is present in the global production of urban data [23, 78].
4. Conclusion
This global synthesis of published results reveals a complicated story of urban land expansion. It goes beyond earlier studies of specific regions and samples of cities that show that the expansion of urban land area has outpaced the growth of urban populations [20, 79, 80]. Our synthesis offers a more varied dynamic, over a four decade period, in population density of those urban centers whose population reached 300 000 people or more as of 2010. While global trends suggest urban population densities have been decreasing over the past decades, the pace and even the direction of change in the densities show notable differences across the world regions. Urban population densities have consistently declined only in India, China, North America, and Europe, and more so among small-medium urban areas (with <2 million people) across all regions. These differences highlight the need to distinguish the nature of urban land expansion among cities of different sizes and to seek locally adaptive strategies to manage their growth accordingly [33]. Overall, decreases in urban population densities led to an estimated 125 000 km2 more land to be converted to urban from 1970 to 2000. Considering that competition for land to meet the various needs of humans will also continue to intensify [81], we assert that an informed urbanization strategy that focuses on efficient, equitable, and healthy high-density urban form can be successful in improving living conditions in these growing urban landscapes of the future and in efficient management of increasingly limited land resources.
Acknowledgments
This research was supported by NASA Land Cover/Land Use Change (LCLUC) grant NNX15AD43G. We thank Sydney Weyand, Cesar Castillo, Abir Chaudhuri, and Xunwei Xu for their help in data collection. The open access publishing fees for this article have been covered by the Texas A&M University Open Access to Knowledge Fund (OAKFund), supported by the University Libraries and the Office of the Vice President for Research.
Data availability statement
The data that support the findings of this study are available from the corresponding author upon reasonable request.