

Abstract
Alaska's Yukon-Kuskokwim Delta (YKD) is one of the warmest parts of the Arctic tundra biome and tundra fires are common in its upland areas. Here, we combine field measurements, Landsat observations, and quantitative cover maps for tundra plant functional types (PFTs) to characterize multi-decadal succession and landscape change after fire in lichen-dominated upland tundra of the YKD, where extensive wildfires occurred in 1971–1972, 1985, 2006–2007, and 2015. Unburned tundra was characterized by abundant lichens, and low lichen cover was consistently associated with historical fire. While we observed some successional patterns that were consistent with earlier work in Alaskan tussock tundra, other patterns were not. In the landscape we studied, a large proportion of pre-fire moss cover and surface peat tended to survive fire, which favors survival of existing vascular plants and limits opportunities for seed recruitment. Although shrub cover was much higher in 1985 and 1971–1972 burns than in unburned tundra, tall shrubs (>0.5 m height) were rare and the PFT maps indicate high landscape-scale variability in the degree and persistence of shrub increase after fire. Fire has induced persistent changes in species composition and structure of upland tundra on the YKD, but the lichen-dominated fuels and thick surface peat appear to have limited the potential for severe fire and accompanying edaphic changes. Soil thaw depths were about 10 cm deeper in 2006–2007 burns than in unburned tundra, but were similar to unburned tundra in 1985 and 1971–1972 burns. Historically, repeat fire has been rare on the YKD, and the functional diversity of vegetation has recovered within several decades post-fire. Our findings provide a basis for predicting and monitoring post-fire tundra succession on the YKD and elsewhere.
Export citation and abstract BibTeX RIS
1. Introduction
The Yukon-Kuskokwim Delta (YKD) is one of the most biologically productive areas of the Arctic tundra biome and supports one of the largest indigenous human populations in the circumpolar Arctic (Spencer et al 1951, Rearden and Fienup-Riordan 2014). Ice-rich permafrost is widespread across the YKD and strongly influences terrestrial and aquatic habitats through its effects on topography, vegetation, and hydrology (Jorgenson and Ely 2001, Whitley et al 2018). Ground temperatures are near the freezing point, however, and recent projections indicate that the YKD is poised for widespread loss of permafrost later this century (Terenzi et al 2014, Pastick et al 2015). Landscape disturbances have the potential to further accelerate changes to habitat conditions, with significant implications for wildlife and subsistence resources.
The YKD is best known for its low-lying, coastal tundra habitats, but upland tundra is extensive in its inland areas. YKD uplands have a rich history of tundra fire (Sae-Lim et al 2019), and the summer of 2015 yielded an exceptional number of wildfires that affected over 420 km2 (figure 1). Tundra fires in Alaskan tussock tundra have motivated numerous studies of vegetation recovery and permafrost dynamics on the North Slope (Wein and Bliss 1973, Fetcher et al 1984, Bret-Harte et al 2013), Noatak valley (Racine et al 1987, He et al 2019), and the Seward Peninsula (Racine 1981, Racine et al 2004). However, wildfire fuels on the YKD are strongly dominated by lichens rather than litter-rich tussocks, and YKD uplands are underlain by relatively warm permafrost. Wildfire can trigger a range of permafrost-mediated landscape disturbances that intensify for years after fire by removing tundra vegetation and insulating peat, decreasing surface albedo, and altering soil hydrology (Rocha et al 2012, Jones et al 2015, Michaelides et al 2019). The overall ecosystem impacts of tundra wildfire are poorly understood, however, despite the strong linkages among environmental change, ecosystem services, and human well-being on the YKD.
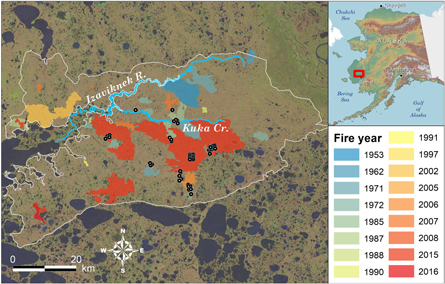
Figure 1. Map of Izaviknek-Kingaglia uplands study area, field plot locations, and perimeters of known tundra fires (1953–2016), Yukon-Kuskokwim Delta, Alaska. Fire perimeters adapted from AICC (2019).
Download figure:
Standard image High-resolution imageHere, we combine detailed field measurements, quantitative vegetation cover maps, and long-term satellite records to characterize environmental dynamics and successional patterns following tundra wildfire in lichen-rich upland landscapes of the YKD. Notably, this region's fire history spans many decades, allowing for a longer temporal assessment than recent research that has mainly focused on the short-term effects of recent fire in colder, tussock-dominated ecosystems. We addressed three research questions:
- 1.How do vegetation species-composition, structure, and diversity change in the decades following wildfire in lichen-rich tundra?
- 2.How do soil properties and thaw depth compare among fire ages and with unburned tundra?
- 3.What are the biophysical factors that most influence landscape vulnerability and resilience to tundra fire on the YKD?
2. Methods
2.1. Study area
Most fire activity on the YKD has occurred in the Izaviknek and Kingaglia uplands (IKU), a 3870 km2 region of eolian surficial deposits that supports extensive mesic vegetation (Péwé 1975, Wolfe et al 2009, Jorgenson and Roth 2010; figure 1). The IKU composes 5.0% of the YKD ecoregion (Nowacki et al 2003); terrain consists of gentle, rolling hills that range 10–65 m ASL. Unburned vegetation is dominated by lichens, shrubs (mainly <0.5 m height), and sedges corresponding to bioclimate subzone E of the Circumpolar Arctic Vegetation Map (CAVM Team 2003, Raynolds et al 2019). The nearest available long-term instrumental record, approximately 75 km southeast of the study area at Bethel Airport, indicates a mean annual air temperature of −0.7 °C, mean summer (June–August) temperature of 12.2 °C, and mean annual precipitation of 378 mm (1981–2010 base period; NCDC 2019). The IKU is underlain by discontinuous permafrost (Jorgenson et al 2008); permafrost is widespread in upland tundra but is absent from drainages. Approximately 20% (789 km2) of the IKU has experienced fire since 1953, with about half of all fire occurring in 2015 (AICC 2019; figure 2).

Figure 2. Annual summary of burned area in the Izaviknek-Kingaglia Uplands during 1953–2016 (left y-axis; adapted from AICC 2019), and mean May–July temperature observed at Bethel Airport about 70 km to the southeast (right y-axis).
Download figure:
Standard image High-resolution image2.2. Field studies
We established field plots spanning gradients of fire history during 20–31 July 2017 (24 plots) and 8–16 July 2018 (18 plots) (figure 3, table 1). Field data were collected using a vegetation point-intercept (VPI) sampling approach (Karl et al 2017). We supplemented our dataset with 16 VPI plots sampled during 15 June–17 August 2016 (Ludwig et al 2018). The three field campaigns used broadly similar methods, with minor differences to plot layout prompted by the need to address multiple research and land management objectives concurrently in a remote study area.
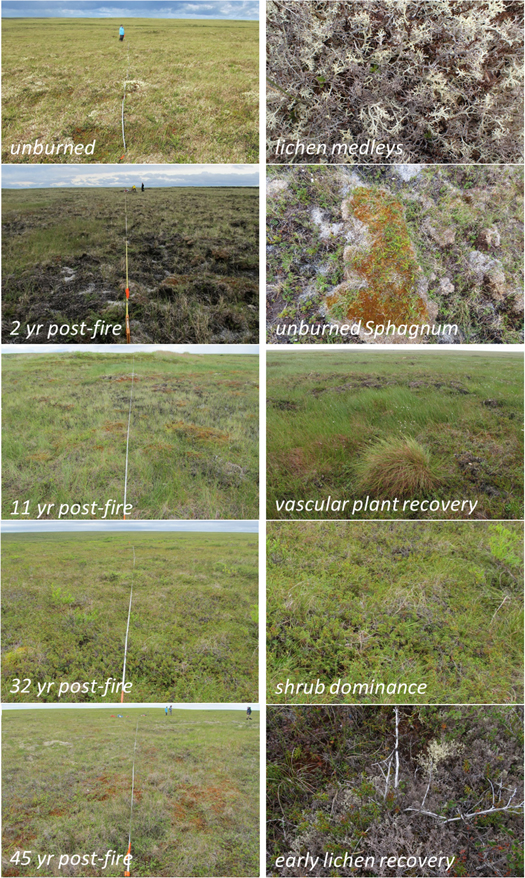
Figure 3. Field photos of transects (left) and typical vegetation (right) taken along a 45 year fire history gradient, Yukon-Kuskokwim Delta, Alaska.
Download figure:
Standard image High-resolution imageTable 1. Summary of field plots and fire history classes sampled to develop the plot ordination, vegetation cover summaries, and quantitative-cover maps for plant functional types.
| Number of plots | |||
|---|---|---|---|
| Fire history (yr since last fire) | Ordination | Cover summaries | PFT modeling |
| 1 | 0 | 7 | 6 |
| 2 | 5 | 5 | 7 |
| 3 | 16 | 18 | 17 |
| 10–11 | 5 | 5 | 5 |
| 32 | 4 | 4 | 4 |
| 45–46 | 4 | 4 | 4 |
| Unburned | 4 | 13 | 13 |
| Total | 38 | 56 | 56 |
For plot allocation, we used a systematic grid system adapted from the Alaska Landbird Monitoring Survey (Handel and Cady 2004). We assigned fire history categories (years since last fire, or no known fire) to ALMS points within 90 km of the Bethel, AK airport using historical fire perimeters (AICC 2019). Following review of late 1980s Landsat and recent high-resolution imagery, we also mapped and included for plot allocation several 1985 fire perimeters that were represented only as point locations in the historical database. We selected points for field visits using a stratified-random approach, with priority given to (1) points within NASA's Arctic Boreal Vulnerability Experiment remote-sensing flightlines, and (2) points in 2015 burn scars (i.e. sampled 2–3 years post-fire) in order to support assessment of burn severity for related projects.
At most plots, we sampled vegetation along three 30 m linear transects radiating at 120° intervals from the plot center, according to the US Bureau of Land Management's Assessment, Inventory, and Monitoring Program protocol (AIM; Toevs et al 2011). At locations sampled 2–3 years post-fire, most plots instead consisted of four parallel 20 m transects oriented from east to west and spaced 5–10 m apart, following guidance from the Fire Effects Monitoring and Inventory System protocol used to assess the severity of recent fire (Lutes et al 2006). The 16 supplemental plots were sampled using either the AIM layout (6 plots), or along a single randomly oriented 100 m transect (10 plots). At all transects, vegetation was sampled at 0.5 m or 1 m intervals by recording all species 'hit' by the beam from a vertically mounted laser pointer. At most plots, we recorded all vascular plant hits if multiple layers were present. At the supplemental plots, only one hit per point was recorded for each species (6 plots) or only the first hit (i.e. top of canopy) was recorded (10 plots). At all plots measured, only single hits per point were recorded for bryophytes and lichens. We also measured soil thaw depth (42 plots) and maximum shrub height (35 plots) at 5 m intervals along transects; we omitted these measurements at a few plots due to time constraints. Finally, we excavated a soil pit to 40 cm depth near the center of each plot and recorded the thickness of the surface organic layer (no measurement at supplemental plots).
2.3. Field data analysis
We calculated three species cover metrics from the VPI data, for all plots where the field sampling methods allowed:
- 1.Top-hit cover (THC) is the percentage of points where a species was the first hit. THC represents the top-of-canopy and could be calculated for all 56 plots; the THC of all species sums to 100% per plot. We also calculated THC for litter (dead vegetation and detached leaves), water, and bare ground.
- 2.Any-hit cover (AHC) is the percentage of points where a species occurred. The total AHC for a plot can exceed 100% (i.e. in multi-layered vegetation); we calculated AHC for live vegetation for 46 plots.
- 3.Multi-hit cover (MHC) is the total number of hits for a species, divided by the number of sample points. MHC is a metric of canopy density and can include multiple hits of a species at a single point. MHC thus can exceed 100%; we calculated MHC for live vegetation at 38 plots.
We also calculated these metrics for nine plant functional types (PFTs): deciduous shrub, evergreen shrub, graminoid, forb, Sphagnum, other acrocarpous moss, pleurocarpous moss, liverwort, and lichen. We aggregated these PFTs into broader classes (e.g. all bryophytes) for some applications. Acrocarpous (hereafter, unbranched) mosses are primarily early-successional pioneers, while pleurocarpous (branched) mosses tend to occupy undisturbed sites. We did not distinguish shrub height classes because shrubs rarely exceeded 50 cm height.
Using the AHC summaries, we developed a plot ordination using nonmetric multidimensional scaling (NMDS) for 38 plots with sufficiently detailed species data for nonvascular plants. We aggregated several nonvascular taxa to genus (e.g. Sphagnum, Cladonia) or species-complex (Cladina arbuscula/mitis) because we could not differentiate all species in the field. Taxa that occurred at only one plot were omitted. We used the Bray–Curtis dissimilarity index as the distance measure and restricted the number of ordination dimensions to the minimum necessary to achieve stress values <0.2. We then tested for differences among fire treatments by overlaying 95th percentile confidence-interval ellipses around treatment centroids within the ordination space. We produced a secondary matrix containing plot-level means of soil thaw depth, surface organic layer thickness, and MHC for each PFT and used the envfit function (Oksanen et al 2016) in R (R Core Team 2018) to fit bi-plot vectors for each variable within the ordination. We used MHC because it is sensitive to both the composition and structure of the canopy.
We also calculated the converse Simpson's diversity index, a mathematical measure that characterizes species diversity in a community by the number and abundance of species present (Simpson 1949, Smith and Wilson 1996, Goswami et al 2017). We calculated the Simpson's index using AHC values recorded for each taxon at each plot. Plots sampled 2–3, 10–11, and 45–46 years post-fire were aggregated in the ordination and diversity analyses. We used the AHC metric for the ordination and Simpson's index because it includes all taxa present, but does not overly weight multi-layered PFTs (e.g. shrubs).
We tested for significant differences in the AHC of PFTs, Simpson's diversity index, and soil variables among fire history classes using one-way analysis of variance (ANOVA). Where ANOVA revealed significant differences (p < 0.05), we performed adjusted post hoc multiple comparisons using Tukey's honestly significant difference tests to identify significant differences (adjusted p < 0.05) by class.
2.4. Mapping of PFTs
We used the VPI data and 60 spectral predictors derived from Landsat data to develop continuous-cover maps for four simplified tundra PFTs at 30 m resolution: shrub, herbaceous, bryophyte, and lichen. We performed modeling in Google Earth Engine (Gorelick et al 2017) using a random forest data-mining approach (Breiman 2001), following the framework used by Macander et al (2017) in northern Alaska.
Spectral predictors consisted of percentile-based surface reflectance composites for 6 bands and 6 indices (e.g. Normalized Difference Vegetation Index) derived from Tier 1 Landsat 7 Enhanced Thematic Mapper + and Landsat 8 Operational Land Imager data from June to September, 2016–2018 (supplemental table S1 is available online at stacks.iop.org/ERL/15/025003/mmedia). We developed surface reflectance composites on a per-pixel basis for five percentiles: 10%, 25%, 50% (median), 75%, and 90%. Although seasonal timing of imagery was not explicitly considered, the percentile-based approach effectively captures spectral conditions during different phenological periods while minimizing spatial artifacts. We masked pixels with a water occurrence of ≥50% in the Joint Research Commission global water product (Pekel et al 2016).
We reserved 20% of the training data (12 plots) as an independent validation dataset for each PFT model, and ran models separately for the validation dataset and the remaining training data. Finally, we ran models for the full study area and evaluated model performance separately using independent predictions for the validation dataset and 'out-of-bag' predictions from the training data. The predictions were made in Google Earth Engine and error metrics were computed in R.
3. Results
3.1. Vegetation
Two NMDS ordination dimensions were sufficient to meet the stress threshold (stress score = 0.184); axis 1 represents a species composition gradient from early to late succession, and axis 2 captures a structural gradient from nonvascular- to shrub-dominated vegetation (figure 4). Field plots formed three nonoverlapping clusters—unburned, 2–3 years post-fire (hereafter, recent burns), and ≥10 years post-fire (hereafter, historical burns)—indicating strong patterns of correspondence between species cover and fire history. Plots sampled 2–3 and 45–46 years post-fire were least and most similar to unburned plots, respectively. Unburned plots were very similar to each other, while burned plots displayed much more variability. The Simpson's diversity index was lowest in recent burns and increased during post-fire succession (figure 5).
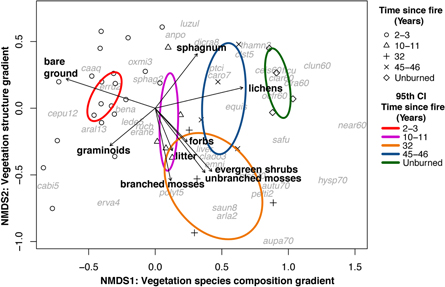
Figure 4. Nonmetric multidimensional scaling (NMDS) ordination of 38 field plots. The optimal location of taxa in the ordination space is indicated by gray text; species codes follow USDA and NRCS (2019).
Download figure:
Standard image High-resolution image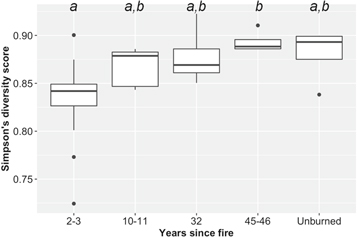
Figure 5. Box plots of Simpson's functional diversity across fire history gradients. Higher values represent greater species diversity (richness and evenness). Boxes represent 1st and 3rd quartiles, the horizontal line through each box is the median, whiskers extend to ±1.5 times the interquartile range, and dots indicate outliers.
Download figure:
Standard image High-resolution imageVascular plant diversity was generally low at all plots, and many species were present with high frequency regardless of fire history (table 2, supplementary table S2). For example, the deciduous shrubs Betula nana and Vaccinium uliginosum, and the evergreen shrubs Empetrum nigrum, Rhododendron tomentosum, and V. vitis-idaea accounted for most of the shrub cover regardless of fire history. Graminoid cover consisted almost entirely of sedges and tended to be highest in historical burns; grasses were rare except in historical burns. The tussock-forming sedge Eriophorum vaginatum was present at most plots, but it was never abundant. Forbs were uncommon regardless of fire history. Nonvascular species composition, however, varied strongly among plots with different fire histories.
Table 2. Summary of median any-hit cover (%) and standard deviation (in parentheses) for plant functional types (boldface) and dominant taxa in unburned and burned tundra according to years since last fire. Up to five of the most abundant taxa are shown for each plant functional type; see supplementary table S2 for all taxa.
| Any-hit cover (%) | ||||||
|---|---|---|---|---|---|---|
| PFT/Scientific_name | Unburned | 2 years | 3 years | 10–11 years | 32 years | 45–46 years |
| Deciduous shrub | 12.2 (2.8) | 8.8 (4.1) | 15.9 (5.6) | 18.9 (6.0) | 21.1 (2.6) | 14.4 (3.8) |
| Arctous alpina | 1.7 (1.4 | 0.6 (0.5) | 0 (1.6) | 0 (0.6) | 0 (1.1) | 0 (1.7) |
| Betula nana | 3.3 (1.4 | 2.2 (1.3) | 2.4 (2.6) | 5.6 (5.3) | 5.0 (1.9) | 4.4 (1.8) |
| Vaccinium uliginosum | 7.2 (1.1) | 5.6 (2.2) | 12.5 (4.5) | 8.9 (4.1) | 13.9 (1.4) | 9.4 (4.3) |
| Evergreen shrub | 25.0 (7.9) | 8.8 (6.0) | 14.5 (6.5) | 25.6 (2.9) | 46.1 (11.2) | 32.8 (13.4) |
| Andromeda polifolia | 0 (0.6) | 0 (0.5) | 1.1 (1.8) | 0 (0.6) | 1.1 (1.4) | |
| Empetrum nigrum | 5.0 (3.2) | 0 (2.9) | 0.3 (1.5) | 2.2 (1.3) | 22.8 (10.2) | 3.9 (2.7) |
| Oxycoccus microcarpus | 1.1 (3.2) | 0.7 (0.8) | 1.1 (2.8) | 1.1 (1.9) | ||
| Rhododendron tomentosum | 12.8 (5.5) | 3.8 (2.0) | 11.5 (5.8) | 18.9 (3.4) | 22.2 (3.8) | 15.0 (3.3) |
| Vaccinium vitis-idaea | 3.3 (2.9) | 0 (0.6) | 0.7 (1.2) | 2.2 (2.1) | 1.7 (1.9) | 8.9 (10.7) |
| Graminoid | 4.4 (1.3) | 6.9 (3.0) | 12.5 (5.0) | 11.1 (4.8) | 14.4 (8.1) | 8.9 (4.1) |
| Carex aquatilis | 1.1 (0.9) | 0 (1.9) | 5.4 (2.6) | 0 (1.0) | 1.1 (2.1) | 0 (1.7) |
| Carex bigelowii | 0.6 (2.1) | 0 (1.7) | 0.7 (5.3) | 0 (0.6) | ||
| Eriophorum angustifolium | 0 (1.5) | 0 (1.0) | 0.6 (5.9) | 0.6 (3.2) | ||
| Eriophorum russeolum | 0 (0.6) | 2.2 (1.0) | 3.0 (1.9) | 4.4 (3.4) | 1.7 (1.9) | 2.2 (2.5) |
| Eriophorum vaginatum | 0 (1.6) | 0 (0.5) | 2.8 (1.9) | 0 (1.1) | ||
| Forb | 1.1 (3.9) | 0 (0.6) | 1.0 (1.6) | 2.2 (1.8) | 3.3 (2.5) | 1.1 (1.3) |
| Equisetum spp. | 0 (0.5) | 0 (0.6) | ||||
| Polygonum viviparum | 0 (2.0) | |||||
| Rubus chamaemorus | 1.1 (3.9) | 0 (0.6) | 0.7 (1.6) | 1.1 (1.1) | 2.8 (1.4) | 1.1 (1.3) |
| Bryophyte | 17.2 (6.7) | 12.5 (8.4) | 22.3 (7.6) | 38.9 (3.4) | 66.1 (5.8) | 61.1 (9.5) |
| Ceratodon purpureus | 1.3 (1.4) | 4.7 (4.9) | ||||
| Pleurozium schreberi | 1.1 (1.3) | 0 (0.2) | 1.1 (0.9) | 6.7 (4.5) | 6.1 (4.2) | |
| Polytrichum juniperinum | 0 (0.6) | 15.6 (6.2) | 34.4 (14.4) | 9.4 (6.0) | ||
| Sanionia uncinata | 0 (0.2) | 0 (1.0) | 3.3 (2.3) | 1.1 (0.9) | ||
| Sphagnum spp. | 12.8 (7.6) | 10(6.8) | 15.5 (7.8) | 13.3 (10.8) | 14.4 (6.6) | 34.4 (1.7) |
| Lichen | 81.1 (4.3) | 1.3 (3.1) | 1.4 (1.2) | 13.3 (5.2) | 15.0 (9.6) | 29.4 (7.3) |
| Cladina arbuscula/mitis | 13.9 (5.2) | 0 (1.0) | 1.1 (1.9) | 2.2 (1.4) | 6.1 (3.2) | |
| Cladina rangiferina | 26.1 (12.1) | 1.1 (0.9) | 0 (0.2) | 0 (0.6) | 1.1 (1.3) | 7.2 (2.3) |
| Cladina stygia | 16.1 (5.5) | 0.6 (1.5) | 0 (0.8) | 0 (0.5) | 2.2 (1.8) | |
| Cladonia spp. | 0 (0.2) | 8.9 (4.2) | 5.0 (3.9) | 2.8 (2.7) | ||
| Flavocetraria cucullata | 10.6 (4.0) | 0 (0.4) | 0 (0.6) | 1.7 (2.7) | 3.3 (3.3) | |
In unburned tundra, fruticose lichens (e.g. Cladina rangiferina, Flavocetraria cucullata) formed extensive, thick, mixed-species mats (median AHC 83.3%) that formed the canopy at nearly half of sample points (figure 6). Vascular cover was dominated by evergreen shrubs. Bryophyte cover in unburned tundra was dominated by Sphagnum; Sphagnum remained common throughout post-fire succession and reached its highest cover values in the oldest burns.

Figure 6. Summaries of (A) mean top-hit cover, (B) multi-hit cover, and (C) any-hit cover for plant functional types in burned and unburned tundra. In any-hit cover summaries, letters indicate significant differences determined using Tukey's HSD tests (p < 0.05). In panel (C), boxes represent the 1st and 3rd quartiles, the horizontal line through each box is the median, whiskers extend to ±1.5 times the interquartile range, and dots indicate outliers.
Download figure:
Standard image High-resolution imageLive vegetation remained discontinuous for several years after 2015 fires; median THC of live vegetation 1, 2, and 3 years post-fire was 24.7%, 28.8%, and 51.4%, respectively. Moribund tufts of Cladina were common in recently burned areas; their bleached color suggested the algal photobiont had been killed by heat. Two yr post-fire, the median AHC of bryophytes was about half that recorded in unburned tundra and was mostly composed of Sphagnum. The unbranched mosses Polytrichum juniperinum and Ceratodon purpureus appeared 2–3 years post-fire; Ceratodon was restricted to early successional sites, but Polytrichum remained common throughout post-fire succession. By 3 years post-fire, lichen cover remained very low but deciduous shrubs, evergreen shrubs, and bryophytes became much more abundant.
In plots sampled 10–11 years post-fire, the combined abundance of all PFTs (median MHC 116.7%) was much higher than in recent burns and was similar to unburned tundra. The dominant PFTs were bryophytes, evergreen shrubs, and deciduous shrubs. Most nonvascular cover consisted of unbranched mosses and Sphagnum.
Plots sampled 32 years post-fire were characterized by a multi-layered plant canopy, and the combined abundance of all PFTs (median MHC 183.9%) was the highest recorded for any class. Evergreen shrubs were the most abundant vascular PFT, followed by deciduous shrubs and graminoids. Nonvascular vegetation was dominated by bryophytes, primarily unbranched mosses. Cover of branched mosses was generally low except in burns ≥32 years old. Lichen abundance was similar to that observed 10–11 years post-fire.
In plots sampled 45–46 years after fire, a multi-layered canopy was present at most points, but median MHC (151.6%) was somewhat lower than in 32 years old burns. The most abundant vascular PFTs were evergreen and deciduous shrubs. Nonvascular vegetation was dominated by bryophytes, primarily Sphagnum. Lichen cover was much higher (median AHC 29.4%) than in younger burns.
Maximum shrub height showed little variation across the fire history gradient. The maximum shrub height recorded was only 48 cm, and plot-level mean maximum heights ranged 6.8–19.7 cm (figure 7). Maximum shrub heights tended to be highest in 10–11 years old and 32 years old burns.
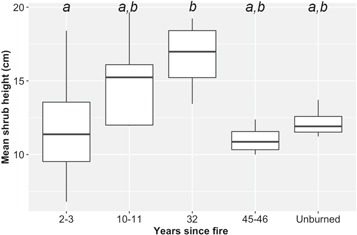
Figure 7. Box plots for maximum shrub height measured post-fire and in unburned tundra. Letters indicate significant differences among classes determined using Tukey's HSD tests (p < 0.05). Boxes represent the 1st and 3rd quartiles, the horizontal line through each box is the median, and whiskers extend to ±1.5 times the interquartile range.
Download figure:
Standard image High-resolution image3.2. Soil properties and thaw depth
Across all plots, thaw depth ranged 40.8–62.1 cm (figure 8). Thaw depth was shallowest in unburned tundra (median 41.6 cm), and deepest 10–11 years post-fire (52.3 cm). Thaw depth was highly variable in plots measured 2–3 years post-fire, and least variable in unburned plots.

Figure 8. Box plots for thaw depth (left) and soil surface organic thickness(right) for different-aged burns and unburned tundra. Letters indicate significant differences among classes determined using Tukey's HSD tests (p <0.05); no significant differences were found for surface organic thickness. Boxes represent the 1st and 3rd quartiles, the horizontal line through each box is the median, whiskers extend to ±1.5 times the interquartile range, and dots indicate outliers.
Download figure:
Standard image High-resolution imageSurface organic thickness ranged 7–45 cm and was most variable in recent burns (figure 8). There were, however, no clear patterns of correspondence between organic thickness and burn history. We observed exposed mineral soil only at a handful of convex microsites that were severely burned in 2015.
3.3. Mapping of PFTs
Based on the independent validation dataset and 'out-of-bag' error metrics, model performance was best for lichens, followed by shrubs and bryophytes (figure 9). Model performance was poor for herbaceous, likely because live herbaceous cover was generally low and was similar among all fire history classes. Fire history was not an input in the modeling, but modeled PFT abundance displayed relationships with fire history similar to those seen in the field data. For example, shrub cover was highest in 1985 (32 years old) burns and declined somewhat in older burns.
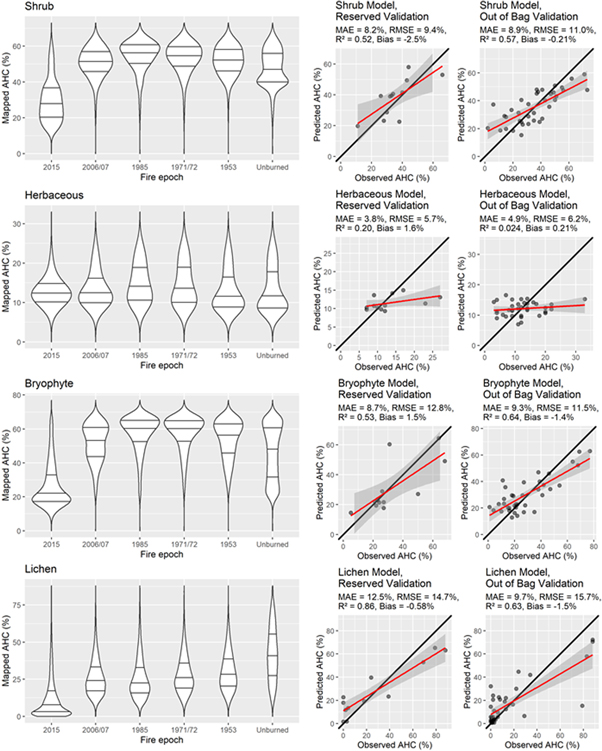
Figure 9. Violin plots of modeled any-hit cover of plant functional types in burned and unburned tundra (left), and performance metrics from independent validation data (center) and out-of-bag error estimates (right). In violin plots, widths are proportional to the spatial extent of cover values, and lines indicate 1st, 2nd (median), and 3rd quartiles.
Download figure:
Standard image High-resolution imageThe mapped cover of PFTs displays strong patterns of correspondence with fire perimeters (figure 10). Shrub cover decreases abruptly in the footprint of 2015 fire scars, and increases abruptly in burns 32 years and older. A similar pattern is evident for bryophyte AHC, except that bryophyte AHC is also high in unburned, poorly drained terrain in the southeastern fringe of the study area. The lichen model displays the most striking patterns, with very high cover in unburned uplands and low cover in both recent and historical burns.

Figure 10. Quantitative models of any-hit cover for three tundra plant functional types and map of wildfire perimeters in major wildfire years, Yukon-Kuskokwim Delta, Alaska.
Download figure:
Standard image High-resolution image
4. Discussion
4.1. Ecosystem impacts
4.1.1. Vegetation
The VPI data and PFT maps reveal strong fire-induced shifts in species composition and vegetation structure that persist for several decades. The most striking initial impact of wildfire was near-total mortality of lichen, consistent with observations elsewhere in Alaskan tundra (Racine et al 1987, Jandt et al 2008). In contrast, bryophyte abundance in recent burns was not dramatically different from that in unburned tundra. This finding contrasts with earlier studies that found low moss survival in burned tussock tundra (e.g. Racine et al 1987, Bret-Harte et al 2013). A large proportion of the surviving bryophytes in our study consisted of Sphagnum, which has high insulative value and moisture-holding capacity (Thompson and Waddington 2013). Sphagnum survivorship is important because it likely moderates fire impacts to edaphic conditions and thermal regime.
Shrub abundance was higher in historical burns than in unburned tundra, consistent with findings elsewhere in Arctic Alaska (e.g. Racine et al 2004). However, our observations and PFT maps indicated that shrub cover peaked in 32 years old burns and was lower in older burns. While some prior studies also found gradual declines in shrub cover late in post-fire succession (e.g. Barrett et al 2012), others have found that dense shrub cover can persist over centennial timescales (Jones et al 2013). Possible mechanisms for this variability include differences in the extent of shrub recruitment in early succession (Vavrek et al 1999, Lantz et al 2009), and a decline in shrub productivity in late succession associated with paludification and cooling soil temperatures (Lantz et al 2010, Frost et al 2018). We suggest that both mechanisms are likely important on the IKU. The similarity of shrub species composition and the persistence of thick surface peat across the fire history gradient indicate that historical fires have created little opportunity for seed-based shrub recruitment. In addition, active-layer recovery and the proliferation of Sphagnum and lichen likely constrain shrub productivity later in succession. This is consistent with the relative importance of evergreen shrubs in older burns; although evergreen species suffer high mortality and require longer periods to recover after disturbance than deciduous shrubs, they tend to be most abundant in acidic, nutrient-poor substrates (Chapin and Shaver 1981, Emers et al 1995, Auerbach et al 1997).
Graminoids tended to be more abundant in burned plots, regardless of time since fire. This is consistent with previous observations (Wein and Bliss 1973, Fetcher et al 1984, Bret-Harte et al 2013). However, the post-fire response of graminoids on the IKU likely differs from that observed in Alaskan tussock tundra; although tussocks are present on the YKD, they are generally not a dominant component of the vegetation. This is particularly true of unburned areas of the IKU, which are strongly dominated by fruticose lichens. The high abundance of lichen in the IKU is likely due in part to the lack of caribou and reindeer (Rangifer tarandus) in the region. Herbivory and trampling by caribou can strongly influence lichen abundance (Joly et al 2009, Klein and Shulski 2009) and extreme grazing pressure can virtually eliminate lichens from the landscape (Klein 1968, Henry and Gunn 1991). We suggest, however, that lichen regeneration is typically faster after grazing than wildfire, because lichen fragments left behind by caribou and reindeer can support vegetative regeneration of lichens after grazing pressure has diminished. Fire behavior in lichen-dominated fuels is relatively unstudied, but is likely to be less severe than in tussock tundra because of the low flammability of lichens relative to litter-rich tussocks (Sylvester and Wein 1981). Lower fire severity in lichen-rich fuels plausibly explains the higher survivorship of bryophytes and the lack of tall, canopy-forming shrubs that we observed relative to previous studies in tussock tundra.
4.1.2. Soils and permafrost
Soil surface organic thickness averaged about 30 cm in all fire history classes; however, thickness was most variable in plots sampled 2–3 and 10–11 years post-fire, and least variable in unburned plots. Our field observations in recent burns indicated that the thickest organic soils tended to co-occur with unburned Sphagnum. Sphagnum also remained common throughout post-fire succession, which is important because Sphagnum promotes paludification and a shallow active-layer. Shrub proliferation later in succession may also promote active-layer recovery because of the shading provided by shrub canopies during summer (Blok et al 2010, Myers-Smith and Hik 2013).
Thaw depth showed significant differences between burned and unburned sites. Thaw was deepest in plots sampled 2–3 and 10–11 years post-fire; thaw depth in older burns did not differ significantly from that in unburned tundra. Wildfire affects permafrost thermal regime by removing vegetation and insulating organic material, decreasing surface albedo, and altering soil hydrology. The recovery of soil active-layers over decadal timescales is broadly consistent with earlier field studies in primarily tussock-dominated tundra (Racine et al 2004, Narita et al 2015). Although our field measurements were recorded in mid-July, before seasonal thaw reaches maximum depth, our findings are consistent with geophysical work in the IKU that estimated that active-layer thickness recovered to pre-fire conditions by about 25 years post-fire (Michaelides et al 2019).
4.2. Sources of uncertainty
Investigations of tundra fire are frequently hampered by the low resolution and data gaps for historical fire perimeters (Kasischke et al 2002) and the lack of reliable fire severity data. For example, the Landsat-based Monitoring Trends in Burn Severity (MTBS) product (Eidenshink et al 2007) only exists for fires since 2002 on the IKU. MTBS did, however, capture the extensive 2015 fire footprint, of which >91% was classified as low or moderate severity. The lichen-dominated fuels and the scarcity of exposed mineral soils observed in recent firescars suggest that high-severity fire has been limited in extent on the IKU. We also know that fire perimeters invariably contain unburned patches, and inadvertent field sampling of such patches could confound analysis of post-fire succession. However, the high mortality of lichen after fire, and the persistence of Polytrichum in historical burns, provided obvious field characters by which we avoided unburned inclusions.
Uncertainties related to our chronosequence-based sampling could arise from local differences in pre-fire vegetation and soil conditions, raising the question of whether fire activity was concentrated in areas where antecedent conditions differed from unburned areas. We focused our study on upland tundra and avoided sampling wetlands and streambanks. We consider it unlikely that variability within upland tundra in the IKU was sufficient to influence broad-scale fire behavior. The quantitative cover maps presented here, coupled with high-resolution topography and soil moisture metrics, could inform future modeling efforts to characterize burn probability across the landscape.
The field dataset was relatively small due to logistical constraints, but each plot comprised 90 point measurements of vegetation spread across a 700 m2 area. In addition, our spatial models of PFT abundance show patterns of correspondence with fire history that corroborate the field observations, even though fire history was not a predictor in the models. Important sources of variability in post-fire succession, however, likely arise from differences in the landscape setting and severity of specific fires. While successional patterns likely vary according to landscape position and fire severity, our field observations are representative of the contiguous upland areas where most fire activity has occurred. The emergence of quantitative vegetation mapping techniques (He et al 2019) and fire severity metrics appropriate for tundra regions (Loboda et al 2013) provide a way forward for assessing tundra recovery after fire.
5. Conclusions
The YKD has experienced numerous tundra fires over the last millennium (Sae-Lim et al 2019) and at least 150 fires since circa 1950 (AICC 2019). Spring and early summer temperatures have increased since the mid 20th century on the inland YKD, increasing the potential for fire ignition and spread. Fire therefore represents a dominant disturbance agent and driver of vegetation dynamics in the region. Our floristic analyses indicate key patterns that are important for understanding the biophysical factors that influence resilience and vulnerability to fire on the YKD. Tundra communities here generally have low vascular plant diversity, and most of the dominant vascular species occur with high constancy regardless of fire history. This indicates that most vascular species are somewhat resilient to fire, or are common enough that some individuals escape fire. The rapid recovery of functional diversity that we observed after fire appears to be driven by the high resilience of vascular plant species and Sphagnum. This is consistent with the initial floristic composition model for secondary succession proposed by Egler (1954), which predicts that the majority of species present during succession are already in place following the disturbance, and that the reestablishment of the initial plant community is relatively rapid (Collins et al 1995, Capitanio and Carcaillet 2008). We also suggest that the lack of extensive ice-wedge polygons reduces the vulnerability of YKD ecosystems to secondary impacts; polygonal ground in colder tundra ecosystems is subject to dramatic and persistent changes in microtopography and soil hydrology due to thawing after fire (Jones et al 2015).
The rapid recovery of vascular plants contrasts with the much slower recovery of lichens. Floristic differences among plots were primarily driven by nonvascular vegetation, because few lichens survived fire, and several lichen taxa that colonized burned sites were scarce or absent in unburned tundra. We recorded only a single hit for lichens at each sampling point, but the mixed lichen mats found in unburned tundra are frequently 5–10 cm thick; therefore, the recovery of lichens after fire requires longer periods than our cover-based metrics would indicate. The slow recovery of lichens, coupled with the low abundance of tussocks (with their abundant litter), likely limits typical fire severity and the potential for repeat fire in the IKU. Although ~20% of the IKU has experienced fire since circa 1950, only ~0.8% of the fire-affected area has experienced multiple fires. This is likely because most fire is carried by lichen-rich fuels; recent estimates of reburned areas in tussock tundra of the Seward Peninsula and Noatak valley exceed 15% (Rocha et al 2012).
The frequency and severity of tundra wildfires appear to be increasing with climatic warming, indicating that the YKD and Beringia generally—a historic 'hotspot' of tundra fire (French et al 2015)—are likely to experience increased fire activity in the future. Given the high shrub abundance that we observed in historical burns, the YKD's relatively warm summer climate, and paleoecological evidence that links shrub-dominated Alaskan tundra with a more active fire regime (Higuera et al 2008), it appears certain that the region will become increasingly shrubby in the future. Thick accumulations of Holocene peat on the IKU, however, appear to limit opportunities for recruitment of fast-growing, tall shrub taxa (e.g. Alnus), and also buffer permafrost against the effects of disturbance and climate change (Shur and Jorgenson 2007). Nonetheless, fire-induced changes to surface properties could accelerate thawing of permafrost, and contribute to abrupt and persistent changes in habitats and carbon dynamics. Landscape drying, and the concomitant loss of ponds and other natural firebreaks could also increase the potential for repeat burns on the IKU. Our findings provide a basis for predicting and monitoring post-fire tundra succession across climatic and environmental gradients in the Low Arctic.
Acknowledgments
This work was funded by the Western Alaska Landscape Conservation Cooperative (WALCC) award F16AC01215, NASA Arctic Boreal Vulnerability Experiment contract NNH16CP09C and grant NNX15AU05A, US National Science Foundation awards NSF-1624927 and NSF-1561437, and the Maine Economic Improvement Fund–Small Campus Initiative. We thank Elizabeth Powers, Karen Murphy, and Joel Reynolds at WALCC; Kristine Sowl and Brian McCaffery at the Yukon Delta National Wildlife Refuge; the USFWS Alaska Division of Fire Management; and Scott McCollum at Pollux Aviation. Any use of trade, firm, or product names is for descriptive purposes only and does not imply endorsement by the US Government.
Data availability
The data that support the findings of this study will be openly available at https://doi.org/10.3334/ORNLDAAC/1772.