

Abstract
Wildfires are altering ecosystems globally as they change in frequency, size, and severity. As wildfires change vegetation structure, they also alter moisture inputs and energy fluxes which influence snowpack and hydrology. In unburned forests, snow has been shown to accumulate more in small clearings or in stands with low to moderate forest densities. Here we investigate whether peak snowpack varies with burn severity or percent overstory tree mortality post-fire in a mid-latitude, subalpine forest. We found that peak snowpack across the burn severity gradients increased 15% in snow-water equivalence (SWE) and 17% in depth for every 20% increase in overstory tree mortality due to burn severity. Snowpack quantity varied greatly between the two winter seasons sampled in this study with 114% more snow in 2016 versus 2015, yet the effect of burn severity on snowpack remained consistent. These data support previous studies showing increases in peak snow depth and SWE in burned forests but for the first time provides novel insights into how snow depth and SWE change as a function of burn severity. We conclude that changes not only in the frequency and size of wildfires, but also in the severity, can alter peak snow depth and SWE, with important potential implications for watershed hydrology.
Export citation and abstract BibTeX RIS
Corrections were made to this article on 6 January 2020. The title of the article was updated.
Introduction
Fires are one of the most widespread and ecologically impactful disturbances of earth ecosystems (Bowman et al 2009). Human activities are creating novel fire regimes by changing their frequency, size, and severity globally (Adams 2013, Westerling 2016). Fire varies in how it travels across the landscape often creating a 'mosaic' of burn severity, which can be visualized and monitored from remote sensing applications (Parr and Andersen 2006, Micheletty et al 2014). Burn severity can have large impacts on plant community succession and structure (Wan et al 2014a), which can be tied to fundamental changes in watershed hydrology. Patches of burn severity within a fire provide opportunities to understand the effects of post-fire condition on ecosystem hydrology (Turner et al 1999, Wan et al 2014b).
Snow-water resources from mountain watersheds provide fresh water for over 1/5 of the global human population and are critical for the function of montane ecosystems (Barnett et al 2005). Snowpack accumulation and ablation in mountain watersheds has shown to be strongly influenced by forest composition and structure (Veatch et al 2009, Varhola et al 2010, Hubbart et al 2015, Williams et al 2019). Forest cover can reduce snowpack by intercepting falling snow on branches and making it more vulnerable to loss through sublimation, yet, forest cover can also increase snowpack by protecting it from incoming solar radiation and other turbulent fluxes once snowfall has reached the forest floor (Musselman et al 2008, Harpold et al 2014). Other studies have shown these seemingly competing processes are likely mediated by insolation, latitude, and topography (Maxwell et al 2019). While several studies have observed the effect of forest fire on snowpack accumulation and ablation in burned and unburned forests, these studies have grouped forests into categories of burned and unburned and have not considered gradients of burn severity which are likely to have large effects on peak snowpack or snow available for springtime melt.
Peak seasonal snowpack before springtime melt can be determined by subtracting mid-winter sublimation and evaporation from the total snowfall magnitude (Harpold et al 2014). In colder environments mid-winter melt is generally limited (Lundberg and Koivusalo 2003, Harpold et al 2014). Mid-winter losses of snowpack through sublimation and evaporation average 15%–40% of total snowfall magnitude depending on forest density but may reach more than 60% in thick vegetation, high insolation, high wind speeds, and low humidity (Pomeroy et al 1998a, Varhola et al 2010, Wan et al 2014a, Biederman et al 2014). Forest fire has strong and unique effects on snow persistence compared to other forest disturbances such as logging or beetle kill in that: (1) pyrogenic carbon particles (charcoal/soot) which fall from tree snags to the snow's surface have shown to decrease albedo and increase net shortwave radiation thus accelerating mid-winter water losses (Gleason et al 2013); (2) burned forests tend to have higher surface temperatures and wind speeds (Burles and Boon 2011, Winkler 2011) and; (3) severe fires can sterilize soil, killing seed banks as well as standing trees that are normally fire tolerant, lengthening the time of recovery for a watershed after fire (Stephens et al 2009).
Montane forests provide an ideal study system for investigating the effects of burn severity on snowmelt because they exhibit strong patterns of burn severity and they account for a large part of the annual water budget for forest hydrology and urban water use (LaMalfa and Ryle 2008, Rogers et al 2013). While the general definition of burn severity is defined as 'the loss or change in organic matter aboveground and belowground' (Keeley 2009), when measuring snow accumulation and melt, tree mortality and subsequent leaf/needle loss is the primary variable of concern (Pomeroy et al 1998b, Varhola et al 2010). Remotely-sensed data is weighted towards change in canopy cover but was later correlated with percent tree mortality from field measurements, thus, the terms burn severity and percent tree mortality will be used interchangeably throughout the rest of this document.
The objective of this study was to examine factors affecting peak snow-water equivalent (SWE) and snow depth across a gradient of burn severity in a mid-latitude subalpine forest. To our knowledge this is the first study to examine the effects of burn severity on snow accumulation and water equivalence using direct measurements. We hypothesize (1) that more snow will accumulate and be available for springtime melt in severely burned forests due to reduced interception capacity, and; (2) that sampling year, canopy height, basal area, or elevation will have modifying effects on peak SWE and depth by altering snowfall magnitude, mid-winter snowpack energy fluxes, or the interception capacity of the forest canopy.
Methods
Study site description
This study took place in the Shingle creek and Indian creek watersheds on the Twitchell Canyon fire complex in south-central Utah, USA (Lat: 38.49 Long: −112.49), which burned in the summer of 2010 (see figure 1). This fire is considered a modern 'mega-fire' caused at least partially by years of fire suppression and the effects of a changing climate (Adams 2013). It is also known for its high spatial variability in burn severity (see figure 1). The USDA post fire analysis reported the fire to total 18 160 hectares with 33% high severity, 34% moderate severity, 20% low severity, and 13% unburned (USDA-Forest Service 2010). Dominant over-story vegetation across the study area includes Douglas-fir (Pseudotsuga mensezii var. glauca), subalpine fir (Abies lasiocarpa), ponderosa pine (Pinus ponderosa), limber pine (Pinus flexilis), and quaking aspen (Populus tremuloides). Perennial woody vegetation in the understory of the plots at the time of the study was minimal and included short shrubs less than 10 cm tall and low density quaking aspen suckers ranging from 10 cm to 3 m. Data from the Kimberly mine SNOTEL station (figure 1) indicated that the median annual precipitation for the area from 1981 to 2010 was 83 cm with approximately 41 cm of that coming as snow. At the same station the average annual temperature was 6.4 °C ranging from an average of −3.2 °C in January to 16.3 °C in August (NRCS 2019) (table 1).

Figure 1. Low, moderate, and severely burned treatment plots shown in experimental blocks (1–10) within the Twitchell Canyon Fire Complex. Burn severity maps were obtained from Monitoring Trends in Burn Severity (MTBS) website. Pixels are 30 m × 30 m.
Download figure:
Standard image High-resolution imageTable 1. Meteorological variables collected from Kimberly Mine SNOTEL station (∼5 km from treatment locations) during the 2014–15 and 2015–16 winter season. 'Precip' = Precipition, SWE = Snow-Water Equivalence, Max = the highest measurement within the given time period.
| 2014–15 Dec–Feb | 2015–16 Dec–Feb | |
|---|---|---|
| Mean | Mean | |
| Temperature (C°) | −2.0 | −4.6 |
| Precip accumulation (cm) | 20 | 41 |
| Max SWE (cm) | 19 | 36 |
| Day of max SWE | March 4th | March 30th |
| Max snow depth (cm) | 71 | 152 |
Experimental design
Ten experimental blocks were identified each containing three adjacent burn severity classes (low, moderate, and severely burned stands) (figure 1). Treatment plots were identified using National Agricultural Imagery Program satellite imagery as well as burn severity maps from Monitoring Trends in Burn Severity database (MTBS 2010). Low, moderate, and severely burned treatment plots were first identified using the Difference in Normalized Burn Ratio (DNBR) from remotely sensed MTBS data, then later verified on the ground by field measurements of percent overstory mortality (see Forest Canopy Characterization) (Whittier and Gray 2016). To isolate the effect of burn severity, treatment plots within a block had similar aspect, slope, vegetation type, vegetation density, and were within 150 m of other treatment plots within the same block. Measurements within each burn severity class were made along two 20 m perpendicular transects making a 20 m circular plot (see figure 2). As the objective of this study was to evaluate the effect of burn severity on snowpack accumulation, all sites were oriented on a north facing aspect and in conifer forest to limit the effects of solar radiation on mid-winter sublimation, evaporation, or melt.
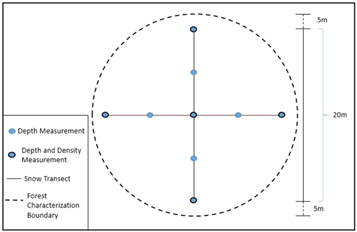
Figure 2. Plot diagram for both snow sampling and forest characterization of burn severity gradients. Depth measurements include a measurement one meter in front, behind, and to each side of the point indicated on the figure above.
Download figure:
Standard image High-resolution imageSWE and snow depth
SWE was measured using a US Federal snow sampler using the protocol from the USDA Snow Sampling Guidebook (USDA 1984). The same 20 m transects used for snow depth were used for SWE with the exception that measurements were measured every 10 m across each transect totaling five SWE measurements per site (see figure 2). These five measurements were averaged and considered representative of the given plot.
Snow depth was measured every 5 m along each 20 m transect. At each 5 m increment a depth measurement was taken 1 m in front, behind, to each side, and in place of the sampler totaling 45 depth measurements per plot (see figure 2). All depth measurements within a plot were averaged for statistical analysis and to avoid pseudoreplication.
Forest canopy characterization
To characterize forest canopies at each plot, the 20 m perpendicular transects used for snow depth and density measurements were extended five meters on each side to create two perpendicular 30 m transects which outlined a 30 m circular plot divided into four quadrats (see figure 2). Starting from the center and working out one quadrat at a time, each tree within each plot was evaluated for height, mortality (dead or alive), DBH (diameter at breast height) and identified to species. Height was measured using a TruPulse® 360° Rangefinder. Trees were considered dead if there was no observable living tissue such as leaves or needles. Tree calipers were used to measure DBH. While these forests were composed of both aspen (deciduous) and conifer (evergreen) species, all ten gradients were composed of >90% conifer and had an average canopy height of 9.7 m (SD = ±1.6).
Statistical analysis
We used model selection of linear mixed effects models to test how percent overstory tree mortality influenced snow depth and SWE. Mixed effects models allowed us to test for the influence of percent tree mortality, sampling year, canopy height, basal area, and elevation, as fixed effects while also accounting for spatial non-independence in the block design (Harrison et al 2018).
We tested all possible combinations of explanatory variables, for both snow depth and SWE (Burnham and Anderson 2004, Harrison et al 2018). We also tested the interactions between percent overstory mortality and elevation, and basal area and canopy height, as vegetation cover has shown to be less important at higher elevations with intense snowfall events (D'Eon 2004), and the combination of thick and tall vegetation should exert a stronger force on snowpack accumulation (Lopez-Moreno et al 2007). Before running the models, we calculated pairwise correlations among all independent variables to test for multicollinearity. As elevation and basal area had a correlation coefficient of 0.9, all models with both elevation and basal area present together were excluded. Because of the large difference in snow years, the variable sampling year remained in each model tested. To allow comparison of model coefficients for each parameter, all independent variables were centered by subtracting the mean from each value and scaled by dividing by the standard deviation (Harrison et al 2018). We compared model performance with corrected Akaike's Information Criterion (AICc), and selected a final model composed of only variables included in at least two of the top three models (Harrison et al 2018, Malone et al 2018). Prior to the analysis, data exploration was performed which included identifying outliers, assessing for homogeneity of variance, normality, zero inflation, multicollinearity, interactions, and independence as outlined by Zuur et al (2010). We visually inspected residuals of the final models for normality and homogeneity of variance and the data met model assumptions. All analyses were performed in R software (R Core Team 2017), using the packages lme4 (Wood and Scheipl 2014), lmertest (Kuznetsova et al 2015), and mertools (Knowles and Frederick 2016).
Results
Snow-water equivalent
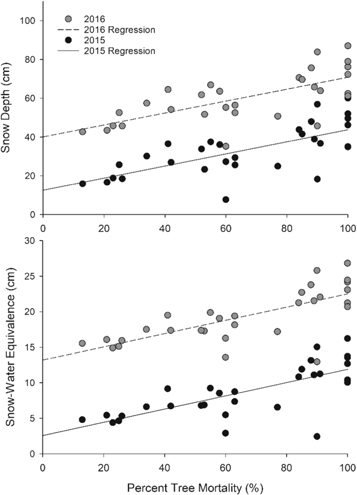
The top model for peak SWE included (in order of importance): sampling year, percent tree mortality, elevation, and the interaction between percent tree mortality and elevation (table 2); this model accounted for 85% of variation in SWE. SWE increased a total of 75% from unburned forests (0% mortality, 2015 = 2.5 cm, 2016 = 13 cm) to severely burned forests (100% mortality, 2015 = 11.8 cm, 2016 = 22.5 cm) or in other words SWE increased nearly 15% (1.9 cm) for every 20% increase in tree mortality (figure 3). Sampling year was the greatest predictor of SWE with SWE on average 10.6 cm greater in 2016 than 2015 (figure 3). Elevation had strong effect on SWE with an average 11.7 cm increase for every 100 meters gained in elevation (p = 0.08) (table 2). While the interaction between percent tree mortality and elevation, which would have indicated a weaker effect of vegetation on SWE at higher elevations, was included at least two of the top three models, it was not statistically significant (table 2).
Table 2. Results of the top mixed effects model for both snow depth and snow-water equivalence as determined by AICc. Percent tree mortality and year are the most important variables in determining both SWE and snow depth. Variables that were found not significant and thus not included in the optimal model were forest basal area or the interaction between basal area and canopy height.
| Fixed effects | Beta estimate ± SE | Statistic | p-value | Full model |
|---|---|---|---|---|
| Snow-water Equivalence (SWE) | t-value | R2 | ||
| Percent tree mortality | 3.1 ± 0.7 | 7.2 | <0.0001** | 0.85 |
| Elevation | 1.2 ± 0.6 | 2.0 | 0.08* | |
| Year | 10.6 ± 0.8 | 13.7 | <0.0001** | |
| Percent tree mortality*elevation | 0.7 ± 0.4 | 1.6 | 0.12 | |
| Snow depth | ||||
| Percent tree mortality | 9.5 ± 1.5 | 6.5 | <0.0001** | 0.81 |
| Elevation | 3.9 ± 2.5 | 1.6 | 0.16 | |
| Canopy height | −1.8 ± 1.5 | −1.2 | 0.22 | |
| Slope | 2.7 ± 2.3 | 1.2 | 0.26 | |
| Year | 27.0 ± 2.6.5 | 10.3 | <0.0001** | |
| Percent tree mortality*elevation | 2.3 ± 1.5 | 1.6 | 0.12 | |
Figure 3. Snow depth and snow-water equivalent across a gradient of burn severity or overstory tree mortality. Graph shows modeled data from the optimal models for both snow depth and snow-water equivalence determined by AICc (table 2).
Download figure:
Standard image High-resolution image
Snow depth
The top model for snow depth included (in order of importance): sampling year, percent tree mortality, the interaction between percent tree mortality, elevation, canopy height, and slope (table 2); this model accounted for 81% of the variability in snow depth across the study landscape (table 2). Snow depth increased a total of 85% from unburned forests (0% mortality, 2015 = 12.5 cm, 2016 = 40 cm) to severely burned forests (100% mortality, 2015 = 44 cm, 2016 = 71 cm) or in other words snow depth increased nearly 17% (6.25 cm) for every 20% increase in tree mortality (figure 3). Sampling year was the greatest predictor of snow depth with depth on average 27 cm greater in 2016 than 2015 (figure 3). While elevation, canopy height, slope, and the interaction between percent tree mortality and elevation were included in at least two of the top three models, their influence was not statistically significant (table 2).
Discussion
Wildfires regimes are changing in forest ecosystems (Westerling et al 2006, Bowman et al 2013), which may have cascading impacts on watershed hydrology (Adams 2013). Our first hypothesis that more snow would accumulate in severely burned forests was strongly supported (figure 3). We suspect that these increases in peak SWE and depth are strongly influenced by reduced canopy snow interception (Pomeroy et al 1998b, Mahat and Tarboton 2014). Our second hypothesis that other site characteristics such as sampling year, canopy height, basal area, or elevation would have modifying effects by altering mid-winter snowpack energy fluxes was partially supported with SWE and snow depth varying strongly across sampling years (p < 0.001) and SWE increasing with elevation (p = 0.08) but canopy height or basal area being insignificant. This data supports previous studies showing increases in peak snow depth and SWE in burned forests (Burles and Boon 2011, Winkler 2011, Gleason et al 2013) but for the first time provides novel insights into how snow properties change as a function of burn severity.
Percent tree mortality (burn severity) and peak snowpack
Peak snowpack levels were correlated with percent tree mortality, with deeper and more dense snowpack forming with greater burn severity (figure 3). These increases in SWE and snow depth are likely due to tree mortality and needle loss in higher burn severities resulting in reduced rates of canopy interception of snow. Previous studies evaluating snowfall interception in forest varying in forest density (Pomeroy et al 1998b, Essery et al 2003, Boon 2009), gradients of insect defoliation (Boon 2007, Mikkelson et al 2013), and burned versus unburned forests (Burles and Boon 2011, Winkler 2011, Gleason et al 2013) have identified reduced canopy density and foliage loss as contributing significantly to increased snowpack. Other studies have shown that burned forests may behave differently than other disturbances such as logging or beetle kill because of dark pyrogenic carbon deposits on snow (Gleason et al 2013). Our data suggest that post burn environments likely behave similarly to other disturbance types in regards to canopy interception of snowfall, mid-winter sublimation, and peak SWE and snow depth (Woods et al 2006, Mikkelson et al 2013) (figure 3). All plots in this study were located on northern facing aspects in order to reduce insolation, isolate the effects of burned forest on snowfall interception, and reduce the chances of mid-winter melt as has been done in most experimental designs (Burles and Boon 2011, Harpold et al 2014). A similar study done in this same Twitchell Canyon fire complex showed that sites on southern facing aspects can show an opposite trend of reduced snowpack in high severity burns as lack of forest cover in high burn severities exposes snowpack to high levels of insolation (Maxwell et al 2019). Thus, topographical aspect is important to consider when interpreting the results of this or any other study involving removal of overstory forest canopy (Ebel et al 2012).
The 'patchiness' of a fire also affects mid-winter heat fluxes and redistribution from wind and are likely to have strong impacts on peak SWE and depth in burned forests (Lundberg and Koivusalo 2003, Woods et al 2006, Stevens 2017). High complexity in a fire burn mosaic may limit the ability of wind to redistribute snow as patch size has shown to limit wind effects on snow (Pomeroy et al 2002). Troendle and Leaf (1980) showed that the greatest snow accumulation occurred in open forest patches which were 3–5 times as wide as the average surrounding canopy height and wind greatly reduced snow accumulation when forest patches were larger than 20× the surround canopy height. Plots in this study were placed in the forest, not in clearings, and were below the 3–5 times the average height of the surrounding canopy likely reducing wind speeds and turbulence that would cause high rates of sublimation/evaporation (figure 1). Low average temperatures at the study locations also made mid-winter melt events unlikely (table 1).
While the processes explored in this data likely affect hydrology, extrapolating data from this study to inform predictions of springtime streamflow and availability of water resources directly could be problematic. Biederman et al (2014) showed that increases in springtime evaporation in beetle killed forests due to high insolation with removed canopy density decreased streamflow despite an increase in peak snowpack. While it is likely that springtime evaporation increases with higher burn severities due to higher net solar radiation (Gleason and Nolin 2016), numerous studies have shown increased streamflow from burned watersheds (Kinoshita and Hogue 2015, Mahat et al 2016, Wine et al 2018). These studies did attribute increases in streamflow to reduced interception capacity of forests, but also to hydrophobicity of soils or reduced soil infiltration, lowered evapotranspiration from plants, and accelerated melt rates. No single studies we are familiar with to this date have examined water partitioning of snowpack between sublimation, evaporation, soil infiltration, and streamflow at the catchment level in burned montane forests.
Inter-annual variation and peak snowpack
Sampling year was the greatest predictor of snowpack in the mixed effects model (table 2) which is not uncommon in multiyear studies of snowpack (Winkler and Moore 2006). Despite significant increases in quantity of snowfall in the 2016 versus 2015 winter season, patterns of snowfall across the burn severity gradient did not change between sampling years as indicated by the parallel lines between years in figure 3. As forest canopies have a limit to how much snow they can hold, higher snowfall magnitude or storm intensities may change this pattern though it seems it was not reached in either year in this study (D'Eon 2004, Winkler and Moore 2006, Jost et al 2007). Storm frequency and storm intensity was evaluated between sampling years for storm anomalies that could affect snowpack development under forest canopies, but none were apparent. It is likely that snowpack magnitudes were not sufficient to saturate the interception capacity of the forest canopy at these elevations (2300–2570 m) and that patterns of increased snow accumulation with high burn severity may diminish at higher elevations.
Slope, elevation, basal area, and canopy height
Results from the mixed effects model show that neither slope, basal area, or canopy height had a significant influence (α < 0.05) on peak SWE or snow depth across the burn severity gradients (table 2). Slope, elevation, basal area, and canopy height were intentionally kept similar between treatment plots within a block and only differed between blocks in order to isolate the effect of burn severity. The small amount of variation in these variables between the 10 blocks, along with the strong effects of burn severity and inter-annual variation, likely caused these variables to be less significant than they otherwise would be on the landscape but were included so that we could be assured that burn severity was truly the cause of differences in SWE and snow depth.
The interaction between elevation and percent burn (if positive, indicating that burn severity is less powerful in determining snow depth or SWE at higher elevation) was also not significant (p = 0.12). D'Eon (2004) showed that canopy interception of snowfall could be overcome at higher elevations where increased snowfall quantity and more intense storm intensity took place. This was not validated in this study though it may be possible to occur at higher elevations or more intense storm events than were observed in this study.
Conclusion and implications
We conclude that burn severity can greatly alter peak seasonal snowpack accumulation by removing incremental portions of forest canopy density and allowing varying quantities of snowfall to reach the forest floor (figure 3). While differences likely exist in the springtime melting phase, these data suggest that burned forests behave similarly to other disturbance types (logging and beetle kill) in regard to canopy interception of snowfall, mid-winter sublimation, and peak SWE and snow depth. Future studies should include snowpack energy balances in burned forests on various topographical aspects and associate these energy balances with streamflow discharge measurements; these findings may be incorporated into landscape scale models to form predictions of the effects of wildfire disturbance on water availability. As fires continue to increase in frequency, size, and severity and as the demand for water steadily increases, there is a critical need to better understand how changing fire regimes are altering snowpack and affecting water availability and security for human populations and ecosystems downstream.
Acknowledgments
We gratefully acknowledge Anson Call and Andrew Bentz for their assistance and expertise with collecting data in the field, we'd also like to thank Dr Benjamin Abbot at Brigham Young University for his review of the writing of the manuscript and suggestions for statistical analysis.
Funding
This research was funded by the National Science Foundation (NSF) in accordance with the iUTAH EPSCOR project.
Data availability statement
The data that support the findings of this study are available from the corresponding author upon reasonable request.