

Abstract
Summer temperature dominates environmental degradation and water resource availability on the Tibetan Plateau (TP), affecting glacier melting, permafrost degradation, desertification and streamflow, etc. Extending summer temperature records back before the instrumental period is fundamentally important for climatic and environmental studies over long timescales. By pooling 39 tree-ring width records from the TP that show significant (P < 0.05) correlations with the summer (June–August) minimum temperature (MinT) of the nearest grid point, we reconstructed a 366-year summer MinT record for the southern TP (STP). Reconstructed and instrumental data are highly coherent within the 1950–2010 calibration interval (R2 = 0.50, P < 0.001). The reconstruction captures major temperature anomalies, such as the coldest interval of the 1810s–1820s and unprecedented warming since the 1990s. We found that the linear trends of the instrumental and reconstructed STP summer MinTs are significantly lower than those for the larger Eurasian continent over the periods 1950–2010 and 1850–1950, respectively. The lower warming rate of STP summer MinT since 1850 could be due to increased evaporative cooling, and the absence of warming enhancement factors such as snow-albedo and energy-absorbing aerosols in summer. The reconstructed summer warming rate for the STP appears to be significantly overestimated by the ensemble mean of the Coupled Model Intercomparison Project Phase 5 (CMIP5) historical simulation.
Export citation and abstract BibTeX RIS

Original content from this work may be used under the terms of the Creative Commons Attribution 3.0 licence. Any further distribution of this work must maintain attribution to the author(s) and the title of the work, journal citation and DOI.
1. Introduction
Rapid warming has been observed in the annual mean temperature of the Tibetan Plateau (TP), which is faster than that in low-latitude regions of the Northern Hemisphere and Eurasian continent (Yao et al 2000). This difference has mainly been attributed to a rapid winter–spring temperature increase (Liu and Chen 2000, Liu et al 2009). Nevertheless, summer temperature is the key factor dominating glacier melting and permafrost degradation (Li et al 2008, Xue et al 2009, Kang et al 2010, Yang et al 2010). The summer temperature of the TP modulates Asian summer monsoon precipitation (Li and Yanai 1996, Ueda and Yasunari 1998, Wang et al 2008) and the run-off of rivers originating in the TP, and therefore has significant impact on water resources over the TP and in densely populated downstream East Asia (Piao et al 2010). In addition, summer warming has led to enhanced greenness of the southern Tibetan Plateau (STP) (Shen et al 2016), and increased desertification over the northeast of the TP (Xue et al 2009, Xie et al 2010).
The temporal variabilities of the TP temperature are seasonally asymmetrical (Xu et al 2017), are sensitive to external climatic forcings including greenhouse gases, volcanic eruptions and energy-absorbing aerosols (Duan et al 2006, Ramanathan et al 2007, Lau et al 2010, Duan et al 2018), and are susceptible to internal variability embedded in the climate system at annual to multi-decadal timescales (Wang et al 2014, Shi et al 2015). Moreover, the warming rates of the TP are spatially inhomogeneous in northern and southern regions (Yang et al 2014), with generally faster warming rates observed at higher elevations (Liu et al 2009, Qin et al 2009). Since most metrological stations began operation in the 1950s (Liu and Chen 2000), little is known about whether the observed rapid annual mean temperature increase over the TP also holds true for the summer season prior to instrumental observation. Therefore, temperature records from further back in the past are vital for understanding climate variabilities and subsequent environmental changes over long timescales.
Palaeoclimate proxies are widely used to extend climate records back before the beginning of the instrumental records. Among the existing temperature reconstructions for the TP, most use a single record, or a few records, at local or small regional scales, and the results can be strongly biased to the local non-climate signals such as variations in local topography and species competition intensity (Shi et al 2015). This situation can be improved by pooling a larger number of records covering a wider area. In this study, we assemble a dataset compositing 39 tree-ring width (TRW) records spread across the STP (defined as 27–35°N, 77–103°E), all of which show significant correlations with the summer (June–August) minimum temperature (MinT) of the nearest grid points. By combining the TRW series into one record, we reconstruct a summer MinT history for the STP over the past 366 years. The early-stage warming trend from the Industrial Revolution (here defined as 1850) to 1950 is calculated and compared with the trends derived from the PAGES 2K reconstruction for the Eurasian continent and the ensemble mean of the Coupled Model Intercomparison Project Phase 5 (CMIP5) historical simulations over the STP.
2. Materials and methods
2.1. TRW, instrumental, PAGES 2K and CMIP5 historical simulation data
We assembled a dataset combining TRW data from 159 forest sites across the STP, of which 121 were downloaded from the International Tree Ring Data Bank (ITRDB) and the rest were from our and our contributors' datasets. All TRW measurements were detrended and standardized into chronologies using signal-free regional curve standardization with the CRUST software (Melvin and Briffa 2014a, 2014b) in order to remove age-related growth effects and preserve maximum climatic signal. Available off-pith data from the ITRDB and our datasets were used to estimate the pith offset during the detrending process. The portions of the chronologies with expressed population signal (EPS) values greater than 0.85 were included in the synthesis (Wigley et al 1984). Each chronology was linearly regressed over the maximum period overlapping with the 1950–2010 Climate Research Unit (CRU) TS4.03 (0.5° resolution) summer MinT of the closest grid point (Harris et al 2014). Thirty-nine TRW chronologies showing significant (P < 0.05) and positive correlations with local summer MinTs were included in the analysis (figure 1). Among them, the first 23 listed in supplementary table 1, available online at stacks.iop.org/ERL/14/124033/mmedia, were obtained from the ITRDB, with only five chronologies overlapping with the PAGES 2K project (marked with stars in supplementary table 1). The rest are from combined published datasets from summer temperature reconstructions on the TP (Fan et al 2009, Fan et al 2010, Li et al 2011, Shi et al 2015) and forest growth response to climate changes (Guo et al 2018, Shi et al 2019). These are identified according to the first authors of the data source references.
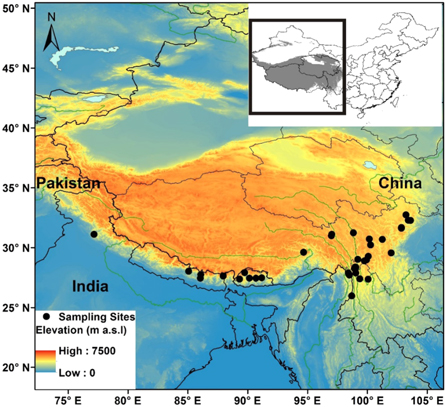
Figure 1. Locations of TRW records used for the STP summer MinT reconstruction. The black rectangle at the top right indicates the boundary of the map, and the grey shading marks the region of the TP (elevation greater than 3000 m a.s.l).
Download figure:
Standard image High-resolution imageTo compare the summer warming trends on the STP with those of larger regions and model simulations, summer MinT reconstructions for the Asian and Eurasian continents from the PAGES 2K project (Ahmed et al 2013), and individual historical summer MinT simulations for the STP region from 47 models used for CMIP5 (Taylor et al 2012), were obtained; outputs of several runs of the same model were averaged (the number of runs for each model is listed in supplementary table 2). Then, linear trends of summer MinTs derived from CMIP5 and PAGES 2K over the periods 1860–1950 and 1850–1950 were calculated, respectively, (some CMIP5 models started in 1860) and were compared with that of the STP summer MinT reconstruction using the Kruskal–Wallis test, a nonparametric (distribution free) test assessing for significant differences on a continuous dependent variable by a categorical independent variable.
2.2. Climate reconstruction
All 39 chronologies were Z-score normalized and averaged into a single record. The interval from 1645–2010 when replication was greater than ten chronologies (equivalent to an EPS value of 0.90) was considered for further analysis. The new record (spanning 1645–2010), termed the STP TRW record, was calibrated with the annual mean CRU TS4.03 STP summer MinT over the period 1950–2010 using linear regression. The validity of the model was tested using leave-one-out verification (Michaelsen 1987), the main indicators of which include the reduction of error statistic (RE), coefficient of efficiency (CE), product means test (PMT) and sign test (ST). In order to remove the possible trend effect on correlation results, R2 was also calculated using linearly detrended STP TRW records and the CRU STP summer MinT.
2.3. Reconstruction error
The CRU summer MinT and STP TRW records were randomly divided into two halves within the period 1950–2010. Each half was used to calculate a linear calibration model and validated with the other half, yielding 61 error values (the difference between validation data and calibration model prediction). This process was repeated 1000 times, and the 2.5 and 97.5 percentiles of the total error population were defined as the 95% confidence interval of the summer MinT reconstruction (Carre et al 2012).
3. Results
The mean correlation coefficient among the 39 chronologies is 0.46 (P < 0.001) over 1850–1949, suggesting a large common variance embedded in these data. The R2 value between the STP TRW record and the STP average summer MinT is 0.50 (P < 0.001) for 1950–2010 (figure 2(a)), and R2 is 0.41 (P < 0.001) if both series are linearly detrended (figure 2(b)). RE, CE, PMT, and ST yield values of 0.46, 0.48, 4.62 and 11.08, respectively, for the leave-one-out verification test, suggesting that the STP TRW record is a robust proxy for past summer MinTs. Once these tests were passed, the equation MinTJJA = 0.48 × chronology + 4.88 (in °C), where the subscript JJA refers to June–August, derived from the calibration of undetrended data within the period 1950–2010 (figure 2(a)), was used to reconstruct the STP summer MinTs for 1645–2010.
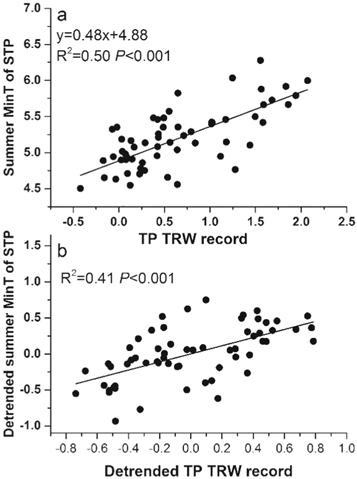
Figure 2. Linear calibration of the STP TRW records and CRU TS4.03 summer MinTs averaged over the STP. Panel (a): raw STP TRW records and summer MinTs; and panel (b): the same as panel (a) but using linearly detrended STP TRW records and summer MinTs.
Download figure:
Standard image High-resolution imageThe most obvious feature of the reconstruction is an abrupt increase in summer MinT after about the 1970s, leading to a dramatic rise in temperature, with the warmest interval of the reconstruction in the 1990s–2000s (figure 3). The coldest period is found in the 1810s–1820s (figure 3), with the coldest year in 1816, one year after the 1815 Tambora volcanic eruption (figure 3(b)).
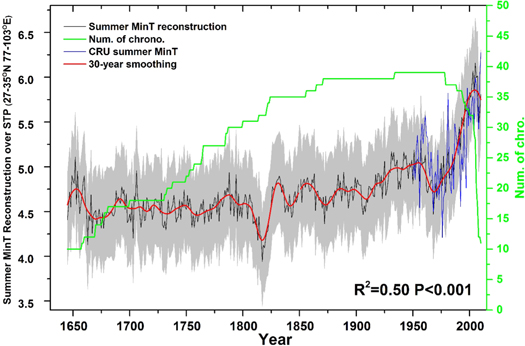
Figure 3. Instrumental (CRU TS4.03, blue line) and reconstructed (black line) STP summer MinTs. Grey shading is the 95% confidence interval for the summer MinT reconstruction. The horizontal green line is the number of chronologies combined for reconstruction, and the thick red line is the 30-year loess smoothing.
Download figure:
Standard image High-resolution imageThe linear trend for the CRU STP summer MinTs for 1950–2010 is 1.03 ± 0.50 × 10⁻² °C yr−1, which is significantly (P < 0.05) lower than the trends for Asia, Eurasia and the land surface of the Northern Hemisphere over the same interval (figure 4, 1.83 ± 0.18, 1.87 ± 0.20 and 1.87 ± 0.17 × 10⁻² °C yr−1, respectively).
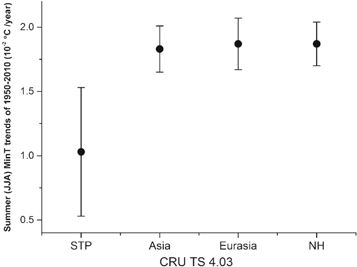
Figure 4. The linear trends of CRU TS4.03 summer MinT anomalies over the STP and Asian and Eurasian continents, and the land surface of the Northern Hemisphere (NH) within 1950–2010. The vertical lines are the 95% confidence intervals of the trends. The difference of the linear trends was verified using the Kruskal–Wallis test.
Download figure:
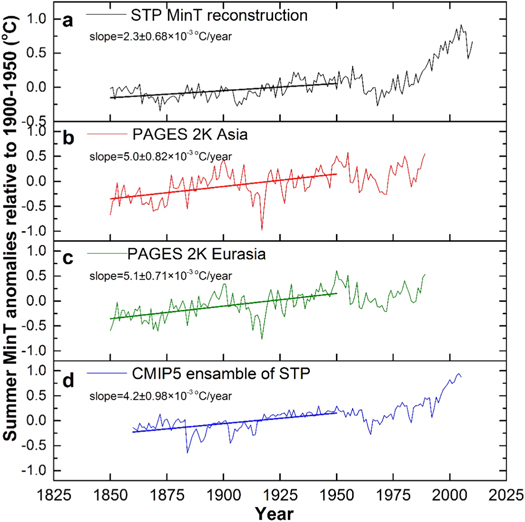
Standard image High-resolution imageThe linear trend of the STP summer MinT reconstruction from 1850–1950 is 2.3 ± 0.38 × 10⁻³ °C yr−1 (figure 5(a)), significantly (P < 0.01) lower than those derived from Asian and Eurasian reconstructions by the PAGES 2K project (figures 5(b) and (c), 5.0 ± 0.82 and 5.1 ± 0.71 × 10⁻³ °C yr−1, respectively). The warming rate of our reconstruction is significantly (P < 0.05) lower than that of the ensemble mean CMIP5 historical simulations over the STP between 1860–1950 (figure 5(d), 3.2 ± 0.43 versus 4.08 ± 0.41 × 10⁻³ °C yr−1, respectively, as some CMIP5 historical outputs are available from 1860).
Figure 5. Linear trends of summer MinT anomalies in 1850–1950 (1860–1950 for CMIP5 ensemble mean) and their 95% significance intervals. Panel (a): our reconstruction for the STP; panel (b): PAGES 2K reconstruction for Asia; panel (c): PAGES 2K reconstruction for Eurasia; and panel (d): mean CMIP5 historical simulation for the STP. The difference of the linear trends was verified using the Kruskal–Wallis test.
Download figure:
Standard image High-resolution image
4. Discussion and conclusions
The 1809 unknown and subsequent 1815 Tambora volcanic eruptions, which caused large radiative forcings over the globe (−12.01 and −17.20 W m−2, respectively) (Sigl et al 2015), led to 40 years of summer cooling in North America, unprecedented over the last 1100 years, and were the coldest decades of the last millennium in the Eurasian continent and the Northern Hemisphere (Briffa et al 1998, Ahmed et al 2013). The abrupt volcanic cooling of the 1810s–1820s recorded in our STP summer MinT reconstruction was evident in other summer temperature reconstructions over the STP (Liang et al 2008, Shi et al 2015), the Himalayas in Nepal (Cook et al 2003), and the entire TP (Duan et al 2018). However, the volcanic cooling signal in the post-1850s period that mixed with a significant anthropogenic warming trend (figure 5(a)), was challenging to identify. It is worth noticing that the amplitude of abrupt instrumental cooling in 1975 was largely underestimated in our reconstruction. An insensitive or even absent response to large and abrupt cold stress was widely reported for TRW-based studies (Mann et al 2012, D'Arrigo et al 2013, Stoffel et al 2015). So far, consensus has not been reached about the causes (Anchukaitis et al 2012, Mann et al 2012), while maximum wood density was proved to be a good substitute for TRW for studying abrupt cooling events (D'Arrigo et al 2013, Stoffel et al 2015, Duan et al 2018).
The warmest period of the 1990s–2000s in our reconstruction was also reported in temperature reconstructions for North India, the Northern Hemisphere and the entire globe (D'Arrigo et al 2006, Mann et al 2008, Ahmed et al 2013, Shah et al 2019), which coincided with the observed rapid glacier melting, permafrost degradation and consequent lake-level increase across the TP (Yao et al 2007, Kang et al 2010, Vu et al 2012, Yao et al 2012, Zhang et al 2013), and the accelerating Greenland and Antarctica ice sheet and high mountain glacier melting outside the TP (Gardner 2013, Luthcke et al 2013).
Greater warming rates were observed subsequently at higher elevations and this effect, termed 'elevation-dependent warming' (Qin et al 2009, Wang et al 2014, Pepin et al 2015), was mainly attributed to faster MinT warming at higher elevations as compared to the maximum (Diaz and Bradley (1997), Easterling et al 1997, Ding et al 2018). Elevation-dependent warming rates were also recorded for the TP MinT, characterized by a seasonally asymmetrical pattern with the highest warming rate in winter–spring and the lowest in summer (Liu et al 2006, Wang et al 2018). The observed maximum winter–spring MinT warming on the TP was mainly induced by largest snow cover and albedo reduction (Liu et al 2009, Minder et al 2018), further enhanced by black carbon deposition on the snow surface (Ming et al 2008, Ramanathan and Carmichael 2008, Rahul et al 2014) and by energy-absorbing aerosols most prominent in spring (Ramanathan et al 2007).
By combining 240 tree-ring records, the PAGES 2K project has reconstructed summer MinTs for the Eurasian continent over the past millennium. With only five TRW chronologies overlapping, our reconstruction is independent of the PAGES 2K project. Similar to the lower STP summer MinT trend found in the instrumental data (figure 4), the warming rate of reconstructed summer STP MinTs over the period 1850–1950 is also significantly lower than those for the Asian and Eurasian continents (figures 5(a)–(c)). The mean changes of CRU summer MinT from 1950–2010 showed that STP warming is minor, and the largest warming occurred in central-western and high latitudes of the northeastern Eurasian continent (supplementary figure 1).
The lower warming rate of STP summer MinT could be due to the absent snow-albedo effect, and black carbon deposition on snow at elevations with extensive forests on the STP in the summer season. Energy-absorbing aerosols, accounting for 50% of the warming amplitude over the STP (Ramanathan and Carmichael 2008) are also insignificant in summer (Lau et al 2010). The summer warming can be further attenuated by evaporative cooling in response to warming-induced enhancements in vegetative growth and evapotranspiration (Shen et al 2015). The large summer MinT warming at high latitudes shown in supplementary figure 1, partly dominating the Eurasian continent summer MinT trend, could be largely due to the arctic amplification effect through the greatest sea ice reduction in boreal summer (Screen and Simmonds (2010)), and to persistent warming of the North Atlantic Ocean (Zhang et al 2007, Delworth et al 2016).
The smaller trend of our reconstruction as compared to the ensemble mean of CMIP5 simulations suggests that most CMIP5 models have overestimated the historical warming rate of the STP summer MinT, and implies the warming attenuating factors in summer should be implemented in these models.
Acknowledgments
This study was supported by the National Key Research and Development Plan (2017YFD0600106), the National Natural Science Foundation of China (91647202, 31971667, 31600354, 31570645, 31770490), and the Fundamental Research Funds for the Central Universities from Beijing Forestry University.
Data availability statement
The CRU climate data are available at http://www.cru.uea.ac.uk/data; CMIP5 historical simulation data can be downloaded from KNMI climate explorer at http://climexp.knmi.nl/selectfield_cmip5.cgi?; some of the TRW data are available at the ITRDB https://www.ncdc.noaa.gov/data-access/paleoclimatology-data/datasets/tree-ring); and the rest of the TRW data that support the findings of this study are available from the corresponding author upon reasonable request.