

Abstract
Background: Nitrogen dioxide (NO2) poses substantial public health risks in large cities globally. Concentrations of NO2 shows high spatial variation, yet intra-urban measurements of NO2 in Chinese cities are sparse. The size of Chinese cities and shortage of some datasets is challenging for high spatial resolution modelling. The aim here was to combine advantages of dispersion and land-use regression (LUR) modelling to simulate population exposure to NO2 at high spatial resolution for health burden calculations, in the example megacity of Guangzhou. Methods: Ambient concentrations of NO2 simulated by the ADMS-Urban dispersion model at 83 'virtual' monitoring sites, selected to span both the range of NO2 concentration and weighting by population density, were used to develop a LUR model of 2017 annual-mean NO2 across Guangzhou at 25 m × 25 m spatial resolution. Results: The LUR model was validated against both the 83 virtual sites (adj R2: 0.96, RMSE: 5.48 μg m−3; LOOCV R2: 0.96, RMSE: 5.64 μg m−3) and, independently, against available observations (n = 11, R2:: 0.63, RMSE: 18.0 μg m−3). The modelled population-weighted long-term average concentration of NO2 across Guangzhou was 52.5 μg m−3, which contributes an estimated 7270 (6960−7620) attributable deaths. Reducing concentrations in exceedance of the China air quality standard/WHO air quality guideline of 40 μg m−3 would reduce NO2-attributable deaths by 1900 (1820–1980). Conclusions: We demonstrate a general hybrid modelling method that can be employed in other cities in China to model ambient NO2 concentration at high spatial resolution for health burden estimation and epidemiological study. By running the dispersion model with alternative mitigation policies, new LUR models can be constructed to quantify policy effectiveness on NO2 population health burden.
Export citation and abstract BibTeX RIS

Original content from this work may be used under the terms of the Creative Commons Attribution 3.0 licence. Any further distribution of this work must maintain attribution to the author(s) and the title of the work, journal citation and DOI.
1. Introduction
It is expected that by 2025 roughly 70% of the global population will live in urban areas (United Nations 2014). China is at the forefront of this trend of rapid economic development and urbanisation, which has led to the emergence of megacities (>10 million people) and megacity clusters and concomitant problems of poor air quality (Chan and Yao 2008, Wang and Hao 2012, Cohen et al 2017, Sun and Zhou 2017, Airvisual 2019).
Nitrogen dioxide (NO2) is a key urban air pollutant with well-documented public health impacts. Exposure to ambient NO2 is associated with increased mortality (WHO 2013, Faustini et al 2014, Crouse et al 2015). It is also linked to respiratory symptoms such as bronchitis, asthma and reduced lung-function growth in children, and to cardiovascular and Alzheimer's disease (Brunekreef and Holgate 2002, Weinmayr et al 2010, Chiusolo et al 2011, Luo et al 2016, Yan et al 2016, Anenberg et al 2018).
Ambient concentrations of NO2 in many Chinese cities exceed the air quality standard (Ministry of Environmental Protection 2018a). The predominant sources of NO2 are road traffic, other combustion processes in domestic, commercial and industrial settings, including cooking, and (where relevant) shipping (Fu et al 2017, Liu et al 2017, Ding et al 2018, Zheng et al 2018a). Due to the widespread sources and relatively short lifetime of NO2, its concentrations are strongly spatially varying (Beirle et al 2011, Cyrys et al 2012, Gurung et al 2017). The China National Environmental Monitoring Centre has implemented a nationwide monitoring network for routine measurements of ambient NO2 (and other pollutants), but despite the increase in the number of monitoring sites across China in recent years, air quality monitoring networks cannot provide the highly spatially resolved concentration fields needed to accurately evaluate the population health burden of exposure to NO2. Measurements also cannot provide the data needed to evaluate future mitigation scenarios that address the challenges of reducing population exposure to NO2.
Instead, modelling approaches are needed. Urban-scale air pollution models fall into two basic categories: dispersion models (Visscher 2013), and land-use regression (LUR) models (Briggs et al 1997, Jerrett et al 2005). A dispersion model strives to accurately simulate the fundamental physical–chemical processes in the atmosphere from emission source to all selected receptor locations, whilst a LUR model establishes significant predictor variables for concentrations at known locations and uses the statistical relationship to estimate concentrations at all other locations. However, modelling NO2 concentrations in China is challenging as the detailed input data required for modelling that exist for Western cities are much more limited for Chinese cities (He et al 2018). Chinese cities are large in both population number and geographical area compared with cities in Europe and North America (United Nations 2017), and are also characterised by high population density: an average of 5000 per km2 in urban areas with a population >500 000, which is almost double that for EU cities (2900 per km2) and triple that for North American cities (1600 per km2) (Demographia 2019). The lack of a full suite of input data is a particular challenge for dispersion models, as is the computational demand of running such a model over the size of a typical Chinese city. LUR models are more flexible in terms of data requirement but can generally only be used to estimate long-term-average pollutant concentration fields, and they lack predictive capability. The lack of measurement data and difficulty in modelling limit epidemiological studies and health impact assessments in China (Cao et al 2011, Gu et al 2017, Sun and Zhou 2017, Huang et al 2018, Li et al 2018, Lin et al 2018, Ji et al 2019).
In this work, we demonstrate a practical approach to simulating annual-average concentrations of NO2 in Chinese megacities in which we combine the advantages of both dispersion and LUR modelling (Mölter et al 2010). We use an urban dispersion model to simulate annual-average NO2 concentrations at strategically chosen 'virtual' sites. This network of virtual measurements is then used to develop an LUR model to estimate NO2 concentrations over the whole region at 25 m × 25 m resolution, from which mortality health burdens can be calculated. A particular advantage of this approach is that it can be used to derive spatially-resolved LUR models for future scenarios that are rooted in process-based dispersion model simulations of those scenarios. Here we demonstrate our methodology for the example Chinese megacity of Guangzhou, which is the third largest city in China. We use our hybrid model to estimate the scale of long-term health burden currently existing in Guangzhou due to the spatially varying NO2 concentrations.
2. Method
2.1. Study design
The city of Guangzhou is located on the north side of the Pearl River Delta (figure 1). It has a total area of 7434 km2 and a population of 14 million, divided into six districts (Conghua, Guangzhou city centre, Huaxian, Nansha, Panyu, and Zengcheng) (table 1). Concentrations of NO2 are measured at 11 sites (figure 1). The workflow for this study is shown in figure 2. The ADMS-Urban dispersion model v4.1 (CERC 2017) was used to derive NO2 concentrations at 83 additional strategically-selected receptors locations across Guangzhou, which were then used to develop an LUR model for NO2 concentrations across the whole city.
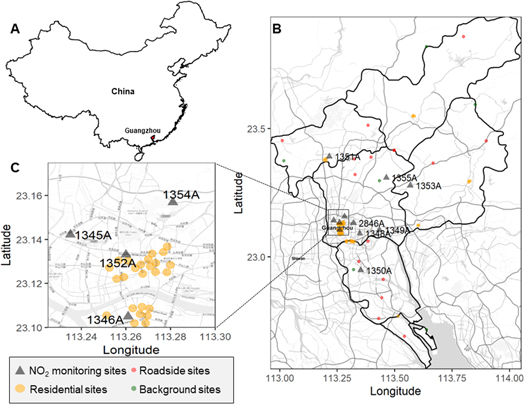
Figure 1. (A) The location of Guangzhou in China. (B), (C) The locations of the 11 NO2 monitoring sites and 83 virtual receptor sites for the dispersion modelling, which were stratified into the six districts of Guangzhou indicated by the boundaries. The labels on the maps are the Guangzhou codes for the monitoring sites; additional site location description is provided in supplementary information table S1, available online at stacks.iop.org/ERL/14/124019/mmedia. Map tiles by Stamen Design (2019), under CC BY 3.0. Data by OpenStreetMap, under ODbL.
Download figure:
Standard image High-resolution imageTable 1. Population of each district, the number of residential and roadside sites selected and the number residential sites also satisfying the definition of roadside site.
| District | Population | No. of residential sites | No. of residential sites also fitting roadside definition | No. of roadside sites |
|---|---|---|---|---|
| Conghua | 596 816 | 3 | 0 | 1 |
| Guangzhou city centre | 7909 399 | 37 | 1 | 6 |
| Huaxian | 916 916 | 4 | 1 | 2 |
| Nansha | 110 923 | 1 | 0 | 1 |
| Panyu | 1986 223 | 10 | 0 | 5 |
| Zengcheng | 1120 186 | 5 | 0 | 2 |

Figure 2. Schematic of the integration of ADMS-Urban model results into an LUR model. The methodology for selection of the 83 receptor locations is described in the text.
Download figure:
Standard image High-resolution image2.2. The ADMS-urban model
The ADMS-Urban dispersion model v4.1 (Carruthers et al 1994, CERC 2017) is a widely-used (McHugh et al 1997, Carruthers et al 2000, Di Sabatino et al 2007, Righi et al 2009) quasi-Gaussian model for simulating dispersion in the atmosphere of continuous releases from a range of explicit sources in an urban area. The NOx–NO2 chemistry is simulated using the 8-reaction set of Venkatram et al (1994) that includes reactions with ozone and hydrocarbons. This General Reaction Set has been thoroughly evaluated against measurements (see e.g. Tonnesen and Jeffries 1994, Venkatram et al 1994, Chaney et al 2011, Carruthers et al 2017). Surface deposition is included in the model. The sources of data used for the ADMS-urban dispersion modelling of NO2 concentrations at monitor locations and at the virtual sites in this study are given in supplementary information (SI) table S2. Gridded emissions of NOx and VOCs for the year 2016 were obtained from the Multi-resolution Emission Inventory for China (Zheng et al 2018a) and downscaled to 4 km × 4 km horizon resolution using various spatial proxies (Geng et al 2017, Zheng et al 2018b). Shipping emissions were taken from MarcoPolo-Panda for the year 2014 (MarcoPolo-Panda 2017). A map of the total NOx emissions is shown in SI figure S1. Motorway, trunk, primary, secondary, and tertiary roads, as defined by OpenStreetMap, were explicitly modelled as road sources (OpenStreetMap 2018). Emissions from roads were calculated by assigning total on-road traffic emissions to the explicitly modelled roads according to road type and total length of each road, as described in SI section A.
Wind speed and direction at 10 m above the ground, and cloud cover were obtained from ECMWF-ERA5 (ECMWF 2019). Background concentrations of NO2, NOx, and O3 were obtained from the Copernicus Atmosphere Monitoring Service (CAMS) (ECMWF 2019). As the prevailing wind direction in Guangzhou is from the northeast (SI figure S2), the background site for pollutant concentrations for the model was chosen to be a rural location to the northeast of the model domain (SI figure S3). The model was evaluated using the NO2 concentrations at the 11 monitoring sites shown in figure 1.
2.3. Selection of the ADMS-urban virtual receptor sites
As the main purpose of modelling NO2 concentrations is to estimate NO2 where people live, the virtual sites were primarily selected to be proportionally located across the residential areas of Guangzhou. The six districts have a large range in population (table 1) so site selection was first stratified across the six districts so as to ensure that sites in the virtual network were located across the full domain area. Centroids of each cell of population data (100 m × 100 m) (Worldpop 2015) were extracted as potential virtual receptor sites. Three types of virtual sites were defined for each district so as also to span the range in anticipated NO2 concentration:
- Background site: centroid of the population cell with greatest distance to the nearest road.
- Roadside sites: centroids of the population cells with a distance to nearest road of no more than 5 m.
- Residential sites: centroids of the population cells with the highest population density.
In each district, residential sites were selected first, with number of residential sties proportional to the relative proportion of the total Guangzhou population in that district (the specific number is given in table 1). One residential site in two districts also fitted the definition of roadside site (see table 1), but these were retained under the category of residential. All other sites that satisfied the definition of roadside site (17 across the six districts, table 1) were selected as receptor locations within the roadside site category. A background site was selected in each district. An additional overarching criterion was a minimum distance of 300 m between any pair of sites in each district to ensure that all sites were distributed across the range of localities in the study area. The locations of the 83 sites are shown in figure 1. ADMS-Urban was used to simulate annual-mean NO2 concentrations at these locations at a height of 1.5 m.
2.4. LUR model predictor variables
Sources of data used to develop the LUR model are given in SI table S2. Potential predictor variables (SI table S5) for the LUR model were chosen based on expectation that emission sources, dispersion, and physical geography may contribute to NO2 concentration variation in urban areas (ESCAPE 2008). The inclusion of different buffer sizes allows for potential different influences of a predictor variables over different distances from the receptor (Su et al 2009, Beelen et al 2013).
Road lengths in a buffer had to be used as surrogates for traffic flow and fleet composition, as neither of these data are publicly available for Guangzhou. The variables of number of people and artificial (i.e. non-natural) area within a buffer do not directly affect NO2 concentration, but they are indirectly related to road transport emissions and to domestic, industrial and electrical generation emissions which contribute to total NOx emission in Guangzhou (SI figure S4). Distance to nearest port and its derivatives were included as non-buffer variables to account for the impacts of shipping, Guangzhou is close to the South China Sea, and is a major port, with ship activities significantly contributing to total NOx emissions in the southern part of the model domain (Liu et al 2016, Johansson et al 2017) (SI figure S4). A maximum distance of 35 000 m was specified for the distance to port variable as the dispersion modelling at the virtual sites indicated that NO2 concentration decreased to urban background level at this distance from nearest port as shown in SI figure S5.
Green, i.e. not built-up, areas are assumed to mitigate NO2 concentration since they are not sources of NO2 and also act as areas over which NO2 concentrations disperse and dilute (and deposit), hence the a priori direction of effect of the green area variable is negative (Jim and Chen 2008). Coordinates and altitude were included to reflect physical geography influence and wind speed and direction proxies.
2.5. LUR model development and validation
A stepwise multiple regression approach was used to select the potential predictor variables to maximise the adjusted percentage explained variance (R2) and minimise the root mean square error (RMSE) (ESCAPE 2008). First, all predictor variables were individually regressed against the dependent variable data (annual-mean NO2 concentrations modelled by ADMS-urban at the 83 receptor sites). The predictor variable which explained the most NO2 concentration variation (highest R2) and with a coefficient in the a priori-defined direction (SI table S5) formed the initial model. The univariate linear regression process was repeated with the remaining variables. A variable with the highest increase in adjusted R2 was added into the initial model if it met the following criteria: (1) the increase in adjusted R2 was greater than 0.01; (2) the coefficients of this variable and the variables already in the model were in accord with the a priori-defined direction. This process was repeated until no further variable satisfied the criteria. In the final step, variables with p-value greater than 0.1 were removed from the model starting from the variable with highest p-value.
Tests were then performed to check multicollinearity and influential observations. Multicollinearity in the variables was checked using Variance Inflation Factor (VIF). Variables with VIF values greater than three were removed from the model. Extreme values or many zero values in a variable data can skew the final model and this can be indicated by Cook's distance >1. In this study, no observation was removed. The model was validated using both the measurement and virtual site concentration data.
2.6. Health burden calculation
Calculation of total premature deaths from concentrations of NO2 followed the methodology described by Walton et al (2015). We used the association with all-cause mortality of 2.45% (95% CI: 2.34%, 2.58%) per 10 μg m−3 elevation of NO2 reported by Zhang et al (2011). This health risk coefficient was used since it was derived from data in Shenyang, a province in China. The number of deaths in 2017 in Guangzhou was 60 900 (Guangzhou Statistics Bureau 2018). The population data (100 m × 100 m) was resampled to the resolution of the concentration map (25 m × 25 m). The population-weighted average concentration (E) for NO2 across the whole of Guangzhou was calculated as follows

where  and
and  are the concentration and the number of people in each cell i of the concentration map.
The attributable deaths from exposure to ambient NO2 in Guangzhou was calculated by multiplying the attributable fraction by number of all-cause deaths (equations (2)–(4)), where RR refers to relative risk


3. Results
3.1. ADMS-urban model validation
The ADMS-Urban model showed good statistical performance against the annual-mean NO2 concentrations at the 11 monitoring sites in Guangzhou (figure 3(A)). The model explains 72% of the spatial variation in the measured NO2, with an RMSE of 17.7 μg m−3, albeit with a tendency to overpredict NO2 concentrations (MB = 11.2 μg m−3, NMB = 0.22). A likely explanation for the general overprediction is that the precise height of each monitoring site is unknown. The only information provided to us is that they range in elevation from 2 to 20 m, which is consistent with anecdotal information that pollutant monitoring sites in Chinese cities are often situated on tops of buildings, and thus at higher elevation (where NO2 concentrations would be lower) than the receptor height used in the model. The greatest model overprediction at site 1354A (figure 3(A)) is likely explained by the fact that this site is located in a park in the city centre and is surrounded by dense vegetation whose effects on NO2 concentration (through dispersion, deposition, and temperature reduction) are not sufficiently captured by the model. As the distance to nearest road for all 11 monitoring sites is greater than 5 m, the observed data can not verify the model for roadside locations where highest NO2 concentrations are anticipated, but at the other end of the concentration range the model predicted well the background site 1355A which is located in an area of natural land cover (Maofengshan). It is also important to recognise that the observational data have uncertainty. Measurement errors have been reported previously in China but more recent literature indicates that data is more reliable since 2013 (Yuyu et al 2012, Ghanem and Zhang 2014, Stoerk 2016). The monitoring specification HJ654-2013 (Ministry of Environmental Protection 2018b) also specifies detailed calibration procedures for each instrument such as zero and scale noises, error of indication, zero and span drifts tests. However, overestimation of NO2 concentrations using instruments based on the chemiluminescence method (TEI Model 42i from Thermo Fisher Scientific Inc., USA) ranged from 6% to 280% depending on the composition of the oxidation products of NOx has been reported (Xu et al 2013). It has not been feasible to robustly quantify uncertainty for the NO2 measurements in Guangzhou within the scope of this study, as documentation of the processes applied for data quality control and assurance (QA/QC) and the operating principles at each monitoring site is not publicly available.
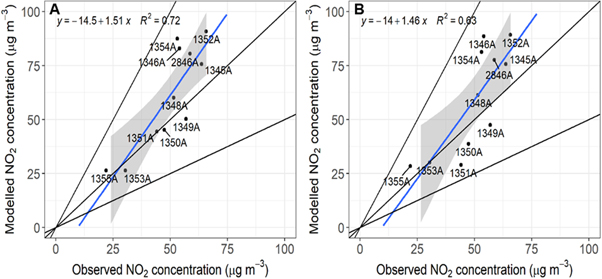
Figure 3. (A) Dispersion model NO2 concentrations versus observed NO2 concentrations. (B) Hybrid LUR and dispersion model NO2 concentrations versus observed NO2 concentrations.
Download figure:
Standard image High-resolution image3.2. Hybrid LUR model and validation
The final LUR model contained three variables (table 2): pop_5000 (the number of people within a 5000 m buffer) sq_dis_port (the squared distance to the nearest port), and all_len_25 (the length of all type of roads within a 25 m buffer). The three variables respectively represent the influence of people (indirectly related to residential, industrial, and traffic emission, and inversely related to green space), shipping emissions, and traffic emissions. Table 3 summarizes the results of hybrid LUR model evaluation against both the 83 virtual sites and the 11 monitoring sites and figure 3(B) shows the scatter plot for the LUR model predictions at the 11 monitoring sites.
Table 2. The final LUR model variables and their coefficients and standard errors.
| Variable | Definition | Coefficient | Standard error |
|---|---|---|---|
| Intercept | / |

|
1.77 |
| pop_5000 | Number of people within a 5000 m buffer |

|

|

|
Squared distance to the nearest port |

|

|
| all_len_25 | Length of all type of roads within a 25 m buffer |

|

|
Table 3. LUR model performance evaluated by training (R2 and RMSE), LOOCV (R2 and RMSE), and observation (R2 and RMSE).
| Evaluation method | R2 | RMSE (μg m−3) |
|---|---|---|
| Using 83 virtual sites | 0.96 | 5.48 |
| LOOCV using 83 virtual sites | 0.96 | 5.64 |
| Using measurement at 11 monitoring sites | 0.63 | 18.0 |
Against the 83 virtual sites, LOOCV evaluation shows the hybrid LUR model explains 96% of the spatial variation of NO2 concentration with an RMSE of 5.64 μg m−3. The NO2 concentrations at the monitoring site provide an additional evaluation of the hybrid LUR model independent of the NO2 data used to construct the model (table 3 and figure 3(B)). For this plot, R2 = 0.63 and MB = 9.08 μg m−3, which corresponds to a NMB of 18.2%. These statistical uncertainties seem reasonable for intra-urban modelling/mapping of a domain of this size and with the paucity of detailed emissions data to support modelling. Figure 3(B) shows that the hybrid model slightly overestimates NO2 concentrations, which as discussed earlier is likely the consequence of the model predicting NO2 concentration at 1.5 m height, which is lower than the height of most monitoring sites (2–20 m). Closer inspection of figure 3(B) shows that the model generally over-predicts more at locations with higher NO2 concentrations which can be rationalised because these are the locations most affected by local traffic emissions for which there is insufficiently detailed input data. As noted above, it is also important to recognise that there is uncertainty in the observed values.
3.3. Concentration map and health burden calculation
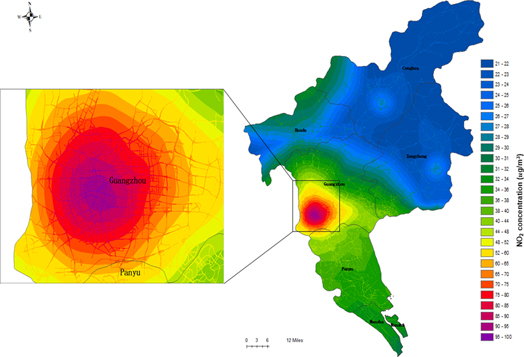
Figure 4 shows the spatial distribution of annual-mean NO2 concentration across Guangzhou in 2017. Modelled concentrations vary between 21.5 μg m−3 in the most rural areas in the north of the domain to 99.7 μg m−3 in the most polluted district of Guangzhou city centre. The map indicates that, as expected, concentrations of NO2 are highest on road links, particularly those with heavy traffic as shown on the expanded map of the city centre. The model NO2 concentration show high values at the boundary of Nansha, which is likely due to shipping (SI figure S4). The population-weighted annual-mean concentration of NO2 across Guangzhou is 52.5 μg m−3. Even this population-weighted concentration exceeds the Chinese air quality standard and WHO guideline of 40 μg m−3 (WHO 2006, Ministry of Environmental Protection 2012), but figure 4 indicates that, in large areas of Guangzhou, concentrations of NO2 are substantially in excess of this value.
Figure 4. The final hybrid dispersion-LUR model of NO2 concentrations in Guangzhou. The most polluted district is Guangzhou city centre. NO2 concentrations are higher at locations around the road links, industrial areas, and close to the ports (in the southern part of the model domain).
Download figure:
Standard image High-resolution image
The modelled number of deaths attributable to long-term exposure to NO2 in Guangzhou in 2017 was 7270 (6960–7620; range based only on the 95% CI for the health risk coefficient). For comparison, the total number of deaths from road-traffic accidents in Guangzhou was 847 in 2015 (Guangzhou Municipal Public Security Bureau 2016). Approximately 60% of people in Guangzhou experienced NO2 concentration above the China air quality standard/WHO guideline of 40 μg m−3. The air quality plan (2016–2025) published by the Guangzhou government to combat air pollution problems sets the target of meeting the NO2 air quality standard of 40 μg m−3 by 2020 (Guangzhou Government 2017). Our model predicts that if all areas with NO2 concentrations greater than 40 μg m−3 were reduced to the air quality standard, the number of lives saved would be 1900 (1820–1980) compared to the 2017 estimate.
4. Discussion
Compared to LUR, dispersion modelling has the advantage of grounding simulations of pollutant concentrations for different scenarios in a process-based simulation of the controlling processes; but the approach requires detailed input data on emissions (e.g. emission inventories), meteorological parameters, and background concentrations, which are currently not fully available/accessible in most cities in China. Aleksankina et al (2018, 2019) have investigated model uncertainties in relation to emission input data in detail, highlighting that atmospheric chemistry transport models show relatively robust responses to changes in emission input data. LUR is an efficient modelling approach, but in areas with limited monitoring sites such as Guangzhou, with only 11 monitoring sites, the selected variables may overfit the model and hence cause bias in health-effect estimates (Basagaña et al 2012). LUR is also limited to modelling measured air pollutants and cannot predict air pollutant concentrations under potential future emissions scenarios. However, despite the disadvantages mentioned above, LUR is relatively cheap and easy to implement; and once input datasets are assembled, LUR models can be readily adapted to new 'measurement' data without needing to consider complex physicochemical processes.
The challenge of high spatial resolution air pollution modelling has driven integrated data and modelling approaches (Johnson et al 2010, Beevers et al 2012, Hao et al 2016, Yang et al 2017, Hood et al 2018, Xue et al 2019). For megacities of large area like Guangzhou, without additional monitoring data, our solution for simulation of an NO2 concentration map has been to derive a hybrid modelling approach that uses a virtual network of receptor locations for dispersion and LUR modelling. This approach gives flexibility to choose the input sites (such as weighting towards residential population (around 60% of the receptors are in Guangzhou city centre) and number of sites (83 receptor sites). It also takes less time to generate a high-resolution map over a large domain compared with dispersion modelling only. In this hybrid approach, dispersion modelling is used to conduct scenario analysis and LUR is used for interpolating the spatial trends. This approach can be easily used to derive concentration maps to calculate health burdens (including for future scenarios) or for epidemiological studies.
There are of course uncertainties, as for any modelling approach. Even though we have sought to play to the strengths of the available data for Guangzhou, data accessibility and quality are generally an issue for China (He et al 2018). For example, detailed industrial emissions as point sources for the dispersion model are not accessible in Guangzhou. Similarly, detailed traffic flow and speed are not available, hence road length was used as a proxy in the LUR model. Also daily vehicle NOx emissions on different road types in Beijing had to be used to estimate emissions on different roads in Guangzhou. Since detailed land-use data are not available, satellite observation derived data Globeland30 were used (Globeland30 2010). It is extremely difficult to get access to monitoring data in Guangzhou; several websites provide real time data (Aqicn 2019, CNEMC 2019), but historical data are not available for download from official sites and the detailed location and environment of the monitoring sites are unclear. State-controlled sites were used in this study, but no information about monitoring site heights was available other than they range in elevation from 2 to 20 m. The quality of monitoring data is unknown. ADMS requires concentrations of NO and NO2 background concentrations but only NO2 was reported at each monitoring site, therefore ECMWF-CAMS re-analysis data was used for the boundary concentration. No roadside monitoring sites were available, so neither the dispersion nor the LUR model simulations could be validated at highest NO2 concentrations. Since the LUR model used ADMS-Urban modelled concentrations as input, the hybrid model inevitably transmits any bias in the dispersion modelling to the final model.
In terms of the health burden calculation, detailed census data is not available and UN modelled population data (Worldpop 2015) were used instead. A health risk coefficient from a single-pollutant model was used which may overestimate the actual effects due to NO2 (COMEAP 2018).
5. Conclusions
Given the current challenges related to data availability, accessibility and quality in Chinese megacities, and their large spatial area, a single model struggles to provide high spatio-temporal resolution air pollution maps for the whole city. In this work, a combined dispersion and LUR model approach to simulate annual average NO2 for health burden assessments was demonstrated for the megacity of Guangzhou. Ambient concentrations of NO2 simulated by the ADMS-Urban dispersion model at 83 'virtual' monitoring sites, selected to span both the range of NO2 concentration and weighting by population density, were used to develop a highly spatial resolved LUR model. To our knowledge, this is the first attempt to apply this approach to maximise the advantages of both modelling approaches and to overcome data shortcomings in relation to data availability in China. This method can be employed in other cities in China, or globally, to model ambient NO2 concentration at high spatial resolution to investigate the effectiveness of potential mitigation policies. The dispersion model simulates the effect of different emissions scenarios on concentrations at the network of receptor locations, from which LUR modelled maps are constructed to estimate future concentrations and health burdens across the whole domain.
Acknowledgments
Baihuiqian He is grateful for studentship funding from the China Scholarship Council and the University of Edinburgh. We thank Kate Johnson and Xiaodan Hu for their contributions towards this research. The work of Stefan Reis was supported by the UK Natural Environment Research Council (NERC) National Capability award NE/R000131/1 (Sustainable Use of Natural Resources to Improve Human Health and Support Economic Development, SUNRISE). BH, SR and MRH conceived the aims and methodology of the research. LY and QH assembled and advised on Guangzhou emissions inventories. BH and KHH assembled additional datasets. BH, with some assistance from KHH, undertook the modelling, mapping and calculations. BH prepared material for the paper and drafted the text. MRH and SR supplied additional writing and interpretation. All authors commented on and approve the final manuscript.
Data availability statement
Any data that support the findings of this study are openly available at DOI (https://datashare.is.ed.ac.uk/handle/10283/3420).