


Abstract
Heavy reliance on traditional biomass for household energy in eastern Africa has significant negative health and environmental impacts. The African context for energy access is rather different from historical experiences elsewhere as challenges in achieving energy access have coincided with major climate ambitions. Policies focusing on household energy needs in eastern Africa contribute to at least three sustainable development goals (SDGs): climate action, good health, and improved energy access. This study uses an integrated assessment model to simulate the impact of land policies and technology subsidies, as well as the interaction of both, on greenhouse gas (GHG) emissions, exposure to air pollution and energy access in eastern Africa under a range of socioeconomic pathways. We find that land policies focusing on increasing the sustainable output of biomass resources can reduce GHG emissions in the region by about 10%, but also slightly delay progress in health and energy access goals. An optimised portfolio of energy technology subsidies consistent with a global Green Climate Funds budget of 30–35 billion dollar, can yield another 10% savings in GHG emissions, while decreasing mortality related to air pollution by 20%, and improving energy access by up to 15%. After 2030, both land and technology policies become less effective, and more dependent on the overall development path of the region. The analysis shows that support for biogas technology should be prioritised in both the short and long term, while financing liquefied petroleum gas and ethanol technologies also has synergetic climate, health and energy access benefits. Instead, financing PV technologies is mostly relevant for improving energy access, while charcoal and to a lesser extend fuelwood technologies are relevant for curbing GHG emissions if their finance is linked to land policies. We suggest that integrated policy analysis is needed in the African context for simultaneously reaching progress in multiple SDGs.
Export citation and abstract BibTeX RIS

Original content from this work may be used under the terms of the Creative Commons Attribution 3.0 licence. Any further distribution of this work must maintain attribution to the author(s) and the title of the work, journal citation and DOI.
1. Introduction
Heavy reliance on traditional biomass for household energy in developing countries has significant negative health and environmental impacts (Masera et al 2015), a problem that is especially acute in sub-Saharan Africa (SSA). Household air pollution (HAP) from the use of solid cooking fuels is among the top three environmental risk factors contributing to illness and death worldwide. In SSA, children under 5 die at higher rates from HAP exposure than in any other world region (Forouzanfar et al 2016). Meanwhile, SSA hosts many woodfuel 'hotspots', where a large fraction of fuelwood and charcoal is harvested unsustainably, contributing significantly to greenhouse gas (GHG) emissions (Bailis et al 2015) and forest degradation (Ndegwa et al 2016, Kiruki et al 2017). Moreover, with only around 20% of its population having access to modern energy sources, energy access levels in SSA are lower than in any other region (World Bank and IEA 2017).
All three problems—air pollution, GHG emissions and energy access—are recognised by the United Nations in its 2030 Agenda for Sustainable Development, in which ambitious sustainable development goals5 (SDGs) are proposed to solve each of them by 2030 through SDG 3 (good health), SDG 7 (affordable and clean energy) and SDG 13 (climate action), among other development goals. In the context of developing regions, strong synergies between health and climate policies are recognised (Cai et al 2018, Markandya et al 2018), while energy access improvement is showed to have more synergies than trade-offs with most other SDGs, including those on health and climate action (Nerini et al 2017b, Grubler et al 2018, McCollum et al 2018). However, countries in SSA would have to achieve unprecedented rates of progress to obtain universal electricity access (SDG 7) within the coming decades (Rao and Pachauri 2017) and improving the efficiency of biomass energy systems is a cost-effective alternative for reducing forest degradation and HAP in the short term (Smeets et al 2012, Nerini et al 2017a).
This high dependence of rural communities in SSA on locally gathered energy sources, often with resulting forest degradation and health problems, was no different in pre-industrial eras of currently developed countries (Elias and Victor 2005). Over time, the energy systems of these countries went through a long transition path with multiple radical and incremental innovations (Geels and Schot 2007), each innovation bringing in energy service cost savings and/or quality improvements (Fouquet 2010). Leapfrogging of modern technologies by technologically poor countries is a well-known concept. Technologies without long supply chains or network infrastructure are more likely to be adopted via leapfrogging in developing countries (Tukker 2005, Szabó et al 2013). The African context for energy access is rather different from historical experiences elsewhere as challenges in achieving energy access and installing energy infrastructure have coincided with major climate ambitions and climate impacts (Agbemabiese and Nkomo 2012). Furthermore, increasing reliance on charcoal in SSA may impose significant ecological constraints unless overall dependence on traditional biomass is reduced in favour of modern energy sources and services (Santos et al 2017). Consequently, innovative frameworks are needed that can reconcile energy access, health and climate ambitions along a feasible but nevertheless ambitious timeframe.
Given the heterogeneous mix of policy objectives in the SSA context, and the high implicit uncertainty for policymaking caused by the wide range of possible development scenarios in the region, integrated and robust policy analysis is required for designing policies that take advantage of identified synergies between different SDGs, independent of the socioeconomic development of the region (Collste et al 2017, Doukas et al 2018, Duan et al 2018, Mainali et al 2018). In regions where the lack of access to modern energy sources and consequential high dependence on unsustainably harvested traditional biomass are major causes of GHG emissions and premature mortality, the implementation and impacts of policies such as carbon taxing are not straightforward and, instead, land policies and subsidies for cleaner energy technologies will constitute effective policy instruments for sustainable development (Mohammed et al 2015, Cameron et al 2016, Schwerhoff and Sy 2017). The green climate fund (GCF) has been founded to fund such initiatives in developing countries, which are often cost-effective in mitigating GHG emissions, but which would not be exercised due to a lack of financial means.
Due to a combination of demographic and climate conditions, eastern Africa is a hotspot for unsustainable biomass harvesting (Bailis et al 2015). This study therefore focuses on eastern Africa and uses a novel integrated policy assessment approach: first, an integrated assessment model is used to simulate the impact of land policies and technology subsidies, as well as the interaction of both, on GHG emissions, exposure to air pollution and energy access, under a range of socioeconomic development pathways. Subsequently, a robust portfolio analysis is further applied to optimally allocate a subsidy budget over different technologies to simultaneously tackle these three interrelated problems.
2. Background
2.1. Challenges
Eastern Africa6 is one of the poorest regions in the world, with the lowest percentage of the population living in urban areas (Kammila et al 2014), which is one of the main reasons why a large share of its people lack access to modern energy sources (see panel A in figure 1). Like in the majority of SSA and South-Asia, the high reliance on traditional biomass causes the death rate due to indoor air pollution in eastern Africa to be around 50 per 100 000 people (see panel B in figure 1). At the same time, the high share of unsustainably harvested biomass in eastern Africa (around 56% of all biomass; see panel C in figure 1) makes it an interesting region to explore co-benefits between climate action and other SDGs.
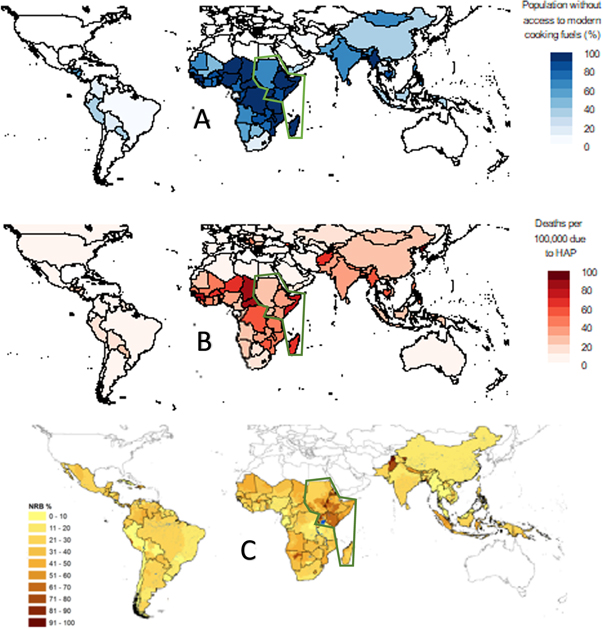
Figure 1. Visualisation of the three-dimensional challenge for Eastern Africa (in every panel surrounded by green boundary), with (A) the share of population that lacks access to modern cooking fuels in 2015 (IEA 2017a); (B) the death rate from indoor air pollution per 100 000 people in 2015 (Forouzanfar et al 2016); and (C) the non-renewable fraction of fuelwood production in 2009, assuming 'normal' exploitation of the commercial surplus (Bailis et al 2015).
Download figure:
Standard image High-resolution imageAverage GHG emissions per capita in eastern Africa are still relatively low (about 1/3 those of China and 1/6 those of the United States by 2010), but emissions per unit of final energy are relatively high (about three times those of China and the United States) (IEA 2017a, 2017b, Janssens-Maenhout et al 2019). This is mainly due to the reliance on traditional biomass, which, apart from the land use change emissions due to unsustainable production, causes large amounts of fugitive emissions when combusted (Masera et al 2015). About 40% of direct and indirect GHG emissions in 2010 were related to the gathering, transformation and use of biomass resources (see table C1 in the SM).
The rural population in eastern Africa, over three-fourths of the total population, suffers very low levels of access to both electricity and clean cooking fuels (see figure C1 in the SM is available online at stacks.iop.org/ERL/14/094001/mmedia). On average, more than 80% of rural households in eastern Africa gather their biomass, taking up to two hours a day per household member, while inefficient cooking stoves cause female household members to spend many hours per day cooking (Kammila et al 2014). The high domestic use of biomass resources translates to around 117 000 deaths per year due to HAP by 2015 (Forouzanfar et al 2016). Ambient air pollution (AAP) is also an increasing problem in the region, leading to around 32 000 premature deaths per year by 2015, expected to increase in the next decades.
2.2. Solutions
Technologies that increase the output of biomass resources per unit of land, such as rotational woodlot systems and agroforestry, can be promising and cost-effective solutions to land degradation and deforestation (Nyadzi et al 2003, Smeets et al 2012, Iiyama et al 2014). Such solutions however do not contribute to levels of access to modern energy sources, neither to a reduction of HAP or AAP. In fact, a higher abundance of biomass resources could translate into higher consumption and pollution exposures. In order to improve the quality of cooking and reduce exposure to related air pollution, other technologies are required that improve the efficiency of using biomass, such as clean biomass cooking stoves (Kammila et al 2014, Nerini et al 2017a) and improved charcoal kilns (Bailis et al 2013, Iiyama et al 2014). However, even if clean cooking stoves are used for biomass, WHO Air Quality Guidelines are often not met (Pope et al 2017).
Technologies that substitute biomass as an energy source, predominantly for cooking, usually also improve energy access levels and reduce exposure to air pollution. For example, liquefied petroleum gas (LPG) has proven to effectively displace some demand for biomass as cooking fuel in developing countries and contribute to net reductions in GHG emissions and HAP (Singh et al 2017, Bruce et al 2018). Ethanol cooking stoves have clear benefits for HAP as well, although GHG benefits depend on the feedstock used to produce ethanol (Gopal and Kammen 2009), and examples for large-scale implementation are limited (Benka-Coker et al 2018, Mudombi et al 2018a). Biogas has proven to be successful in improving energy access, avoiding forest degradation and improving health (Gosens et al 2013, Clemens et al 2018), and is particularly interesting for rural households in eastern Africa as such systems require local resources, predominantly animal manure (Gwavuya et al 2012, Mengistu et al 2015). Electric cooking is the cleanest possible way of cooking, as no emissions are released in the cooking process. Photovoltaics (PV) also reduce emissions related to electricity production to the very minimum, and their flexibility allows for affordable electricity off the central grid (Mandelli et al 2016). While cooking on electricity is not common for off-grid households due to high voltage requirements (Bhatia et al 2015), rural PV and to a lesser extent biogas can improve energy access through many other applications (Szabó et al 2011, Rahman et al 2014, Dalla Longa et al 2018).
In the last decades, numerous projects have been developed to scale up the use of clean cooking stoves, many of them depending on financial support (Usmani et al 2017, Clemens et al 2018, Quinn et al 2018) and in many cases funded by the GCF7 . Subsidies for clean energy technologies can help overcome barriers and improve households´ access to modern forms of energy, in support of sustainable development (Cameron et al 2016, Töpfer et al 2017). While most of such projects succeed in increasing ownership of such stoves, sustained use is not always guaranteed, with 'stove stacking' as a result, often related to availability, reliability, economic flexibility and cultural factors (Ruiz-Mercado and Masera 2015). With increasing income, households seem to be willing to pay the additional cost for clean cooking options like ethanol (Takama et al 2012); however, continued use, as compared to initial adoption, also depends on factors such as reliability of fuel supply over time (Mudombi et al 2018b).
3. Methods
The goal of this study is to estimate an optimal mix of technology and land policies to simultaneously reduce GHG emission, reduce exposure to air pollution and improve energy access. In the core of this analysis, we use the Global Change Assessment Model (GCAM) to simulate future policy and socioeconomic scenarios for eastern Africa. Through different methodologies, outputs from each policy scenario are translated to progress parameters that are relevant to SDG objectives. These parameters are fed into a robust portfolio analysis that finds a mix of policies that maximises progress in each of the SDGs in a Pareto-optimal way that is robust for a range of socioeconomic pathways. Figure 2 gives an outline of the study design and the methodology section.
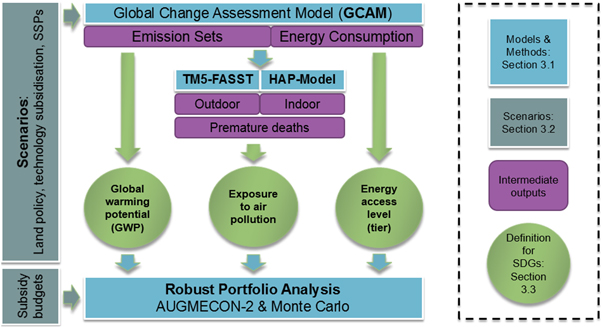
Figure 2. Flowchart showing outline of study design and methodology section.
Download figure:
Standard image High-resolution image3.1. Models and methods
GCAM8 has been used as a base for this study. GCAM is a dynamic-recursive model with technology-rich representations of the economy, energy sector and land use linked to a climate model that can be used to explore climate change mitigation policies including carbon taxes, carbon trading, regulations, and accelerated deployment of energy technologies. We have updated the model using a variety of data sources to better represent the interrelationships between energy, land use and emissions in eastern Africa. See section A1 of the SM for a wider description of the model.
To estimate premature deaths from indoor and outdoor pollutants as given by the GCAM model, we use two separate estimations. For HAP-related mortality, we found a semi-linear relationship with historically estimated indoor PM2.5 emissions. For AAP-related mortality, we use the air quality model TM5-FASST, which is a source-receptor air quality model that reports the AAP related mortalities from a defined emission set and population estimate9 (Van Dingenen et al 2018). To that end, the model calculates the PM2.5 and O3 concentration levels by adding up the emissions of a wide range of pollutants and their inter-regional interactions. See section A2 of the SM for a wider description of these methodologies and how we use them to calculate pollution-related premature mortality for each policy scenario.
In order to evaluate the impacts that different subsidy portfolios have on GHG emissions, premature deaths and energy access tier progress, we use a multi-objective optimisation framework based on the principles of portfolio analysis. Based on the cost effectiveness of technology subsidies for each of these three goals, the optimisation identifies Pareto-optimal subsidy portfolios under a given subsidy budget, and the robustness of each portfolio to a wide range of variables (O'Neill et al 2014) in the GCAM model. Key parts on the proposed methodology are explained by Forouli et al (2019a) as well as in section A3 of the SM. Forouli et al (2019b) provide more details on the combined use of GCAM output and robust portfolio analysis.
3.2. Scenario design
To understand the impact of sustainable land management, we have considered three different socioeconomic pathways and practices with and without land policies and explored six scenarios to assess the interactions of these two factors. On top of this, we have examined six different technology pathways and 20 different subsidy levels, resulting in a total of 720 policy scenarios implemented in the model runs, to investigate the impact of land policies and technology subsidies on GHG emissions, health, and energy access:
- 1.
- 2.SSP2: a middle of the road pathway, based on historical patterns
- 3.SSP3: a rocky road pathway, featuring high population, and low GDP per capita, urbanisation, crop yields, technological progress and pollution controls
- 4.SSP5: a fossil-fuelled pathway, featuring low population, and high GDP per capita, urbanisation, crop yields, technological progress and pollution controls
- 5.2 initial GCAM scenarios:
- 6.NO LAND POLICY: baseline without options to increase sustainable forest output
- 7.LAND POLICY: scenario that includes educational policies, to be fully effective by 203011 , focusing on teaching forest and agricultural land owners how to increase the sustainable supply of biomass by rotation forestry and agroforestry practices.
- 8.
- 9.LPG path: LPG stoves and fuel production costs
- 10.PV path: electric stoves and PV projects (utility-scale, mini-grid and off-grid)
- 11.Biogas path: biogas digesters and burners
- 12.Ethanol path: ethanol stoves and fuel production costs
- 13.Improved charcoal path: improved charcoal stoves and improved charcoal kilns
- 14.Improved fuelwood path: improved fuelwood stoves and suitable woody biomass feedstocks
If modelled on top of a land policy scenario, the charcoal and fuelwood technology subsidies are linked to sustainable biomass inputs. In other words, as a condition for receiving subsidies for producing charcoal with improved kilns, or producing woody biomass feedstocks suitable for improved cooking stoves, production inputs have to come from sustainable woodlot or agroforestry systems.
In a next step, the policy outcomes in terms of progress on each of our three objectives are extracted for the years 2020, 2030 and 2040 for a robust portfolio analysis. Two different annual subsidy budget constraints are applied to this process, which can be linked to two possible scenarios with respect to contributions from advanced economies to the GCF:
- 1.Low, consistent with annual GCF contributions of about 30–35 billion USD by 202014 : starting from $ 3.5 billion (USD at 2015 values) in 2020 (∼$11 per capita), increasing by 5% per year, reaching $ 5.7 billion by 2030 (∼$14 per capita) and $9.3 billion by 2040 (∼$20 per capita).
- 2.High, consistent with annual GCF contributions of 100 billion USD by 202015 : starting from $10.5 billion in 2020 (∼$32 per capita), increasing by 5% per year, reaching $ 17.4 billion by 2030 (∼$43 per capita) and $27.9 billion by 2040 (∼$60 per capita).
Finally, an optimal subsidy portfolio is identified for each of these three timepoints, with and without a land policy, and for each subsidy budget, adding up to a total of 12 subsidy portfolios. The robustness level of each portfolio is measured by the extent to which the policy outcomes depend on socioeconomic variables, summarised in the different SSPs.
3.3. Definitions of sustainable development indicators
This study tries to allocate land and technology policies to optimise the progress among three SDGs, concretely climate action (SDG 13), good health (SDG 3) and improved energy access (SDG 7). Here we describe how these SDGs are translated to measurable outputs from the models that are used.
- 1.Climate action: We identify progress on climate action by the direct and indirect global warming potential (GWP; IPCC 2007) of all emission flows in eastern Africa. See section B1 of the SM for the list of GHGs and their assumed GWP level.
- 2.Good health: Health progress is defined by reductions in premature mortality due to indoor and outdoor air pollution, predominantly caused by the direct and indirect smoke from cooking stoves. While air pollution also causes non-lethal health damage, we used mortality as a proxy for total exposure to air pollution in the region.
- 3.Improved energy access: Regarding access to affordable and clean energy, we follow the 'tier level' methodology (Bhatia et al 2015). A tier represents a qualitative level of access to energy services for an individual household, ranging from 1 (no access or low quality) to 5 (high access and quality), and the average of all households is used to measure progress in energy access. The average of the electricity access tier and the cooking tier is used, with an equal weight for both. Section B2 in the SM explains how GCAM outcomes are translated to tier levels.
4. Results
In this section we present baseline results of sustainable development indicators in scenarios with and without land policy and for different SSPs, the impact that different technology policies have on these indicators, and the identified Pareto-optimal subsidy portfolios and their robustness levels for different years and for scenarios with and without land policies.
4.1. SDG progress under baseline, land policy and SSP scenarios
Socioeconomic pathways have considerable impacts on the future viability of reaching SDGs (O'Neill et al 2014). We classified SSP3, SSP2 and SSP5 as scenarios with respectively lower, middle and higher progress in achieving the examined SDGs for the context of eastern Africa. Figure 3 shows the estimated scenario-dependent progress in these SDGs in the short (2020), medium (2030) and longer (2040) term16 . First, we see that each scenario is in line with global trends with respect to developing regions (see also table C1 in SM): GHG emissions and energy access levels increase over time, while relative mortality decreases over time due to a decreasing exposure to indoor air pollution. In terms of climate action, SSP3 leads to slightly higher GHG emissions in the short term (more forest degradation), but slightly lower emissions in the long term (less fossil fuel consumption), compared to SSP2. For SSP5, we observe exactly the opposite. In terms of health, we observe clearly lower progress in SSP3 and higher progress in SSP5, compared to SSP2. Land policies, which increase the sustainable output of biomass resources, will affect SDG progress; GHG emissions related to the uptake and use of biomass resources decrease significantly as a result of such land policies. However, the higher availability of low-quality biomass resources also has some delaying effect on progress regarding health and access to cooking energy.
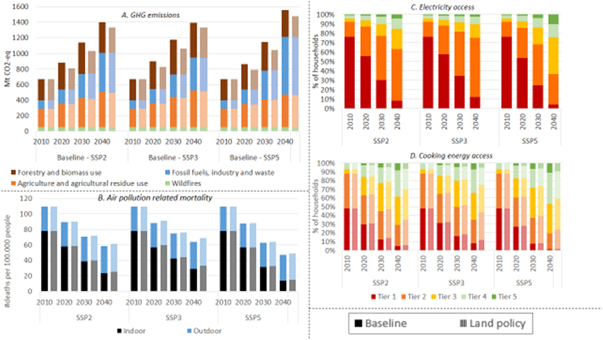
Figure 3. Modelled progress in climate action, health and energy access goals in eastern Africa, for three different SSPs and for a scenario with and without land policy (land policy impact on electricity access is negligible and results have been omitted). See section C1 of the SM for more details behind these results.
Download figure:
Standard image High-resolution image4.2. Cost effectiveness of technology subsidies for SDG progress
Technology subsidies in developing countries have the potential to reduce reliance on traditional biomass and increase energy access through leapfrogging towards more efficient ways to use biomass resources or towards modern energy technologies (Goldemberg 1998). By applying six different pathways of technology subsidies upon both the baseline and land policy scenario, up to 2040, the impact of these subsidies on progress towards each of the three SDGs that we analyse in this study is measured. Figure 4 indicates the relative cost effectiveness of technology subsidy packages (as described in section 3.2), showing synergetic improvement to each of the SDGs for most technology pathways, except for the fuelwood pathway, which shows trade-offs between climate and health objectives and after 2020 also between climate and energy access objectives.

Figure 4. Cost effectiveness of energy technology subsidies in terms of GHG emissions abated, premature mortality avoided and energy access tier improvement per billion USD(2015) invested, for scenarios with and without land policy, by 2020, 2030 and 2040.
Download figure:
Standard image High-resolution imageWe observe that subsidies for biogas systems are the most cost-effective for each of the indicators, scenarios and years: depending on the subsidy level and the socioeconomic pathway, subsidies for biogas systems avoid one air pollution-related death for every 20 000–50 000 USD invested, while GHG abatement of such subsidies translate to a carbon price of 17–50 USD per ton of CO2-equivalent17 , which is in line with real-world observations of biogas implementation programs in southern China (Gosens et al 2013, Hou et al 2017)18 . In contrast, subsidies for fuelwood pathways are only reasonably cost-effective for reducing GHG emissions in the short term (2020), with the condition that subsidies are tied to land policies. Subsidies for charcoal pathways are more cost-effective and, if tied to land policies, they are both effective and robust for mitigating climate change19 . LPG and ethanol subsidies are reasonably cost effective for each of the three objectives, while subsidies for solar PV are effective for improving energy access in the short term, but long-term effects depend strongly on the development pathway (i.e. with higher development, PV subsidies contribute relatively less to energy access improvement). Throughout all scenarios, we see that the impact of socioeconomic pathways cause technology subsidy impacts to become more uncertain over time. See section C2 in the SM for more detailed results.
4.3. Pareto-optimal and SSP robust technology subsidy portfolios
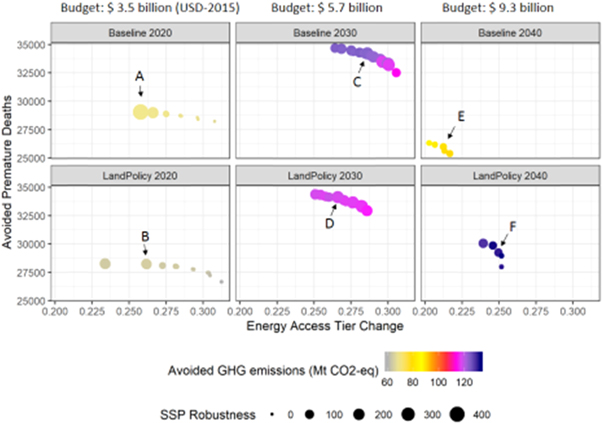
Subsidies for each of the technology pathways in this study contribute to at least one of the SDGs analysed in this study, and most technologies contribute to all three SDGs simultaneously (figure 4). However, depending on the scenario and the point in time, some technology pathways are more cost-effective than others for a specific SDG (and some result in negative outcomes). Therefore, we identify technology subsidy portfolios that are both Pareto-optimal in contributing to each of the three SDGs, and at the same time robust over a range of future socioeconomic pathways. Figure 5 shows these portfolios for a baseline and land policy scenario in 2020, 2030 and 2040. For each Pareto curve (i.e. scenario and year), one representative portfolio is selected (and numbered A to F) as relatively robust to SSP uncertainty, and the distribution of subsidies and impacts of these representative portfolios are presented table 1.
Figure 5. Technology subsidy portfolios for a 'low' budget (see section 3.2; see figure C6 in SM for 'high' budget results) that are Pareto-optimal in terms of simultaneously avoiding GHG emissions, premature deaths and improving energy access for baseline and land policy scenarios in 2020, 2030 and 2040. Size of dots illustrates robustness against SSP uncertainty. Results for portfolios identified with A–F are extended in table 1. For an interactive three-dimensional version of this figure, please see the supplementary material ([stacks.iop.org/ERL/14/094001/mmedia]).
Download figure:
Standard image High-resolution image
Table 1. Total impact and contributions per technology for six selected Pareto optimal subsidy portfolios with 'low' budgets.
| GHG emissions | Air pollution related mortality | Energy access tier | |||||||||||||||||||
|---|---|---|---|---|---|---|---|---|---|---|---|---|---|---|---|---|---|---|---|---|---|
| Port-folio (figure 5) | Total Impact Mt CO2-eq | Relative contribution by technology (% of total)a | Total impact th deaths | Relative contribution by technology (% of total)a | Total impact Δtier level | Relative contribution by technology (% of total)a | |||||||||||||||
| L | PV | bg | et | ch | fw | L | PV | bg | et | Ch | fw | L | PV | bg | et | ch | fw | ||||
| A | 69.0 | 33 | 8 | 51 | 5 | 2 | 0+ | 29.0 | 18 | 4 | 75 | 2 | 2 | 0 | 0.256 | 23 | 20 | 52 | 3 | 1 | 0+ |
| B | 64.7 | 31 | 10 | 48 | 5 | 6 | 0+ | 28.3 | 17 | 5 | 73 | 2 | 4 | 0 | 0.261 | 21 | 24 | 50 | 2 | 3 | 0+ |
| C | 123.7 | 13 | 8 | 72 | 7 | 1 | 0 | 34.2 | 9 | 5 | 80 | 5 | 2 | 0 | 0.286 | 12 | 17 | 63 | 7 | 1 | 0 |
| D | 117.9 | 19 | 6 | 69 | 2 | 4 | 0+ | 34.1 | 14 | 3 | 78 | 1 | 4 | 0 | 0.266 | 20 | 13 | 64 | 0 | 3 | 0 |
| E | 89.7 | 32 | 18 | 50 | 0 | 0+ | 0 | 26.0 | 24 | 9 | 67 | 0 | 0 | 0 | 0.213 | 31 | 21 | 48 | 0 | 0 | 0 |
| F | 130.2 | 37 | 14 | 49 | 0+ | 0+ | 0 | 29.3 | 29 | 7 | 63 | 0+ | 0+ | 0 | 0.25 | 37 | 16 | 47 | 0 | 0+ | 0 |
L = LPG, bg = biogas, et = ethanol, ch = charcoal, fw = fuelwood, Mt = million ton, th = thousand. aThese numbers represent relative contributions of each technology to the SDG progress of the total subsidy portfolio. Numbers are rounded to whole percentage levels, and 0+ defines a small positive number before rounding.
We observe that, in the short and medium term, technology subsidy portfolios contribute more to each of the SDGs without a land policy. In terms of GHG emissions, this can be explained by a higher margin for improvement without land policy, i.e. replacing biomass consumption will avoid forest degradation to a larger degree. Since subsidising charcoal is more cost-effective if combined with a land policy (see figure 4), these technologies make up a higher share of the subsidy portfolio in scenarios with land policy, and therefore these portfolios contribute relatively less to health and energy access goals. In the longer term (2040), we observe the opposite: technology subsidies contribute less to SDGs without land policy, as biomass scarcity in this scenario leads to a higher consumption of non-biomass energy sources even without technology subsidies, decreasing the impact of such subsidies. In each portfolio, subsidies for biogas systems contribute most to each of the SDGs, and mostly to progress in terms of health. This can be explained by the relative attractiveness of biogas systems in rural areas, where they will predominantly replace hazardous fuelwood stoves.
These modelling results show that an efficient allocation of a moderate technology subsidy budget of 11–14 dollars per capita per year, consistent with a GCF budget of 30–35 billion dollar, can improve energy access levels by up to 15%, while reducing GHG emissions in the region by over 10% and avoiding around 20% of air pollution-related deaths in the short and medium term. Higher subsidy budgets (see figure C6 in the SM) are relatively less cost-effective, since the most cost-effective solutions (see figure 4) are already included in low subsidy budgets.
5. Discussion
While subsidies to any technology yield the desired outcomes in a modelling exercise, in the real world this can be significantly harder. In the developing country context of eastern Africa, the dominance of traditional biomass and the availability of 'free' fuelwood in combination with social conditions in rural areas make 'leapfrogging' towards modern energy technologies less straightforward than in models, which largely depend on the technical and economic viability of such technologies (Murphy 2001). The relation between land use policies and technology policies is quite important as land use policies lead to increased dependence on biomass at a later stage, which is a type of rebound effect, since the greater availability of biomass effectively makes it easier and cheaper to gather and use biomass. Consequently, the combination of land use policies and technology subsidies needs to be tailored to the context of each country and in some cases also at sub-national level. It is also not necessarily cost-effective to subsidise the costs of a shift to modern energy over a long period: figure 5 shows that technological solutions become costlier and thus less effective in the longer term.
More detailed analysis at sub-national level and in some cases at local or district level could reveal significant differences in patterns of demand and supply, related to differences in income, biomass scarcity and other factors. Policies supporting sustainable land use, for example, might target those areas where higher productivity could support non-consumptive forest uses (recreation, tourism, various ecosystem services) while areas that are more prone to exploitation might instead support more effort on technology subsidies. The success of policies subsidising biogas installations depends also on local conditions, such as water availability and livestock ownership. In other words, policies and institutions may need to be more local and less national in their application. Designing such policies, however, requires a more disaggregated analysis than can be provided through this approach, as has been done through the MOFUSS model (Ghilardi et al 2016). In the meantime, those technologies that are cost-effective and robust across different scenarios, such as biogas, may warrant additional support beyond subsidies to ensure sustained use: e.g. creating robust maintenance facilities, training technicians, ensuring access to spare parts, etc (Rupf et al 2015, Clemens et al 2018).
Looking at the measures included in the (intended) National Determined Contributions of the region20 , essentially all mention land policy measures in one way or another, since land use is now widely recognised as a critical factor in meeting climate goals. Demand-side measures are not as prominent but, in many cases, also included. What few countries have done is to explore the interaction between demand-side measures and land use policies, which has been addressed in this paper, at least to some first approximation for the region as a whole. Consequently, the results suggest a need for more investigation of these interactions, and greater disaggregation in models and data. Coupling more detailed data on biomass extraction that reveals hotspots (Bailis et al 2015) with forward-looking demand studies could inform the Nationally Determined Contributions and identify feasible solutions that occupy a more manageable policy space.
The identification of robust policies is crucial in the context of developing countries, as future development pathways are very uncertain, but can have crucial implications for the effectiveness of long-term policies. In this study, we tried to account for this uncertainty by connecting integrated assessment and portfolio analysis with robustness analysis. Although the combination of these methods, allowing for policy optimisation over different objectives, has been pre-tested in a different setting (Forouli et al 2019b), the use of different SSPs as a form of deterministic uncertainty has been a novel approach that suits the purpose of this study, but yet has to be proven in future work. Alternatively, optimal subsidy portfolios could be identified separately for each SSP, robust to stochastic uncertainty. The same methodology could also be extended to a wider set of SDGs or other potential policy objectives.
6. Conclusions
This study links two methods used to explore potential co-benefit strategies for climate change mitigation, increasing energy access and reducing exposure to air pollution. We used an integrated assessment model to reflect as best as possible the energy/resource situation in eastern Africa and to simulate the effects of subsidising a selection of technologies, as well as a robust portfolio analysis to find optimal portfolios of subsidies to identify trade-offs in progress across three SDGs, by reducing GHG emissions, reducing exposure to air pollution and increasing energy access until 2040. The portfolio analysis systematically integrates the GCAM model results into a portfolio generation model, while also treating stochastic uncertainty related to socioeconomic development pathways in eastern Africa.
The results give an indication of how effective land policies and technology subsidies are in simultaneously mitigating climate change, reducing exposure to air pollution, and increasing energy access, and which combinations of policies are most successful in doing so. The analysis shows that biogas technologies should be prioritised and subsidised in both the short and long term, showing very high cost-effectiveness for progress across all three SDGs. Subsidies for most other energy technologies focused on in this study are also relatively cost-effective in the short-to-medium term, and the distribution of a certain subsidy budget over LPG (health and energy access), PV (energy access), ethanol (GHG emissions and health) and charcoal (GHG emissions; if linked to land policies) pathways would depend on the preferred SDG in the policymakers' point of view. Subsidies for fuelwood pathways are less cost-effective, even if linked to land policies to guarantee the sustainable production of biomass inputs. Land policies alone can avoid up to 10% of total GHG emissions in the region in the near term, while having a somewhat delaying effect for progress regarding health and energy access goals. Optimally allocated technology subsidies of around 11–14 dollars per capita in the short-to-medium term have the potential to avoid another 10% of GHG emissions, while avoiding around 20% of deaths by reducing exposure to air pollution, and improving energy access by up to 15%. Both land and technology subsidy policies become relatively less effective and more uncertain in the longer term. Thus there are trade-offs across these goals and the respective SDGs, which need to be better analysed and researched in order to guide policies and finance programs, such as those of the GCF.
We have modelled future scenarios in eastern Africa as realistically as possible with current models, by taking into account specific rural and urban differences in terms of energy demand (Yu et al 2014), a dynamic representation of biomass sustainability based on supply and demand (Bailis et al 2015), and a quality-based (instead of binary) definition of energy access (Nerini et al 2015, Bhatia et al 2015), as well as carefully taken assumptions based on published research (see section A1 in the SM). However, as with most top-down modelling approaches (Doukas and Nikas 2019), we are aware that there are limitations to the approach followed in this study. For example, we implicitly assume that the implementation of both land and technology subsidy policies are always successful, while literature shows for example that there are many possible barriers for such policies (Puzzolo et al 2016). We also miss spatial dynamics in modelling biomass sustainability (Ghilardi et al 2016), and therefore probably underestimate forest degradation in areas with relatively high demand and overestimate it in areas with low demand for biomass resources. Despite these shortcomings, we would argue that the global findings of this study as well as the innovative methodology used, which is aligned with emerging scientific paradigms (Doukas et al 2018), will be of interest for a range of local and global policymakers in the context of sustainable development and climate finance.
Acknowledgments
The authors thank Francesco Dalla Longa for his comments, and Brennan Bowman and Sebastien Huclin for their help with regard to data and methodology. This research is supported by the European Union's Horizon 2020 research and innovation program under Grant Agreements No. 642260 (TRANSrisk project) and No. 820846 (Paris Reinforce), and by the Spanish Ministry of Economy and Competitiveness MINECO through BC3 María de Maeztu excellence accreditation MDM-2017–0714. Dirk-Jan van de Ven and Jon Sampedro acknowledge financial support from the Ministry of the Economy and Competitiveness of Spain (ECO2015-68023). Jon Sampedro also acknowledges financial support from the Basque Government (PRE_2018_2_0076). Sha Yu was supported by the Global Technology Strategy Project (GTSP). The views and opinions expressed in this paper are those of the authors alone.
Data availability statement
The data that support the findings of this study are available from the corresponding author upon reasonable request. The data are not publicly available for legal and/or ethical reasons.
Footnotes
- 5
- 6
The description of 'eastern Africa' in this study is linked to the region as defined in GCAM, the model used in the core of this study. It includes the following countries: Burundi, Comoros, Djibouti, Eritrea, Ethiopia, Kenya, Madagascar, Rwanda, Somalia, Sudan, South-Sudan and Uganda. See figure 1 for a geographical perspective.
- 7
- 8
- 9
Further information (e.g. location) would be required in order to estimate deaths, so results are approximate and should not be interpreted in an absolute way. Anyway, for the optimisation process, it is a valuable proxy.
- 10
These SSPs were selected to include the widest range of possible scenarios, where SSP3 is seen as a lower extreme and SSP5 as a higher extreme to economic development. SSP projections were used for: population, income, urbanisation, supply and demand for both energy and agricultural commodities and emission factors.
- 11
This means that, by 2030, land owners are indifferent between applying and not applying these methods and are driven by profit maximisation. As such programs are assumed to take time, the program is assumed to be 33% effective by 2020 and 66% effective by 2025.
- 12
We have modelled subsidies for technology pathways instead of individual stoves to avoid stove stacking, which undermines the cost effectiveness of financial support and is more challenging to model.
- 13
For all pathways, the subsidies cover all capital costs. Capital costs for fuels are calculated as the difference between the final consumer price and the price of required production inputs (for LPG, the price of crude oil is taken as the 'input' price). Implicitly, subsidy policies for LPG and Ethanol will be rationed to avoid subsidised fuels to be used for transport.
- 14
With 46% of current projects being directed to Africa (https://greenclimate.fund/what-we-do/portfolio-dashboard), this would translate to 12.5–14.5 billion USD being directed to Africa, of which 3.5 billion USD could potentially be focused on eastern Africa which represents about a quarter of the African population. This number increases over time due to higher potential GCF budget and slower projected economic development of SSA compared to other developing regions up to 2040 (Leimbach et al 2017), potentially increasing the GCF share for SSA.
- 15
As formally agreed at the G7 summit in June 2015: https://greenclimate.fund/how-we-work/resource-mobilization.
- 16
We are not focusing on scenarios beyond 2040 as the high rate of development in eastern Africa causes large uncertainty in possible outcomes, making policy analysis less meaningful.
- 17
Note that the maximum impact of each technology subsidy package is limited, even if they are 100% subsidised. These limits are most clear for ethanol, charcoal and biogas pathways, due to biophysical limits to the availability or sustainability of the main inputs for these technologies (sugarcane/molasses, fuelwood and animal manure for ethanol, charcoal and biogas respectively). See section C2 of the SM for a better overview of the potential impact range for each technology.
- 18
Calculated by dividing observed annual GHG emission savings by $117, representing the assumed costs of a biogas digester of $932 (see Table A1 in SM) multiplied by an annual discount rate of 13%. Note that the actual costs of the Chinese implementation program would depend on more policy-specific factors.
- 19
The cost effectiveness of non-biogas pathways is hard to compare with other estimates in literature, as most estimates focus on subsidies for cooking stoves only. Subsidies for stoves plus energy inputs, as is the case in this study, normally translate to lower cost effectiveness (Cameron et al 2016).
- 20
https://www4.unfccc.int/sites/submissions/indc/Submission%20Pages/submissions.aspx see table C2 in SM for a regional summary.