


Abstract
The long-term relationship between temperature and hydroclimate has remained uncertain due to the short length of instrumental measurements and inconsistent results from climate model simulations. This lack of understanding is particularly critical with regard to projected drought and flood risks. Here we assess warm-season co-variability patterns between temperature and hydroclimate over Europe back to 850 CE using instrumental measurements, tree-ring based reconstructions, and climate model simulations. We find that the temperature–hydroclimate relationship in both the instrumental and reconstructed data turns more positive at lower frequencies, but less so in model simulations, with a dipole emerging between positive (warm and wet) and negative (warm and dry) associations in northern and southern Europe, respectively. Compared to instrumental data, models reveal a more negative co-variability across all timescales, while reconstructions exhibit a more positive co-variability. Despite the observed differences in the temperature–hydroclimate co-variability patterns in instrumental, reconstructed and model simulated data, we find that all data types share relatively similar phase-relationships between temperature and hydroclimate, indicating the common influence of external forcing. The co-variability between temperature and soil moisture in the model simulations is overestimated, implying a possible overestimation of temperature-driven future drought risks.
Export citation and abstract BibTeX RIS

Original content from this work may be used under the terms of the Creative Commons Attribution 3.0 licence. Any further distribution of this work must maintain attribution to the author(s) and the title of the work, journal citation and DOI.
Introduction
Increases in the frequency, duration, and severity of either droughts or floods are expected to accompany global warming in many parts of the world, posing threats to the environment and societies alike (D'Odorico and Bhattachan 2012, Field et al 2014, Schewe et al 2014, van Loon et al 2016, Lehner et al 2017, Orth and Destouni 2018, Trnka et al 2018). However, the development of strategies for long-term climate change mitigation are hampered by inconsistent climate model projections of future hydroclimatic changes at regional scales (Stephens et al 2010, Christensen et al 2013, Orlowsky and Seneviratne 2013, Nasrollahi et al 2015). Increasing evidence suggests that the model-based paradigm of 'wet-gets-wetter and dry-gets-drier' in a warmer world (Trenberth et al 2003, Held and Soden 2006) may be too simplistic (Sheffield et al 2012, Greve et al 2014, Byrne and O'Gorman 2015, Burls and Fedorov 2017). At the same time, evidence for a timescale-dependence of temperature–hydroclimate relationships is emerging (Rehfeld and Laepple 2016), but instrumental observations are too short to derive robust co-variations at longer timescales (Seftigen et al 2017). The elusive key to clarifying these relationships lies in understanding how temperature relates to precipitation, evapotranspiration and drought on multiple spatiotemporal scales. So far, temperature–hydroclimate relationships have been well studied at daily to inter-annual timescales (Trenberth and Shea 2005, Adler et al 2008, Sheffield et al 2012, Dai 2013), to decadal timescales (Briffa et al 2009), but remain poorly constrained at multi-decadal to centennial timescales (PAGES Hydro2k Consortium 2017, Putnam and Broecker 2017). Model simulations tend to underestimate the natural long-term hydroclimatic variability and to overestimate the amplitude of twentieth century changes relative to past variations (Ljungqvist et al 2016).
To reduce current uncertainties, a long-term perspective on the timescale dependencies of temperature–hydroclimate relationships is needed to provide a better benchmark for future hydroclimatic extremes. For example, in North America (Cook et al 1999, 2004, Ault et al 2018, Rodysill et al 2018) and monsoonal Asia (Cook et al 2010, Sinha et al 2011) more severe and persistent droughts have occurred earlier during the past millennium than during the twentieth century or twentieth-first century. In Europe and the Mediterranean Basin, past drought events are less well studied, but have been documented for the central and eastern Mediterranean (Xoplaki et al 2016, 2018), in tree-ring evidence for northwestern Africa (Esper et al 2007), and in the gridded tree-ring based Old World Drought Atlas (OWDA) (Cook et al 2015). Against the millennium-long backdrop of the OWDA, the recent decades appear exceptionally wet in northern and central Europe, and exceptionally dry in southern Europe, thereby amplifying the European hydroclimatic north–south dipole (Markonis et al 2018). The Mediterranean Basin displays timescale-dependent and spatially diverse hydroclimate patterns throughout the past millennium, manifested by an east–west dipole at annual to decadal scales (Xoplaki et al 2004, 2018, Roberts et al 2012, Seim et al 2015, Labuhn et al 2018, Jones et al 2019), which disappears on multi-decadal to centennial timescales (Cook et al 2016). Distinct hydroclimatic dipole patterns in Europe, lasting several years, also follow large volcanic eruptions, with humid conditions in northeastern Europe, and drier conditions in northwestern Europe and parts of the Mediterranean (Fischer et al 2007, Büntgen et al 2017, Gao and Gao 2017, Rao et al 2017, Xoplaki et al 2018, Schurer et al 2019).
For assessing temperature–hydroclimate relationships in the low-frequency domain, long instrumental records in tandem with proxy-based reconstructions and climate model simulations are needed. New, annually resolved, tree-ring based field reconstructions of warm-season temperature (Luterbacher et al 2016) and hydroclimate (Cook et al 2015) allow us to study their time- and space-varying co-variance across Europe at inter-annual to centennial timescales, and to compare them with the relationships obtained by instrumental and climate model data. The temperature–hydroclimate relationships are investigated over: (1) the period 1901–2003 using gridded CRU TS3.25 instrumental data (Harris et al 2014) for temperature and precipitation and the self-calibrating Palmer Drought Severity Index (scPDSI) (van der Schrier et al 2013) with independent validation from early instrumental temperature and precipitation data for 1766–1900 (Casty et al 2007); (2) the period 850–2003 using updated gridded tree-ring-based reconstructions of temperature (Luterbacher et al 2016) and hydroclimate (scPDSI) (Cook et al 2015); and (3) the period 850–2003 using output of temperature, precipitation, and soil moisture from the global climate model simulations CCSM4 (Gent et al 2011, Landrum et al 2013) and MPI-ESM-P (Giorgetta et al 2013). Our combined approach can be used to benchmark reconstructions and simulations, and test model ability to realistically simulate temperature–hydroclimate relationships across all timescales.
Data
For instrumental data, we used interpolated data sets covering the period 1901–2003 from the Climate Research Unit (CRU) TS3.25 (Harris et al 2014) for the summer (June–August) as well as an extended spring–summer (March–August) season. Seasonal June–August and March–August means of temperature and scPDSI (van der Schrier et al 2013) and sums of precipitation were used to analyze the spatiotemporal relationships between climate parameters. The hydroclimatic metric scPDSI (Wells et al 2004) integrates precipitation and temperature-driven evapotranspiration to estimate changes in dryness relative to mean conditions in a given region. In addition, we used long instrumental station data of temperature and precipitation covering for the same two seasons over the period 1766–1900 (Casty et al 2007) for independent validation. The latter data set integrates 159 temperature and 149 precipitation station records with at least 100 years of observations extrapolated on a 5° × 5° grid (supplementary online material, SOM is available online at stacks.iop.org/ERL/14/084015/mmedia). For assessing the long-term spatiotemporal relationship of warm-season temperature and hydroclimate we updated both the European temperature reconstruction of Luterbacher et al (2016) and the OWDA scPDSI reconstruction (Cook et al 2015) over the period 850–2003. Both reconstructions are calibrated to summer (June–August) mean temperature and scPDSI, respectively, but can, with similar skill, be calibrated to a longer spring–summer (March–August) season (SOM). The update aims to ensure that the two reconstructions do not share any underlying data, and that they both extend to 2003. The OWDA is solely tree-ring based, providing gridded annual reconstructions of June–August scPDSI, reflecting soil moisture conditions at 5414 points on a 0.5° × 0.5° grid. We extended the OWDA, originally ending in 1978, to 2003 and removed the four tree-ring predictors in common with the temperature reconstruction (Luterbacher et al 2016) to facilitate an unbiased comparison (SOM). In the updated temperature reconstruction nine tree-ring records and documentary data (table S1, SOM) were combined and extrapolated on a 5° × 5° grid over Europe (35°–70 °N, 10° W–40 °E).
A comparatively high spatial resolution is required to skillfully simulate hydroclimate variations in space, especially in areas with highly complex relief (PAGES Hydro2k Consortium 2017, Xoplaki et al 2018). Therefore, we only used the two forced CMIP5 models (Taylor et al 2012) with at least a spatial resolution of 2° × 2°: the CCSM4 (Gent et al 2011, Landrum et al 2013) and the MPI-ESM-P (henceforth MPI) (Giorgetta et al 2013) 'last millennium' and 'historical' model runs (for further information, see SOM). An additional advantage of these particular model runs is that the very same model version was used for simulating the 'last millennium' (850–1849) and the 'historical' periods (1850–2005), with the 'historical' run continued from the conditions simulated for the 'last millennium'. CCSM4 and MPI are the exception in terms of having the same grid resolution over the 'historical' and 'last millennium' periods and continuation of simulations between the two periods, this is not the case for the rest of the CMIP5 simulations (Taylor et al 2012). In this study only the models' temperature, precipitation, and soil moisture variables are considered. Several studies have assessed the relationship between soil moisture and PDSI/scPDSI (Dai 2011, Cook et al 2014, 2015, Zhao and Dai 2015), finding strong correlations between the two variables (Seneviratne et al 2012, Marvel et al 2019). Thus, we use simulated soil moisture anomalies, integrated over all soil layers that are hydrologically active in each of the models, as a surrogate for scPDSI (SOM). However, we recognize that soil moisture and scPDSI are not fully interchangeable variables (Lehner et al 2017), and that they may behave differently under strong climatic forcing (Berg et al 2017), which is likely of minor importance for the past millennium (Hessl et al 2018).
Methods
The spatial resolution of the instrumental data, the updated hydroclimate reconstruction, and the model simulations were re-gridded to a coarser but common 5° × 5° grid both to ensure consistency with the updated temperature reconstruction and to avoid the influence of local-scale noise. For the re-gridding, each grid-cell was centered at its nominal grid-cell coordinates and the grid-cell limits were defined as mid-way between neighboring grid-cell centers. The value at each grid-cell, e.g. scPDSI, represents the average value of that grid-cell: re-gridding to a coarser grid was performed by simply averaging the values at all grid-cells of the finer grids that lie within a particular grid-cell of the coarser grid. A Fourier transformation was applied to obtain high- and low-pass filtered timeseries, retaining frequencies either more than or less than 20 years. For decadally and centennially filtered timeseries, we employed a box-car filter averaging data over 10 and 100 years, respectively (see SOM for further details).
For assessing the sign and strength of temperature–hydroclimate relationships, at different timescales, we calculated the Pearson correlation coefficient between temperature and hydroclimate variables at a 5° × 5° grid-cell level. The 95% significant level, the significance level used exclusively throughout the study, was estimated considering the autocorrelation in the series to obtain effective sample sizes (von Storch and Zwiers 1999) and account for the loss of degrees of freedom due to smoothing. To explain the variance in instrumental scPDSI, tree-ring reconstructed scPDSI, and model soil moisture in different seasons we calculated beta (ß) values over the period 1901–2003 applying multiple regression solutions using two predictors (instrumental CRU TS3.25 temperature and precipitation). The standardized regression coefficients (ß) illustrate how much, where, and in which direction (±) the contribution of each predictor varies. We applied the multitaper method of spectral analysis (Mann and Lees 1996) to identify major periodicities and the cross-wavelet method (Torrence and Compo 1998) to determine common power and relative phases between temperature and hydroclimate. In both tests, a 95% confidence level against a red noise background is used (see supplementary methods, SOM). The spectral and cross-wavelet analyses cannot be conducted on spatially resolved data so we calculated arithmetic means of the grid-cells for three key regions: North-Central Europe (45–60° N, 5–20° E), Western Mediterranean (35–45° N, 10° W–5° E), and Eastern Mediterranean (35–45° N, 20–35° E) (see figure S1, SOM).
Results
The instrumental period
We find significant negative correlations between 20 year high-passed filtered summer (June–August) instrumental temperature and scPDSI data over Europe for the period 1901–2003 (figures 1; S2, SOM). A similar negative relationship is observed between high-pass filtered instrumental June–August temperature and precipitation (figures 1, S3, SOM) as well as between March–August temperature and scPDSI or precipitation (figures 1, S4–5, SOM). However, at decadal timescales significant positive correlations are found between June–August, and especially March–August, temperatures and scPDSI (and stronger for precipitation) over northern Europe. Over central and southern Europe significant negative correlations are still found between the same variables at decadal timescales (figure 1). The distribution of correlation values for all grid-cells is similar in the early instrumental data (1766–1900) (Casty et al 2007), whereas the spatial correlation patterns differ, possibly due to higher uncertainties in the early measurements (figure S5, SOM).
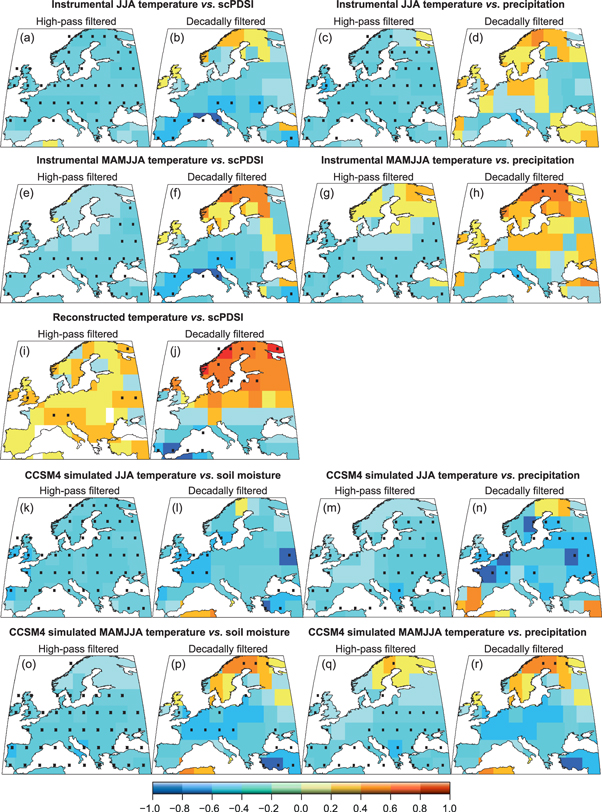
Figure 1. Correlations between 20 year high-pass and decadally filtered instrumental, reconstructed or simulated temperature and hydroclimate over 1901–2003. For instrumental data and simulations both summer (June–August, JJA) and spring-summer (March–August, MAMJJA) season are shown. Grid-cells containing black squares mark significant (p < 0.05) correlations.
Download figure:
Standard image High-resolution imageOverall, the 20 year high-pass filtered temperature and hydroclimate reconstructions show more positive, but mostly insignificant, correlations across Europe compared to instrumental data over the period 1901–2003 (figure 1). At decadal timescales, a more distinct European dipole pattern between a warm and wet northern Europe (above ∼50° N) and a warm and dry southern Europe (below ∼50° N) emerges (figure 1) in the reconstructed data. In the CCSM4 model simulation, the soil moisture and precipitation correlations with temperature at decadal timescales reveal similar spatial correlation patterns as in the instrumental data for both the June–August and March–August seasons (figure 1). However, in the simulations, particularly in the MPI model, the temperature–hydroclimate relationship is stronger and more negative than in the instrumental data (figures S2–5, SOM). In summary, compared to instrumental data, the reconstructions also show a positive temperature–hydroclimate relationship, especially at high frequencies, while the model simulations also show a negative relationship as well as too small co-variability changes towards lower frequencies. We note that the reconstructed co-variance is more similar to the instrumental co-variance for March–August than for June–August. Moreover, instrumental and simulated temperature–precipitation co-variances are more similar to the reconstructed temperature–scPDSI co-variances than the co-variances of instrumental temperature–scPDSI or the co-variances of simulated temperature–soil moisture (figure 1).
The full period (850–2003)
When comparing tree-ring based reconstructions and climate model simulations over the full 850–2003 period, substantial differences in the temperature–hydroclimate covariance structures are found (figure 2). In the reconstructions, significant positive correlations between 20 year high-pass filtered temperature and scPDSI are restricted to northern Europe (figure 2). However, at decadal timescales significant positive correlations are found across much of northern and central Europe, and at centennial timescales this even include parts of the Mediterranean (figures 2, S6, SOM). Consistent with the results over the 1901–2003 instrumental period, simulated 20 year high-pass filtered temperature and hydroclimate show significant negative correlations across all or most of Europe in the CCSM4 model simulation (figure 2) and especially in the MPI model simulation (figures S6 and 7, SOM). However, at decadal to centennial timescales, the correlations turn positive over northwestern Europe in the CCSM4 model but not in the MPI model. Yet for centennially filtered June–August data in the CCSM4 model eleven grid-cells show significant positive temperature–soil moisture correlations over Scandinavia (figure 2). The modeled co-variance is generally more positive for the longer March–August season than for the June–August season (figures S8 and 9, SOM).
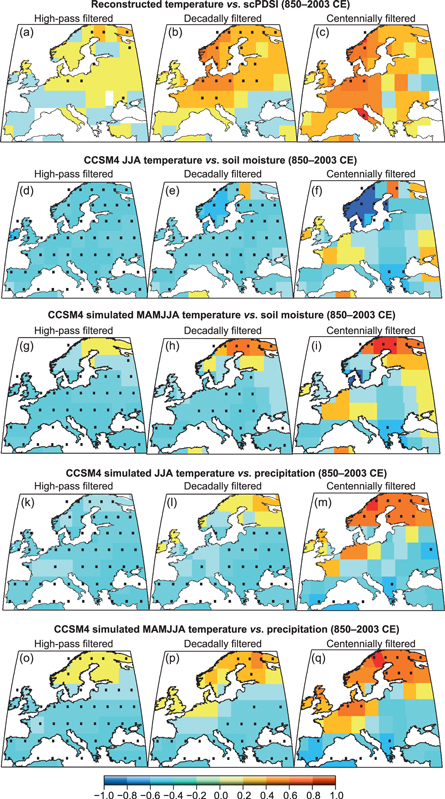
Figure 2. Correlations between 20 year high-pass and decadally filtered reconstructed or simulated temperature and hydroclimate over 850–2003. For simulations both summer (June–August, JJA) and spring-summer (March–August, MAMJJA) season are shown. Grid-cells containing black squares mark significant (p < 0.05) correlations.
Download figure:
Standard image High-resolution imageComparing the distribution of correlations of 20 year high-pass filtered grid-cell values, we find that the correlations of the reconstructions are more positive and less dispersed than those of the model-simulated data (figure 3). At decadal scales, the spread of both reconstructed and simulated correlations increases. Strong negative correlations between MPI simulated temperature and soil moisture stand out for 20 year high-pass filtered data. The mean twentieth century relationship between temperature and hydroclimate, and the distribution of correlations, are similar to those of earlier centuries for both the 20 year high-pass and the decadally filtered reconstructions and simulations alike. Individual sub-periods and the full period reveal similar spatial correlation patterns; however, the inter-centennial (e.g. the Medieval Climate Anomaly versus the Little Ice Age) differences in the reconstructions are larger than in the simulations (figures S10 and 11, SOM). This may be a result of a general underestimation of pre-industrial low-frequency Northern Hemisphere temperature variability in climate model simulations (e.g. Fernández-Donado et al 2013, Ljungqvist et al 2019). We note that external (e.g. volcanic, solar, and orbital) climate forcing is necessary for a model-simulated north–south dipole pattern. In contrast to the forced CCSM4 simulation, experiments with the unforced 1300 year long CCSM4 control simulation do not produce any significant temperature–hydroclimate co-variability using 20 year high-pass filtered data, while at decadal time-scales the control simulation only produces negative correlations across almost all of Europe (figure S12, SOM).
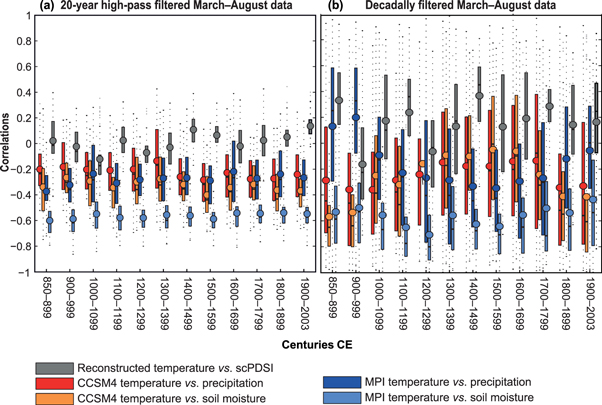
Figure 3. Boxplots showing the spread of correlation values from the individual 5° × 5° grid-cells between 20 year high-pass and decadally filtered reconstructed/simulated temperature and hydroclimate over each century for the March–August season. The mean (round circles), median (small blank horizontal bar), the quartile range (length of the bars), and two standard deviation intervals (light gray dots) are shown.
Download figure:
Standard image High-resolution imageReconstructions, simulations and instrumental data show similar spectral peaks and periodicities in temperature and hydroclimate across regions despite the different co-variance structures (tables S2–6, SOM). The multi-taper analysis of reconstructed temperature and scPDSI, as well as of simulated temperature, soil moisture and precipitation over three sub-regions—North-Central Europe, Eastern Mediterranean, and Western Mediterranean—reveal significant spectral peaks at inter-annual frequencies (∼4 years) for all regions. The significant decadal (∼8–16 years) peaks in temperature and hydroclimate data found in the simulations (especially for the MPI model) are not observed in reconstructions and instrumental data. Cross-wavelet analysis between reconstructed temperature and scPDSI over North-Central Europe, reveals in-phase coherencies at multi-decadal (∼32–64 year) frequencies and centennial (∼128 year) frequencies. However, out-of-phase coherencies between temperature and hydroclimate at these timescales are found in simulations. In the Eastern Mediterranean, the reconstructions show out-of-phase relationships between temperature and scPDSI at multi-decadal (especially ∼64 years) frequencies. Similar out-of-phase relationships are found in the simulations at decadal (∼8–16 year) and multidecadal to centennial (∼64–128 year) timescales. Reconstructed temperature and scPDSI over the Western Mediterranean reveal some in-phase temperature-hydroclimate relationships at multi-decadal timescales (∼32 and ∼64 years). However, the significant coherencies between temperature and hydroclimate in the simulations over the same regions are found to be all out-of-phase, in addition to an out-of-phase relationship at centennial (∼128 year) frequencies not present in the reconstructions. Reconstructed and simulated temperatures and scPDSI/soil moisture from the Eastern and the Western Mediterranean have a rather similar in-phase relationship across timescales.
Discussion
Limitations in estimating hydroclimate variability from tree-ring based reconstructions
Even though the tree-ring based temperature and scPDSI estimates contain noise that varies in both space and time, both field reconstructions possess sufficient skill for being useful in climatological and historical analyses for at least the past millennium. The spatially heterogeneous reconstruction skill is, however, introducing biases at sub-regional scales in different parts of Europe, complicating the study of the associated relationship between temperature and hydroclimate. Moreover, a stable linear relationship cannot be expected between tree growth and temperature or hydroclimate over time, particularly in semi-arid regions (Büntgen et al 2013, Liu et al 2013, Galván et al 2014, Seim et al 2016, Xoplaki et al 2016, 2018), or over seasons (Wilmking et al 2004), and across timescales (Schultz et al 2015, Babst et al 2019). The biological memory of climate conditions from the previous year(s), affecting the annual increments of tree growth, can potentially lead to an overestimation of low-frequency signals if not treated properly (Esper et al 2015).
Although the OWDA hydroclimate reconstruction allows for a highly skillful assessment of past drought variability in time and space (Cook et al 2016, Markonis et al 2018, Marvel et al 2019), it may still contain biases affecting the assessed co-variance with (reconstructed) temperature variability. The observed positive deviation (relative to instrumental data) in the tree-ring reconstructed temperature–hydroclimate relationship is likely the result of tree growth being influenced by both temperature and precipitation (Babst et al 2013, 2019, Seftigen et al 2017, Klesse et al 2018), and thus reflecting the combined and complex influence of both variables in a mixed frequency spectrum (Bunde et al 2013). Furthermore, while most of the OWDA tree-ring network is sensitive to soil moisture conditions, some chronologies stem from moist and cold high-elevation (e.g. the Alps) or high-latitude sites (e.g. northern Scandinavia) with positive correlations to temperature (Babst et al 2013, St. George 2014). Those warm-season temperature-sensitive tree-ring chronologies, however, are used to indirectly infer soil moisture availability via its inverse relationship to clear skies and thus high temperatures and reduced precipitation (Cook et al 2015). Moreover, when using scPDSI as a predictor, the use of a large (>800 km) and often dynamically expanding search radius may then utilize such temperature-sensitive tree-ring records over a large part of the reconstruction domain. In addition, temperature has a greater spatial correlation length than precipitation (Büntgen et al 2010, Ljungqvist et al 2016), so that temperature-sensitive chronologies can influence results across greater distances than precipitation-sensitive chronologies. These reasons may explain some of the overestimation of temperature sensitivity in the hydroclimate reconstruction, and the difference between correlations derived from reconstructions, simulations and instrumental data.
These uncertainties are at present challenging to address as no other proxy archive provides such highly resolved temporal and spatial reconstructions needed for robust cross-proxy validation over the full past millennium (SOM). Historical documentary data is one potentially promising source of independent validation of the temperature–hydroclimate relationship obtained from tree-ring based reconstructions (Brázdil et al 2018). However, the possibility to use documentary data for this purpose is limited by the current distribution, in both space and time, of regionally 'paired' temperature and hydroclimate records, their season of recording, and often by their inability to capture low-frequency variability and trend (Pfister 2018, Pfister et al 2018). The dating accuracy and temporal resolution of limnological records are still insufficient (Luoto and Nevalainen 2018) for direct comparison with tree-ring based reconstructions except at centennial timescales, whereas stalagmite records are inherently limited in providing quantitative reconstructions of warm-season temperature and warm-season hydroclimate (Lachniet 2009, Fohlmeister et al 2012). However, over European Russia—a region with one of the sparsest data coverage in our reconstructions—we can from independent palaeoclimate sources confirm a positive decadal-scale temperature–hydroclimate relationship similar to that found elsewhere over Europe, at corresponding latitudes, for the past millennium (SOM).
The relative influence of temperature and precipitation on scPDSI/soil moisture has been estimated by multiple linear regression analyses for unfiltered instrumental, reconstructed and simulated data over the period 1901–2003 (figure 4). We find that, in comparison to temperature, precipitation has a dominating influence on instrumental scPDSI, but is less important to model-simulated soil moisture or tree-ring reconstructed scPDSI. In the reconstructed scPDSI, precipitation's contribution is stronger if the longer seasonal window March–August is used instead of the shorter seasonal window June–August, while the contribution of temperature is similar in both seasons. More importantly, while both the models and the hydroclimate reconstruction underestimate the contribution of precipitation to scPDSI/soil moisture, the reconstruction actually also reveals a positive, instead of negative, association with temperature over northern and central Europe. This is a clear indication of the commanding influence of temperature in the tree-ring based scPDSI reconstruction. A similar analysis, using squared partial correlations (Beak et al 2017), and not including models, reveals that the contribution of precipitation to the tree-ring based scPDSI is less consequential than its contribution to the instrumental data, supporting our conclusion that temperature is the principal driver of tree-ring reconstructed hydroclimate variability at decadal to centennial timescales.
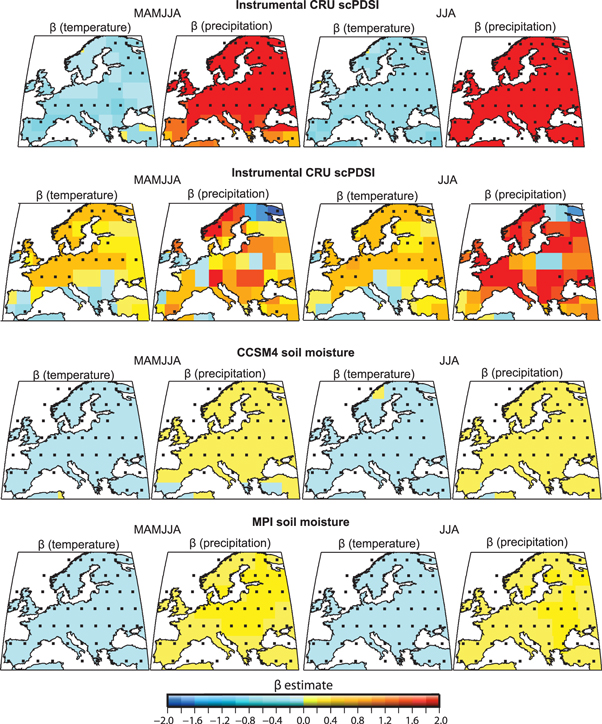
Figure 4. Results from multiple regression experiments on unfiltered data for March–August (the two left columns) and June–August (the two right columns) over 1901–2003 using instrumental CRU temperature and precipitation, to explain the variability in instrumental scPDSI, reconstructed scPDSI, CCSM4 simulated soil moisture, and MPI simulated soil moisture. The sign (±), location, and strength of the relationship, expressed as the standardized regression coefficients (ß), are shown. Grid-cells containing solid black squares mark significant (p < 0.05) beta values.
Download figure:
Standard image High-resolution imageRecent soil moisture reductions, driven by precipitation deficits, have been found to yield evapotranspiration deficits—associated with negative vegetation impacts—only in the drier climate of southern Europe, whereas evapotranspiration and vegetation remain largely unaffected in the relatively moist climates of central and northern Europe. North of the Mediterranean Basin, reduced precipitation can even have a positive effect on vegetation as it is typically associated with increased radiation (Orth and Destouni 2018). This implies that tree-ring based reconstructions may not capture the full amplitude of drought over parts of Europe, and as such contribute to a positive bias in the relationship assessed from comparing temperature and hydroclimate reconstructions. Finally, part of the apparent mismatch between reconstructions and instrumental (and model) data seems to be related to seasonality. The reconstructions are calibrated to the June–August season but show a temperature–hydroclimate relationship more akin to that found for the March–August season in instrumental data; to some extent the differences between reconstructions and simulations decrease when using the longer season. Moreover, the agreement between reconstructions and instrumental data, as well as model simulations, improves when considering precipitation as the hydroclimate variable instead of scPDSI or soil moisture—despite the fact that the hydroclimate reconstruction is calibrated to scPDSI. In the model world, this may be a result of an overestimation of the effects of temperature, especially in summer, relative to precipitation on soil moisture, or alternatively an underestimation of the effect of precipitation on soil moisture.
Mechanistic explanations for model simulation limitations
The positive temperature–hydroclimate relationship in northern Europe and negative temperature–hydroclimate relationship in southern Europe at lower frequencies are presumably related to the link between large-scale temperature variability and the intensity of the regional hydrological cycle (Trenberth et al 2003). The mechanistic explanation for such a behavior is that higher temperatures intensify the hydrological cycle (Prein and Pendergrass 2019), and increase precipitation at the same time as amplifying net evaporation (Kirby 2016). Regions that are already relatively wet (e.g. northern Europe) will receive more precipitation while, conversely, regions that are already relatively dry (e.g. southern Europe) will become drier both as a result of increased evaporation from higher temperatures, a general expansion of the sub-tropical dry zones, and an intensification of high pressure areas (= low precipitation) (Zhang et al 2007, Trenberth 2011, Trenberth et al 2014, Marvel et al 2019).
Different mechanisms govern the temperature–hydroclimate relationship over different timescales. Across all regions the most common occurrence of precipitation deficits (dry conditions) at intra- and inter-annual timescales coincides with net radiation surpluses (warm conditions) (Orth and Destouni 2018), explaining the generally more negative (i.e. warm and dry) temperature–hydroclimate co-variability found at higher frequencies. In the low-frequency domain, however, temperature and precipitation variations represent changing trends in long-term average climate conditions (e.g. see Xoplaki et al 2018 for the central and eastern Mediterranean). This allows us to apply the widely used space-for-time substitution approach—successfully tested for climate change effects on ecological systems (Blois et al 2013)—that maintains that long-term change trajectories can be inferred from contemporary spatial patterns. The global temperature–hydroclimate co-variability patterns mainly imply warmer and wetter conditions around the Equator, and colder and drier (in terms of lower annual precipitation) conditions at high latitudes. Based on space-for-time substitution, a more positive co-variability than at higher frequencies should thus be expected from long-term temperature and precipitation averages, as seen in our study. The negative low-frequency temperature–hydroclimate relationship in southern Europe may reflect overall long-term water limitation in this region (Orth and Destouni 2018). This state does not allow regional evapotranspiration–precipitation feedbacks to increase under long-term warming in contrast to the overall long-term temperature limitation in northern Europe (Orth and Destouni 2018) where long-term warming can lead to increased evapotranspiration–precipitation feedbacks and a positive long-term regional temperature–precipitation co-variability.
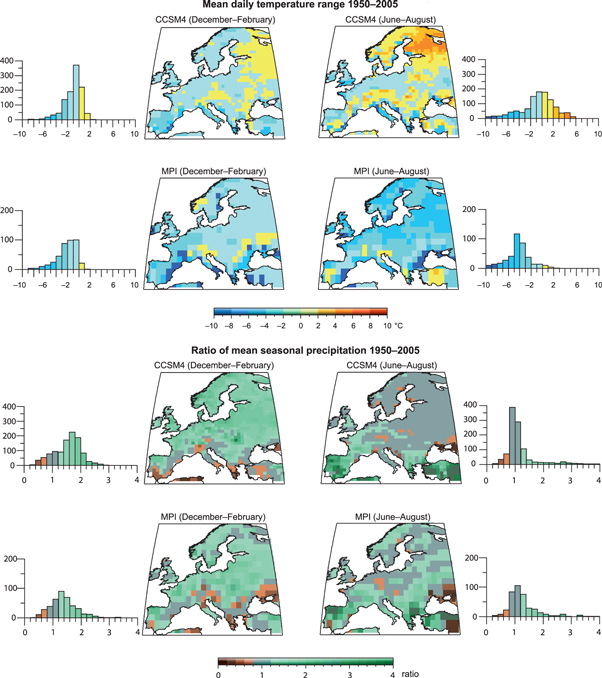
As already noted, climate models have biases in their representation of hydroclimate and contain errors of different magnitudes and directions when evaluated against observations for different variables and regions (Hagemann et al 2013, Bring et al 2015, Ficklin et al 2016, Xoplaki et al 2016, 2018). Previous studies have found considerably better regional agreement between climate models and temperature than for hydroclimate (Stephens et al 2010, Woldemeskel 2012, Christensen et al 2013, Flato et al 2013, Orlowsky and Seneviratne 2013, Nasrollahi et al 2015, Asokan et al 2016). They have also found a particular climate model bias in high latitude hydroclimate (Bring and Destouni 2014). One reason why the models show too strong a negative temperature–hydroclimate relationship—and too weak a dependency with timescale—may be related to limitations of simulating clouds and clouds' effects on surface radiation and precipitation. Cloud cover simulations still contain large biases across all state-of-the-art model ensembles (Flato et al 2013), which are model, region and season dependent. At annual timescales, the ensembles tend to produce too weak cloud-radiative effects over western Europe compared to satellite observations. We have compared the modern (1950–2005) precipitation climatology and daily temperature range (a proxy for cloud cover) for December–February and June–August in the CCSM4 and MPI simulations (figure 5). MPI overestimates precipitation over north-central Europe in both seasons (December–February and June–August), and particularly in summer, whereas CCSM4 simulates more realistic summer than winter precipitation. The overestimation of precipitation reflects an underestimation of the daily temperature range in winter for both models, and also in summer, especially for the MPI model. The overestimation of winter precipitation, influencing summer soil moisture conditions, likely reduces the probability of simulated droughts.
Figure 5. Bias of the climate simulations with the two models MPI and CCSM4 relative to the reference observational data set E-OBS (Haylock et al 2008) over the period 1950–2005 in the winter (December–February) and summer (June–August) season. The upper panels show the mean difference between simulated and observed daily temperature range (Tmax minus Tmin in °C). The bottom panels show the ratio between simulated and observed mean seasonal precipitation. A ratio of 1 (values from –0.8 to 1.2 are marked in gray) indicates a perfect agreement between observations and simulations. Each histogram shows the relative frequency of grid-cell values displayed on the corresponding map.
Download figure:
Standard image High-resolution image
Moreover, the models simulate summer conditions that are too dry over much of southern Europe (Moberg and Jones 2004). A plausible explanation is that the simulated soil profiles dry out too quickly, leaving little moisture for evapotranspiration, while elevated groundwater tables after winter and spring precipitation, and a greater variation in soil types and vegetation, exist in the real world and maintain relatively high soil moisture levels that feed into vegetation and its transpiration (Destouni and Verrot 2014, Verrot and Destouni 2016). As a consequence, simulated temperatures increase too rapidly relative to observed ones, and the differences between simulated and real-world temperature–hydroclimate relationships in southern, and presumably also central, Europe may be partly driven by biased vegetation feedbacks. The latter bias may in turn depend on soil moisture–groundwater level relationships (Destouni and Verrot 2014) that are not sufficiently captured by the shallow soil moisture depths represented in climate models, which are also smaller than the actual root depths of the trees considered in the hydroclimate reconstruction.
One further reason for the temperature–hydroclimate relationship difference between instrumental data, reconstructions and model simulations may be related to the ability of models (Bladé et al 2012) and tree-ring records (Seim et al 2018), respectively, to capture the atmospheric circulation linking the Atlantic with Eurasia, which influences both summer temperature and precipitation (Barriopedro et al 2014, Coats and Smerdon 2017, Xoplaki et al 2018). Summer temperatures in Europe have been found to be partly driven by a baroclinic wave train in the atmosphere, which modulates temperature and precipitation patterns, and originates in ocean surface-heat flux anomalies in the North Atlantic (Ghosh et al 2017). Model differences in simulating the wave length and phase may result in mismatches in the simulated temperature–precipitation link. The Atlantic multidecadal variability explains as much as 25% of the variance of European summer temperature at multidecadal scales (Wang et al 2017) and presumably also has a significant influence on precipitation variability.
Conclusions and outlook
We have compared the best available instrumental, reconstructed and model-simulated warm-season temperature and hydroclimate data for Europe and investigated their co-variability and across timescales. Our study reveals a tendency at lower frequencies for a positive coupling between warm-season temperature and hydroclimate (i.e. warm and wet) in northern Europe, and a negative tendency (i.e. warm and dry) in southern Europe. Compared to instrumental data, tree-ring based reconstructions show a too positive temperature–hydroclimate relationship, particularly in the high frequency domain, while model simulations show a too negative relationship across all timescales.
Despite these noted differences, the reconstructions and simulations share a large proportion of common leading modes in temperature–hydroclimate co-variability and spectral peaks (SOM). Overall the models tend to propagate the negative inter-annual relationship to longer timescales. CCSM4 simulates the observed temperature–hydroclimate relationship more accurately than MPI, revealing a co-variance change with timescale more akin to the instrumental observations and reconstructions. This implies that the CCSM4 model may more reliably simulates hydroclimatic changes in a future warmer world. We recommend similar evaluations against reconstructed temperature–hydroclimate relationships also for other models, with available 'last millennium' simulations, as a way to assess how well the various models can simulate hydroclimate changes under warmer and colder climate conditions.
Both reconstructions and model simulations show limitations in their representation of temperature–hydroclimate relationships in Europe across timescales. Our results warrant caution against uncritical use of tree-ring based reconstructions as a 'blueprint' for temperature–hydroclimate relationships, as such reconstructions may not clearly distinguish the effects of temperature-driven evapotranspiration and precipitation. Thus, despite the challenges we have noted, we recommend judicious attempts to include different proxy archives (e.g. historical documentary data, limnological records, speleothems as well as tree-ring based isotope records) to use as complementary information in future model simulation–reconstruction comparison studies.
Our analysis of the temperature–hydroclimate relationship in instrumental data and tree-ring based reconstructions, compared to the same relationship in model simulations, shows that climate models either overestimate the role of warm-season temperature on soil moisture, or underestimate the influence of precipitation, or a combination of both. If unaddressed this condition could lead to an overestimation of future drought risks as well as an underestimation of increasing precipitation in northern and central Europe. Assessing to what degree drought occurrence and strength are governed by temperature across different timescales—in the past, present and future—is an essential question for ecological and agricultural system management. Moreover, such assessment is also important for evaluating model performance by testing how well the models can simulate temperature–hydroclimate relationships across different timescales. We recognize a need to improve tree-ring based hydroclimate reconstructions for better understanding of drought and its relationship to precipitation at higher frequencies and to temperature at lower frequencies. Until such advances have been made, the low-frequency temperature–hydroclimate relationship in Europe (and elsewhere) remains poorly constrained, and accurate predictions of hydroclimatic changes under global warming are far more challenging than currently assumed.
Acknowledgments
This is a contribution from the interdisciplinary and international framework of the Past Global Changes (PAGES) 2k initiative (Euro-Med2k), which in turn received support from the US and Swiss National Science Foundations. FCL acknowledges support by the Royal Swedish Academy of Letters, History and Antiquities, the Bank of Sweden Tercentenary Foundation, and the Swedish Research Council (Vetenskapsrådet, grant no. 2018-01272), AS by the German Research Foundation (DFG, grant no. SE 2802/1-1), JFG-R, CMA and EG-B by the Spanish National Funding Agency (projects ILModelS and GreatModelS, ref. CGL2014-59644-R and RTI2018-102305-B-C21), J L by the Belmont Forum and JPI-Climate (grant no. 41661144008), J L and E X by the DAAD project 'The Mediterranean Hot-Spot', KS by FORMAS (grant no. 2014-723), J W by the National Key R&D Program of China (grant no. 2017YFA0603302) and the NSFC (grant no. 41602192), JE by the German Science Foundation (DFG, grant No. Inst 247/665-1 FUGG and grant No. ES 161/9-1), and UB by the SustES — Adaptation strategies for sustainable ecosystem services and food security under adverse environmental conditions (CZ.02.1.01/0.0/0.0/16_019/0000797). Lamont contribution #8330. All data can be downloaded from the World Data Center for Paleoclimatology homepage: https://ncdc.noaa.gov/paleo/study/27090.