

Abstract
Africa is projected to add one billion urban residents by 2050. Yet developing sustainable solutions to tackle the host of challenges posed by rapid urban population growth is stymied by a lack municipality-level population data across the continent. To fill this gap, we intersect volunteered urban settlement data from OpenStreetMap with five synthetic gridded population datasets to estimate the how Africa's urban population is distributed among over 4750 individual urban settlements across Africa. We assess how urban settlement distributions changed from 2000 to 2015 within and between countries and across moisture zones. To this end, we construct urban settlement Lorenz curves to calculate change in Gini coefficients and test the degree to which Africa's urban settlements distributions fit power law distributions exhibited by Zipf's law. Our results reveal that 77%–85% of urban settlements in Africa have fewer than 100 000 people and that at least 50% of Africa's urban population live in urban settlements with fewer than 1 million residents. Across almost all African countries, the distribution of urban population shifted towards larger cities between 2000 and 2015. However, in arid regions, our results indicate that small- and medium-sized urban settlements are absorbing a greater share of urban population growth compared to large urban settlements. While our urban population estimates vary across gridded population datasets and differ from United Nations estimates, this is the first paper to measure urban population across Africa using a consistent methodology to identify urban settlement populations. Unlike UN urban population data for Africa, our results can readily be incorporated with geolocated environmental, public health, and economic data to support efforts to monitor United Nations Sustainable Development Goals related to urban sustainability, poverty reduction, and food security across Africa's ever-growing urban settlements.
Export citation and abstract BibTeX RIS

Original content from this work may be used under the terms of the Creative Commons Attribution 3.0 licence. Any further distribution of this work must maintain attribution to the author(s) and the title of the work, journal citation and DOI.
1. Introduction
Africa is projected to add one billion urban residents over the next thirty years, ballooning from 491 million in 2015 to nearly 1.5 billion by 2050 [1]. Such rapid urban growth presents a host of challenges for the continent's development prospects. Urbanization, the shift in the proportion of population from rural-to-urban areas, has not led to concurrent economic growth [2, 3] nor equitable economic gain for the majority of Africa's urban dwellers. UN-Habitat states that over 50% of urban Africans live in slums today [4]. The development of basic services within cities—including water and sanitation, education, infrastructure, and public health—has not kept pace with the rapid increase in urban population [5]. Urban food security is a chief concern [6, 7]. Numerous case studies have shown that most poor urban Africans regularly experience food insecurity [8]. Troubling research from South Asia suggests that some African cities may become inhospitable as climate change produces more frequent extreme temperatures in mid-latitude regions [9]. Together these mounting challenges raise concerns for Africa's ability to achieve United Nations Sustainable Development Goal 11 to 'Make cities and human settlements inclusive, safe, resilient and sustainable' [10].
Our ability to understand the drivers of urban population growth and develop sustainable solutions to tackle the challenges Africa's urban settlements face is stymied by a lack of municipality-level population data for Africa. It is unclear how many people live in many of Africa's cities and towns, especially those with fewer than 1 million residents [21–23]. For many countries, censuses are infrequently conducted, can be unreliable [24], and most do not provide geolocated municipality-level population counts. At present, United Nations Population Division data is widely used to track urbanization across the continent. But UN urban growth projections often over-emphasize primary cities and have been shown to be previously incorrect [22, 23, 25–27]. UN data is only provided at the national-level and for select municipalities with populations greater than 300,000 residents [1], even though the UN estimated that in 2015 49% of Africans live in urban settlements with fewer than 300,000 people. Similarly, alternative census databases do not provide municipality-level data [28] nor geographic information that can be incorporated with other geo-referenced datasets [29].
Despite such data inadequacies, a diverse body of research has attempted to identify drivers of urban population growth in Africa [2, 3, 11–13, 27, 33, 34]. Early work argued that Africa uniquely urbanized without concurrent economic growth [3], though this conclusion may be over generalized [2, 33, 34]. More recent research suggests that climate change may be amplifying urban population growth in drying regions across Africa [10–12]. While the drivers of urban growth are complex, climate change is already negatively affecting rural livelihoods [13–16], migration is a well-established response to environmental change [17], and rural-to-urban migration has been thought to be the predominate driver of urban population growth across the region [18]. Others suggests that, at least at the national-level, natural increase among urban populations may be contributing more to urban population growth than rural-to-urban migration [20]. Nonetheless, all of these studies either rely on UN national-level urban population estimates [2, 33, 34] or employ imprecise definitions of urban settlements [13]. Without geolocated population estimates for individual urban settlements delineated with contestant criteria in Africa, we cannot accurately assess the drivers of urban population growth, much less gauge how the distribution of Africa's urban population is changing within and between countries or across climatological zones.
Since the 1990s, researchers have generated synthetic gridded population datasets to overcome the lack fine-scale population data across the planet. These data sets are available at the continental scale at 1 km spatial resolution and are produced using geospatial modeling techniques that assigns individual pixels a population value based on spatial-covariates derived from remote-sensed imagery and/or auxiliary GIS data [24]. It is not possible to directly estimate the population of individual urban settlements with these data sets alone. The data are available in raster format, providing a continuous plane of population counts that do not delineate political boundaries or labels. Furthermore, the methodologies and input data used to generate gridded population data sets vary. To date, no study has compared urban settlement population estimates across gridded population data sets using a consistent methodology.
Our objectives are twofold. First, we develop comparative measures of how the Africa's urban population is currently distributed among over 4,750 individual labeled urban settlements across Africa. To accomplish this, we intersect volunteered geographic information (VGI) data from OpenStreetMap (OSM) with five gridded population datasets: WorldPop 2015; LandScan 2015; Global Human Settlement Layer Population Grid (GHS-Pop) 2000 and 2015; and the World Population Estimate (WPE) 2016. We delineate urban settlement extent with a standard population density threshold. Second, we assess how the distribution of Africa's urban population among small and medium-sized urban settlements (those with fewer than 5 million people) is changing within and between countries and across climate gradients using GHS-Pop 2000 and 2015 datasets. We employ two methods to evaluate changes in urban population distributions. First, we construct Lorenz curves and urban settlement Gini coefficients using GHS-Pop 2000 and 2015. Second, we examine urban settlement size distributions using the more traditional city rank size power law distribution exhibited by Zipf's law. This research showcases a novel methodology to measure individual urban settlement populations to highlight what urban growth trajectories may occur across Africa in light of broader environmental and economic challenges.
2. Data
2.1. Synthetic gridded population data
The PopGrid Data Collaborative provides detailed information on publicly available gridded population datasets [35]. We use five datasets from four providers: WorldPop 2015 by the University of Southampton [36]; LandScan 2015 from Oak Ridge National Lab [37]; WPE 2016 by Esri Inc. [38]; and GHS-Pop 2000 and 2015, produced by the European Union Joint Research Center [39]. All datasets are available at 1 km grid cell, but the methodologies and input data vary [24]. WorldPop establishes spatial weights between areal features and census population estimates by applying a random forest algorithm to a suite of remote-sensed derived land cover classes and GIS layers, such as distance to roads, and environmental data, including elevation and mean temperature, to estimate population counts [40]. In this study we use WorldPop data that is adjusted to United Nations national population estimates.
WPE couples remote-sensed derived land cover classes and GIS data, to develop weights for individual grid cells based on the likelihood that a given cell contains a human settlement. Finest-scale census data are then divided and apportioned to individual grid cells based on the likelihood weights. WPE validates their data by ensuring that populations for all countries total to national population estimates [38]. LandScan uses a dasymetric spatial model that relies on smart interpolation [41]. This approach proportionally allocates finest-scale available census data to each cell within a given census unit with model weights derived from remote-sensed satellite imagery and GIS data [37].
GHS-Pop integrates the Gridded Population of the World version 4 (GPWv4) with the Global Human Settlement Layer Built-Up Grid (GHS-Built). GWPv4 apportions the finest scale census data available equally across grid cells within a given census boundary and does not use auxiliary remote sensing or GIS. The GHSL-Built grid is derived from a supervised learning land cover classification of LandSat imagery at 38 m spatial resolution. To produce GHS-Pop, GWPv4 is proportionally allocated to GHS-Built cells based on built-area density [42]. While WorldPop provides gridded population at five-year intervals from 2000 to 2020, GHS-Pop datasets are independently produced for each time point. GHSL-Built is constructed using Landsat mosaics at each time step (e.g. the GHS-Built 2000 uses images from 2000, while GHS-Built 2015 uses images from 2015) and GWPv4 derives population counts for target years by using a simple growth rate equation between two censuses [43, 44].
2.2. OpenStreetMap
OpenStreetMap is a global collaboration to map the planet with VGI from anonymous contributors curated by the OpenStreetMap Foundation. All data are free to download and is continuously updated. Within the OSM typology, 'places' are known population settlements from which an urban hierarchy labels individual point locations, or 'nodes', as either a 'city', 'town', or 'village'. In this study, we use OSM point data for 950 cities and 8863 towns in Africa. OSM defines cities as the largest urban settlement within a bounded political territory and towns as 'An important urban centre, between a village and a city in size.' To our knowledge no study has combined OSM data with continental-scale gridded population datasets to identify individual urban settlements, though OSM roads are used as input data for WPE 2016 [38].
2.3. Moisture zones
To demonstrate how our mythology can be used to advance our knowledge of how urban population distributions are changing across climate zones in Africa [11, 13, 18], we group our estimates of urban settlements according to moisture zones identified in HarvestChoice's 2009 agro-ecological zones (AEZ) map for Sub-Saharan Africa [45]. The AEZ map classifies moisture zones by using the length of growing period (LGP) based on moisture and temperature conducive to crop growth. LGP are estimated by the number of days where average temperature exceeds 5 °C and precipitation plus soil moisture exceeds half the potential evapotranspiration. Arid zones have fewer than 70 d LGP, semi-arid 70–180 d LGP, sub-humid 180–270 d LGP and humid have over 270 d LGP. The AEZ is produced at approximately 10 km grid cells, though the final product is available at 1 km spatial resolution.
3. Methods
3.1. Measuring population of individual urban settlements
We first clip gridded population datasets to an Africa continental GIS basemap available from Esri Inc. that was manually buffered to prevent coastal pixels from being dropped (figure 1(a)). Then we use a density threshold to identify urban versus non-urban locations. Strict population density thresholds are not necessarily the only criteria that identify urban settlements versus rural, nor do settlements necessarily follow a strict urban–rural dichotomy [46, 47]. However, few alternatives exist for delineating labeled urban settlements from raster data without GIS jurisdictional boundaries. We use the European Union degree of urbanization (DEGURBA) classification [48] for high-density urban areas (cities) and lower-density urban clusters (towns and suburbs). First, we first mask pixels that contain at least 1500 persons per km2. Then we apply a second mask that includes pixels with at least 300 persons per km2 that are connected to the urban cores identified with the first mask. We set all other pixels to zero, leaving the pixels containing the urban cores and extended suburban areas identified with the 1500–300 persons per km2 double density masks, which we transform into vector polygons (figure 1(b)). We recognize population density thresholds have limitations for application in Africa [21, 27], but provide a consistent basis to evaluate differences across the gridded population datasets evaluated in this analysis.
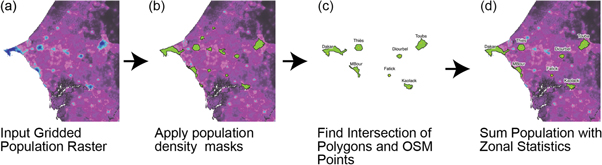
Figure 1. Workflow of method to intersect urban settlement 1500–300 persons per km2 density mask from gridded population raster dataset with associated labeled OSM urban point data to estimate the population of individual urban settlements in Africa.
Download figure:
Standard image High-resolution imageNext, we find the spatial intersection between the urban settlement polygons delineated in each gridded population raster with the OSM city and town points (figure 1(c)). OSM points are buffered by ∼250 m to ensure that individual points do not fall just outside the bounds of the polygons. At the time of download, OSM listed 950 cities and 8,863 towns in Africa. Intersecting OSM urbans settlement points with the polygons derived from the destiny masks in the gridded population data sets provides an independent method to cross validate the location of urban settlements.
We retain all urban settlement polygons that spatially intersect with one or more OSM city or town point. All else are dropped (table 1). The retained urban settlement polygons are then overlaid on the original raster. We calculate the total population for each labeled urban settlement polygon using zonal statistics (figure 1(d)). Then each urban settlement is assigned to a moisture zone based on AEZ classification and grouped by country. Settlements that span international borders are clipped and allocated to their respective countries. Finally, we remove urban settlements with fewer than 5,000 people per DEGURBA criteria.
Table 1. Spatial agreement/disagreement OSM urban settlement point locations with masked 1500–300 persons km−2 urban settlement polygons isolated in gridded population datasets.
| GHS-Pop 2000 | GHS-Pop 2015 | WorldPop 2015 | LandScan 2015 | WPE 2016 | |
|---|---|---|---|---|---|
| Masked 1500–300 persons km−2 urban settlement polygons | 45,303 | 46,100 | 12,453 | 28,663 | 30,532 |
| OSM 'towns' that do not intersect with masked 1500–300 persons km−2 urban settlement polygons out of 8863 total OSM 'towns' | 3,441 | 3,025 | 5,612 | 3,704 | 3,692 |
| OSM 'cities' that do not intersect with masked 1500–300 persons km−2 urban settlement polygons out of 950 total OSM 'cities' | 119 | 104 | 197 | 45 | 92 |
| Masked 1500–300 persons km−2 urban settlement polygons that intersect with one or more OSM urban settlement points and have >5000 peoplea | 4,486 | 4,784 | 2,536 | 4,045 | 4,167 |
3.2. Estimating change in the distribution of urban population 2000–2015
We employ two approaches to estimate the change in the distribution of urban population for Africa, within and between select countries, and across moisture zones using GHS-Pop 2000 and 2015. First, we plot points along Lorenz curves and calculate urban settlement Gini coefficients. Lorenz curves and Gini coefficient can be used to quantify inequality, or size hierarchy, within a series [49, 50]. Countries with Gini coefficients closer to zero have a larger share of the total urban population distributed among smaller and medium-sized cities. Third, we assess the rank size distribution across all African countries following Zipf's Law for city size distribution [30]. For urban hierarchies in agreement with Zipf's Law, the second largest city has half the population of the largest, and the third largest city has a third of the population of the largest and so forth. This is expressed as:

where R is a given city's rank, P is a city's population and K and α are constants. Here we estimate α by fitting using ordinary least squares loglinear models.
As a focus of this paper is to examine how urban populations are changing among small- and medium-sized urban settlements, we remove settlements with greater than 5 million people from our distribution change analysis (table 2). So called mega-cities [51, 52] have received a disproportionate amount of attention from urban scholars [53] and have long been tracked with UN data. Furthermore, several urban settlements in our analysis exceed the largest urban mega agglomerations on the planet [1] and overly skew our ability to identity changes in urban population distribution among small and medium-sized urban settlements. For example, two polygons from Egypt in 2000 contain 33.20 million and 11.81 million people, respectively. By 2015 they merge together to form a single continuous urban plain with 83.46 million people that spans the entire Nile River Basin and houses nearly 90% of Egypt's population (table 2).
Table 2. Urban agglomerations with at least 5 million residents for GHS-Pop 2000 and 2015.
| Country(s) | Agglomeration name | Pop. 2000 (millions) | Pop. 2015 (millions) |
|---|---|---|---|
| Egypt | Cairo (Northern Nile Basin) | 33.20 | 83.46 |
| Nigeria | Lagos | 9.66 | 13.73 |
| Nigeria | Onitsha (Niger Delta) | 4.95 | 9.35 |
| South Africa | Johannesburg | 5.43 | 8.26 |
| Sudan | Khartoum–Omdurman | 4.70 | 7.64 |
| Angola | Luanda | 0.47 | 7.22 |
| Algeria | Algiers | 3.87 | 6.55 |
| Nigeria | Kano | 2.88 | 5.95 |
| DRC | Kinshasa | 6.47 | 5.79 |
| Tanzania | Dar es Salaam | 2.26 | 5.78 |
| Kenya | Nairobi | 2.60 | 5.12 |
| Egypt | Al-Minya (Southern Nile Basin) | 11.815 | Joined to Cairo Agglomeration |
4. Results
4.1. Comparative estimates of Africa's urban population by settlement size
The total number of Africans estimated to be living in urban settlements ranges from 479.15 for WorldPop 2015 to 608.89 million for WPE 2016. UN estimated that 491.53 million people lived in urban areas in 2015 [1]. Total urban population grouped by settlement size varies considerably by gridded population data sets (figure 2(a)), though across all data sets urban settlements with 1–5 million people encompass the greatest share of urban population by settlement size category (figure 2(a)) While UN data shows that 65% of urban Africans lived in urban areas with fewer than 1 million people in 2015 [1], our estimates range from 42% for LandScan 2015 to 50% for GHS-Pop 2015. However, unlike UN data, we provide population estimates for urban settlements with fewer than 300 000 inhabitants. For example, our results indicate that according to GHS-Pop 2015, 97 million people live in urban settlements with 100–300 thousand people and 117 million people live in settlements with fewer than 100 thousand people.

Figure 2. (a) Total urban population by settlement size and (b) distribution of individual urban settlement populations for WorldPop 2015, LandScan 2016, GHS-Pop 2015 and WPE 2016.
Download figure:
Standard image High-resolution imageWe estimate populations for between 2,536 individual labeled urban settlements with WorldPop 2015 and 4,784 with GHS-Pop 2015 (figure 3(b)). Our results show that 78% (WorldPop 2015) to 85% (LandScan 2015) of urban settlements contain fewer than 100,000 people (figure 3(b)). For example, among the 4,045 individual urban settlements identified in LandScan 2015, only 604 have greater than 100,000 people. Accordingly, the median population of urban settlement ranges from 20,245 for LandScan 2015 to 32,184 for WPE 2016. Urban settlements with greater than 1 million people skew the distribution, with the WorldPop 2015 having the highest mean settlement population of nearly 190,000 people.

Figure 3. Urban population group by settlement size for GHS-Pop 2000 and GHS-Pop 2015.
Download figure:
Standard image High-resolution imageIntersecting OSM urban settlement location data with gridded population data sets to identify urban settlement populations significantly reduces noise produced by density thresholds alone and provides independent validation that an urban settlement exists at a given location within a gridded population data set (table 1). But the density thresholds we employ results in substantially divergent urban settlement boundaries across datasets, as well as differences in agglomeration connectivity. This is especially evident for heavily urban regions, such as the Nile River Basin. With WorldPop 2015, we identify over 50 disparate urban settlements in the Nile River Basin, still with one housing over 40 million people living in the Cairo agglomeration. But with GHS-Pop 2015, only 15 individual settlements are mapped and the largest contains over 80 million people. The divergences among the gridded population are also evident from the difference in the of distribution of urban settlement population (figure 3(b)), with LandScan 2015 capturing substantially more small urban settlements compared to the other datasets.
4.2. Change in urban population distribution 2000–2015 by country
Including agglomerations with greater than 5 million people, our analysis of GHS-Pop shows that Africa's urban population expanded from 382.68 million to 607.92 million from 2000 to 2015, a 59% increase. This exceeds UN estimates stating that the continent had 286 million urban residents in 2000 and 491 million in 2015 [1]. Across the continent, the largest urban settlements absorbed the greatest share of urban population growth (figure 3). Urban areas with 5–10 million people expanded by 225%. However, as noted above with the example of the Nile River Basin, there is evidence that much of this growth among large settlements is a result of urban agglomerations growing together. For small- and medium-sized urban settlements, those with 100–300 thousand people, 300–500 thousand, and 500–1 million inhabitants expanded 40%, 44%, and 61%, respectively.
Even with urban settlements with greater than five million people removed, the Lorenz curves and Gini coefficients indicate that the distribution of urban settlements in Africa is becoming more unequal, with larger cities absorbing a greater proportion of urban population growth. For most African countries, urban settlement Gini coefficients increased, signaling that the share of total urban population living in the largest urban settlement increased between 2000 and 2015 (table 3). Countries with larger changes in Gini coefficients tended to have relatively larger increase in median population. Nonetheless, substantial variation exists across countries (table 3). Decreasing Gini coefficients for countries like Botswana indicate that smaller urban settlements may be growing faster than larger urban settlements. For countries like Ghana, a decrease in the number of urban settlements between 2000 and 2015 suggest that settlements grew together (table 3). Additionally, the noticeable deviations in rank-size α values from 1 suggest that the rank-size distribution of African urban settlements does not follow Zipf's law (table 3), though this is not unexpected [30, 32, 55]. Visually this is quite apparent for countries like Nigeria and Ethiopia, where the log ranked size plotted against the log population is nonlinear (see supplement, available online at stacks.iop.org/ERL/14/085009/mmedia).
Table 3. Changes in urban population distribution in Africa measured by GHS-Pop 2000 and GHS-Pop 2015 Countries where settlements with greater than five million people removed have been removed demarcated with (num.) (see table 1).
| Country | Count | Count | Median | Median | Gini | Gini | α | α |
|---|---|---|---|---|---|---|---|---|
| 2000 | 2015 | 2000 | 2015 | 2000 | 2015 | 2000 | 2015 | |
| Algeria | 426 | 400(1) | 19 881 | 26 643 | 0.65 | 0.59 | −1.01** | −0.94* |
| Angola | 71 | 80(1) | 40 950 | 44 901 | 0.64 | 0.64 | −0.65* | −0.69* |
| Benin | 75 | 81 | 20 390 | 24 659 | 0.67 | 0.77 | −0.84* | −0.73* |
| Botswana | 19 | 16 | 48 728 | 61 392 | 0.45 | 0.37 | −0.62 | −0.97 |
| Burkina Faso | 73 | 82 | 26 733 | 30 689 | 0.62 | 0.71 | −0.83* | −0.82* |
| Burundi | 92 | 94 | 21 663 | 28 130 | 0.48 | 0.61 | −1.09* | −0.91* |
| Cameroon | 120 | 125 | 29 262 | 32 755 | 0.70 | 0.76 | −0.77* | −0.7* |
| Cape Verde | 8 | 10 | 16 800 | 17 383 | 0.32 | 0.37 | −1.14 | −1.05 |
| Central African Republic | 63 | 74 | 14 224 | 14 654 | 0.61 | 0.63 | −1.03* | −1.01* |
| Chad | 38 | 45 | 68 704 | 88 544 | 0.55 | 0.59 | −0.65 | −0.55* |
| Comoros | 7 | 10 | 8918 | 12 276 | 0.62 | 0.66 | −0.44 | −0.53 |
| Congo | 17 | 32 | 16 825 | 14 572 | 0.82 | 0.81 | −0.49* | −0.6* |
| Côte d'Ivoire | 103 | 107 | 23 139 | 27 446 | 0.73 | 0.75 | −0.88* | −0.85* |
| DRC | 260 | 292(1) | 22 471 | 30 868 | 0.68 | 0.72 | −0.8* | −0.72* |
| Djibouti | 1 | 2 | 431 331 | 261 159 | 0.00 | 0.48 | 0*** | −0.18*** |
| Egypt | 34(2) | 21(2) | 130 921 | 84 871 | 0.72 | 0.55 | −0.49* | −0.56 |
| Equatorial Guinea | 7 | 7 | 13 952 | 20 062 | 0.55 | 0.60 | −0.53 | −0.44 |
| Eritrea | 4 | 5 | 78 033 | 58 831 | 0.58 | 0.67 | −0.44 | −0.35* |
| Ethiopia | 338 | 394 | 34 785 | 43 123 | 0.53 | 0.59 | −0.96* | −0.87* |
| Gabon | 14 | 14 | 19 455 | 20 018 | 0.66 | 0.68 | −0.68 | −0.62* |
| Gambia | 13 | 14 | 18 233 | 24 277 | 0.67 | 0.76 | −0.67* | −0.61 |
| Ghana | 228 | 220 | 19 853 | 21 813 | 0.69 | 0.77 | −0.89* | −0.81* |
| Guinea | 92 | 96 | 16 859 | 20 073 | 0.67 | 0.72 | −0.92* | −0.84* |
| Guinea-Bissau | 19 | 20 | 19 313 | 25 216 | 0.58 | 0.66 | −0.79* | −0.68* |
| Kenya | 118 | 124 | 20 743 | 27 902 | 0.80 | 0.78 | −0.72** | −0.68* |
| Lesotho | 12 | 11 | 19 948 | 23 262 | 0.58 | 0.60 | −0.73 | −0.68 |
| Liberia | 20 | 26 | 17 415 | 22 135 | 0.71 | 0.75 | −0.74 | −0.74 |
| Libya | 52 | 58 | 15 736 | 16 102 | 0.76 | 0.79 | −0.69* | −0.67** |
| Madagascar | 57 | 68 | 14 951 | 22 193 | 0.70 | 0.75 | −0.96* | −0.91* |
| Malawi | 38 | 43 | 16 778 | 31 871 | 0.67 | 0.79 | −0.86* | −0.7* |
| Mali | 157 | 185 | 11 894 | 13 981 | 0.61 | 0.72 | −1.16* | −0.99* |
| Mauritania | 17 | 19 | 12 288 | 18 343 | 0.75 | 0.78 | −0.67* | −0.65* |
| Mauritius | 7 | 4 | 26 062 | 68 326 | 0.71 | 0.56 | −0.47 | −0.43 |
| Morocco | 200 | 204 | 23 212 | 26 240 | 0.74 | 0.77 | −0.79** | −0.75** |
| Mozambique | 131 | 140 | 31 225 | 38 357 | 0.62 | 0.65 | −0.86* | −0.79* |
| Namibia | 19 | 23 | 16 158 | 21 779 | 0.54 | 0.60 | −0.89 | −0.78* |
| Niger | 49 | 71 | 26 958 | 24 747 | 0.66 | 0.71 | −0.7* | −0.67* |
| Nigeria | 315(1) | 312(3) | 47 794 | 61 423 | 0.70 | 0.71 | −0.72* | −0.63* |
| Rwanda | 48 | 42 | 21 999 | 32 626 | 0.58 | 0.72 | −0.97* | −0.73* |
| Reunion | 10 | 6 | 47 740 | 144 870 | 0.43 | 0.30 | −0.68 | −0.73 |
| Senegal | 78 | 86 | 22 702 | 30 342 | 0.72 | 0.75 | −0.67* | −0.66* |
| Sierra Leone | 35 | 39 | 13 246 | 15 998 | 0.69 | 0.76 | −0.76* | −0.71* |
| Somalia | 48 | 53 | 18 727 | 31 353 | 0.72 | 0.69 | −0.76* | −0.72* |
| South Africa | 303 | 329(1) | 17 931 | 20 331 | 0.74 | 0.76 | −0.84** | −0.8** |
| South Sudan | 52 | 73 | 30 769 | 38 124 | 0.52 | 0.56 | −0.79* | −0.77* |
| Sudan | 88 | 98(1) | 47 260 | 54 186 | 0.71 | 0.61 | −0.62* | −0.62* |
| Tanzania | 156 | 163(1) | 16 574 | 27 088 | 0.70 | 0.65 | −0.93** | −0.9* |
| Togo | 33 | 37 | 38 722 | 42 500 | 0.67 | 0.72 | −0.68* | −0.63* |
| Tunisia | 82 | 81 | 32 559 | 32 828 | 0.67 | 0.71 | −0.84* | −0.81* |
| Uganda | 134 | 139 | 21 075 | 31 447 | 0.64 | 0.67 | −1* | −0.91* |
| Zambia | 56 | 55 | 52 955 | 65 434 | 0.60 | 0.64 | −0.73* | −0.7* |
| Zimbabwe | 44 | 43 | 29 509 | 33 291 | 0.73 | 0.76 | −0.77* | −0.7* |
| Africa | 4481(3) | 4773(11) | 22 871 | 28 482 | 0.71 | 0.72 | −0.85** | −0.79** |
***p < 0.001, **p < 0.01, *p < 0.05.
The Lorenz curves can be employed to examine differences in urban settlement distributions that are not apparent from the Gini coefficients alone. We see that both the shape and changes in Lorenz curves vary widely across African countries (figure 4—see supplement for all countries). We can quantify these differences in the Lorenz curves with ranked settlements size quantile thresholds. For example, in Kenya in 2015, the bottom 90% of urban settlements had fewer than ∼272,000 people and housed about 28.6% of Kenya's urban population in 2015. In contrast, about 54% of Ethiopia's urban population in 2015 lived in the bottom 90% of urban settlements, those with ∼150,000 people or fewer, showing that urban Ethiopians tend to live in smaller urban settlements compared to urban Kenyans.
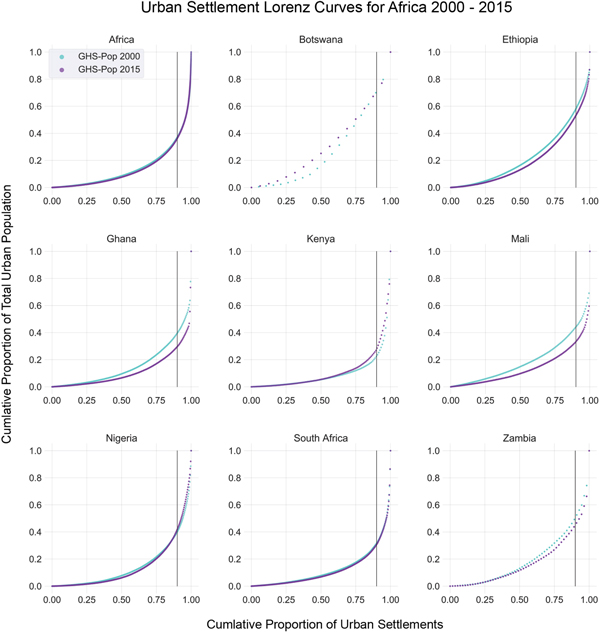
Figure 4. Urban settlement Lorenz curves using GHS-Pop 2000 and GHS-Pop 2015 data for Africa and select countries (see supplement for all countries). The vertical line delineates the 90th percentile of settlements ranked by size. Plots are arranged alphabetically. Botswana's Lorenz curve shifted to the left, signifying that smaller urban settlements absorbed a greater share of urban population growth between 2000 and 2015. Note that agglomerations with greater than 5 million people have been removed.
Download figure:
Standard image High-resolution imageWe can also assess how distributions are changing overtime. For instance, Ghana exhibited a large shift between 2000 and 2015, decreasing from 39% to 30% of its urban population living in the bottom 90% of urban settlements ranked by size. The 90% threshold increased in Ghana to about 100,000 in 2015 from about 80,000 in 2000. Africa-wide, excluding agglomerations with greater than five million people, about 36% of the total urban population lived in the bottom 90% of urban settlements in both 2015, down from 37% in 2000. The 90th percentile threshold, however, increased from 124,000 to 173,000 residents from 2000 to 2015. Because United Nations population data is not provided for all individual urban settlements this type of analysis is not possible.
4.3. Change in urban population distribution 2000–2015 by moisture zone
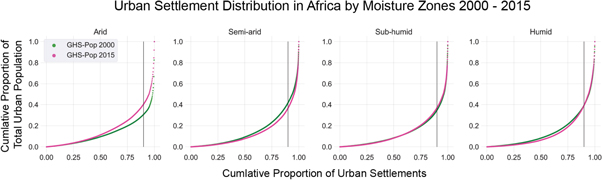
The change between 2000 and 2015 in the share of urban Africans living in the largest urban settlements by size substantially varies across moisture zones. In arid regions, the share of total urban population living in larger urban areas, excluding settlements with greater than 5 million people, decreased substantially between 2000 and 2015. This is evident from the Lorenz curve clear leftward shift (figure 5). The bottom 90% of urban settlements in arid regions increased from 30% of the total urban population in 2000 to 40% in 2015. The 90th percentile threshold increased from 64,000 in 2000 to 86,000 in 2015. This indicates that small and medium-sized urban settlements are growing faster compared to larger urban settlements across Africa's arid regions. We observe a similar, but considerably less pronounced, shift toward smaller and medium-sized urban settlements in sub-humid regions. About 35% of the total urban population in sub-humid regions lived in the bottom 90% of cities in 2000 increasing to 37% in 2015, with the threshold increasing to 145,000 from 115,000 people.
Figure 5. Urban settlement Lorenz curves using GHS-Pop 2000 and GHS-Pop 2015 for moisture zones in Africa. The vertical line delineates the 90th percentile of settlements ranked by size. The noticeable left-shift of the arid curve between 2000 and 2015 indicates that smaller urban settlements are absorbing more urban population growth than larger urban settlements. Note that agglomerations with greater than 5 million people have been removed.
Download figure:
Standard image High-resolution image
By comparison, in semi-arid and humid regions of Africa, larger cities are absorbing a greater share of urban population growth. In 2000, the bottom 90% of urban settlements—132,000 people or less—encompassed 42% of total urban population in semi-arid regions, dropping to 37% in 2015. Urban population distribution remained more stable in humid regions from 2000 to 2015. About 40% of urban dwellers resided in the bottom 90% in both 2000 and 2015, though the 90th percentile threshold increased from 137,000 to 254,000 people.
5. Discussion and conclusions
The conventional narrative on urban population growth in Africa centers on primary and capitals cities. Yet UN estimates state that 65% of urban Africans lived in cities containing 1 million or fewer people in 2015 [1]. While our estimations are lower than UN numbers, showing that 50% of urban Africans live in urban settlements with 1 million or fewer in 2015, we confirm that small- and medium-sized urban areas contain a considerable portion of Africa's urban population. This may not be unique to Africa. UN data states that 54% of urban South Americans live in urban areas with fewer than 1 million people, though South America is 85% urban and Africa is only 41% [1]. But unlike UN data, our methodology provides an avenue to estimate the population of and the geographic distribution of these smaller urban settlements. We are able to detail how urban populations are distributed within and between countries, and across non-political geographies such as moisture zone. Indeed, this study offers the first assessment of urban population distribution in Africa using a consistent definition of urban settlement across countries.
Our results highlight that small- and medium-sized urban settlements in arid regions in Africa may be growing substantially faster than larger urban settlements. This finding complements recent research that shows climate change may be amplifying urban growth in drying regions of Africa [13]. Studies have shown that pastoralist and dryland farmers are facing heightened challenges in climate of climate change [14, 15]. We reason that, although decisions driving rural-to-urban migration are complex [18], these arid urban settlements may be growing in part because of easy of migration from rural communities to proximate market towns and regional hubs. These smaller towns may offer a greater chance at poverty alleviation compared to large urban centers as rural populations move to cities [56]. However, in the coming decades, an increasing number Africans will live in arid regions arid due to climate change [57] and, as these regions become hotter and drier, questions about the stability of these urban systems abound [13]. Unlike other urban population data sets for Africa, our results can readily be incorporated with raster datasets with continuous environmental variables, like precipitation and temperature, to gauge how pressure from climate change and climate shock may affect urban settlement populations at fine spatial scales and across non-political boundaries.
Pinpoint population measurement for among small and medium-sized urban settlement is key to accurately measuring SDG targets and indicators for sustainable urban development, poverty reduction and food security [24, 58]. As noted, market towns and regional hubs may provide the best avenues of poverty alleviation [56]. We can hypothesize that smaller urban settlements have stronger economic connectivity within local economics, with food systems that rely on agriculture sourced from proximate areas, and stronger labor ties between with rural areas [59]. The economies in large African cities, in contrast, have greater connectivity into trans-African and global economy and thus greater exposure to external market forces [60, 61]. Additionally, urban–rural land use teleconnections and food system linkages may vary by urban settlement size across AEZ [46, 62]. The disparate connectivity surely presents unique food security and economic challenges that cascade across the urban hierarchy.
Last, we show that the distribution of African urban settlements does not follow Zipf's Law. This is not unexpected. Numerous studies have shown divergences from Zipf's Law for city rank size distributions [30, 32, 63]. While other rank size power law estimators have been proposed, the use of Lorenz Curves and urban settlement Gini coefficients provides a clear method to compare inequality within and between urban hierarchies.
Our results reveal divergences between gridded population data sets in measuring urban populations with a consistent methodology and also provide a contrast to United Nations urban population estimates. Differences between our results with UN urban population data may be a result of the UN relying on individual countries' definitions of urban areas, which can vary greatly [1]. We find variation among gridded population datasets, both in the number of settlements identified, the boundaries and populations of individual settlements defined by population density, and the aggregated number of urban Africans. But combining OSM urban settlement location data with gridded population data significantly reduces noise produced by density thresholds alone and provides independent validation that an urban settlement exists at a given location within a gridded population data set (table 1). This is a key finding in particular for GHS-Pop where 46,100 unique urban settlements are identified in 2015 without the OSM integration. As such, the producers of GHS-Pop offer a GHS Settlement Grid product based on the GHS-Pop that may over estimate the number of urban settlements in Africa.
But our results are not without limitations. First, the gridded population datasets that we employed all use census data from some countries, like Nigeria, that have been shown to be unreliable [64] and from several countries that have not conducted a census in over a decade [24]. Second, there is variation between datasets, both in the number of settlements identified, the boundaries and populations for individual settlements, and the aggregated total number of urban Africans. Variation may be due to divergences between spatial-covariates derived from remote sensing imagery and auxiliary GIS datasets. (For example, WorldPop uses Nighttime Lights satellite imagery, while WPE 2016 and GHS-Pop 2015 do not.) Additionally, because of the fluctuations in spatial boundaries for individual urban settlements, pairwise comparison of populations is not currently possible. As discussed with the case of Egypt, applying density thresholds in heavily urbanized regions can be problematic. Future research should address the discrepancies between datasets and develop best-estimates across gridded population datasets or pixel-level confidence intervals for individual data products.
Africa's urban population is expanding rapidly. This paper offers insights into not only how to pinpoint urban population pressures, but also presents a methodology to evaluate how these pressures may be changing. Growth of small and medium-sized urban settlements has implications for how rural-to-urban migration may unfold in the coming decades and what structures of urban governance can enhance the potential for desirable pathways of urban development. Our estimates indicate that small- and medium-sized urban settlements house the majority of urban Africans today and that these types of settlements may be growing fastest in arid regions—areas that are most vulnerable to climate change.
Acknowledgments
Funding for this research came from National Science Foundation awards SES-1360463, BCS-1115009, and BCS-1026776.
Author contribution:
All authors contributed to the writing, method development, and results interpretation for this manuscript. Data preparation and analysis was conducted by CT, with support from RA and KC.
Conflict of interests:
The authors report no conflict of interests.