

Abstract
If the material intensive enterprises in an urban area of several million people shared physical resources that might otherwise be wasted, what environmental and public benefits would result? This study develops an algorithm based on lifecycle assessment tools for determining a city's industrial symbiosis potential—that is, the sum of the wastes and byproducts from a city's industrial enterprises that could reasonably serve as resource inputs to other local industrial processes. Rather than report, as do many previous papers, on private benefits to firms, this investigation focuses on public benefits to cities by converting the maximum quantity of resources recoverable by local enterprises into an estimate of the capacity of municipal infrastructure conserved in terms of landfill space and water demand. The results here test this novel approach for the district of Mysuru (Mysore), India. We find that the industrial symbiosis potential calculated based on analysis of the inputs and outputs of ∼1000 urban enterprises, translates into 84 000 tons of industrial waste, greater than 74 000 tons of CO2e, and 22 million liters per day of wastewater. The method introduced here demonstrates how industrial symbiosis links private production and public infrastructure to improve the resource efficiency of a city by creating an opportunity to extend the capacity of public infrastructure and generate public health co-benefits.
Export citation and abstract BibTeX RIS
Introduction
While urbanization is often associated with pollution, congestion, and an increasing flow of energy and materials, a city's industrial base also offers opportunities for increased reuse of materials, byproducts, and more productive cycling of water and energy. The close proximity of urban enterprises, and the diversity of both byproducts produced and feedstocks required, creates more opportunities for industrial symbiosis (IS)—defined as the collective exchanges of byproducts and wastes among enterprises in different industries resulting in the more efficient use and disposal of, particularly, materials, water, and energy (Chertow 2000, Chertow et al 2015). Rather than focus at the firm level, as in previous research, we focus on quantifying the ways in which IS can trickle up to provide community level benefits. These include reducing local pollution, saving landfill space, and easing the demand for water and energy services. Figure 1 below conceptually summarizes the multiple scales of the benefits.
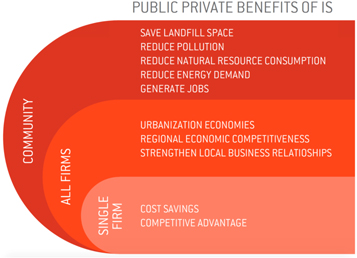
Figure 1. Summary of benefits of industrial symbiosis at multiple scales.
Download figure:
Standard image High-resolution imageFocusing at the city level, we examine industrial symbiosis potential (ISP), defined as the sum of the wastes and byproducts from all of the industrial facilities in a defined area that could reasonably serve as resource inputs to other processes (Chertow et al 2015). In this paper, we attempt to operationalize this definition, largely following the conceptual outline proposed by Chertow et al (see figure 2). We use a variety of data sources to quantify the potential impacts of IS on urban infrastructure and the environment in the context of Mysuru, India—a fast-urbanizing region in southern India with a diverse industrial base. In particular, we seek to answer three questions: (1) What amount of local demand could be replaced with locally available byproducts? (2) Among which industries could these exchanges be facilitated? (3) To what extent could IS extend local infrastructure expressed in terms of landfill capacity and wastewater treatment? We will also briefly discuss how policy makers could implement the findings of this paper.
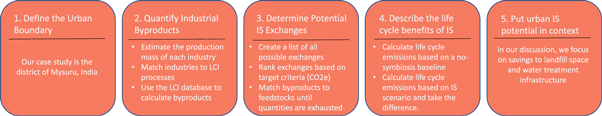
Figure 2. Overview of the steps to the industrial symbiosis potential algorithm, adapted from Chertow et al (2015).
Download figure:
Standard image High-resolution imageTo answer these questions, we develop a novel and transparent methodology based on readily available local economic data combined with life cycle inventory (LCI) data in order to identify symbiotic exchange opportunities. Most previous studies of IS have relied upon bottom-up measurements of directly observed flows—a useful process, but one that is labor intensive and not always feasible. Using LCI data makes it possible to analyze all possible flows within a given system boundary.
On a micro level, our algorithm allows for disaggregation of the flows by material, by geography, by industry, and even by firm, giving policy makers and city planners a valuable tool for targeting the material exchanges with the greatest system wide benefits. On a macro level, it allows us to see what percentage of local demand for materials could be met through IS, and it can be easily replicated and applied to different cities.
Previous research in industrial symbiosis has quantified the environmental and economic benefits of existing IS exchanges, often demonstrating that considerable water, energy, and economic savings have been achieved via different forms of byproduct exchange and/or infrastructure sharing. For example, analysis of water and steam exchanges in the Kalundborg IS cluster in Denmark showed that firms were able to get 95% of their water and significant percentages of their steam through symbiosis (Jacobsen 2006). Other studies have examined the benefits of existing IS clusters and exchanges, for example, in Puerto Rico (Chertow and Lombardi 2005), China (Shi et al 2010), and Australia (van Beers et al 2007), with respect to solid waste recycled or repurposed, water demand averted, and pollution avoided.
The highly contextual nature of IS makes it difficult to identify and analyze the symbiosis potential of a given system. If proximate enterprises identify a mutually advantageous transaction, rather than make it known to a broader public, they typically just implement it to achieve monetary or material savings keeping the symbiosis 'under the radar.' (Chertow and Ehrenfeld 2012). This makes it difficult to systematically analyze the potential or impacts of IS. An exception was derived from a study of a comprehensive public dataset on industrial waste in Pennsylvania. The study found that energy savings from reuse of industrial materials was greater than the state's entire renewable energy sector generation at the time (Eckelman and Chertow 2009). Another dataset of industrial byproducts in the Jiangsu Province, China showed that significant environmental and energy benefits had been achieved under the Comprehensive Utilization of Resources policy (Zhu and Chertow 2016). In both Pennsylvania and Jiangsu, however, the environmental benefits could have been much higher if the networks had been optimized.
Other research has shown that despite apparent advantages, firms may miss opportunities for mutually beneficial symbiotic exchanges (Chertow and Miyata 2011). This points to a role for policy makers in facilitating and incentivizing IS. Indeed, public support has played a significant role in the formation of some symbiosis clusters (van Berkel et al 2009). Several papers have favorably evaluated the results from national IS programs, for example, the UK's National Industrial Symbiosis Programme (NISP) and South Korea's national system of eco-industrial parks (Paquin and Howard-Grenville 2012, Park et al 2018). We also find, however, that despite recognition of the potential of IS as a planning strategy (Baas and Boons 2004, Sokka et al 2011, Golev et al 2014), insufficient attention has been paid to quantifying public benefits at the city and other spatial scales. Any public benefits of IS may be particularly attractive for infrastructure-challenged urban areas, if they offer an opportunity to extend limited infrastructure capacity by diverting or reducing material, water, and energy flows.
IS can also create significant public health or climate co-benefits. Some previous work has explored this topic. In particular, Ramaswami et al (2017) shows that leveraging the principles of industrial symbiosis design in Chinese cities with respect to reuse of waste heat and certain cross-sector material exchanges could save more than 25 000 lives per year from reduced air pollution, as well as contributing significantly to carbon mitigation. In a similar manner, we use life cycle impact analysis (LCIA) to quantify estimated CO2e and PM10 emission reductions corresponding to the industrial symbiosis potential of Mysuru.
Whereas Ramaswami et al described the benefits from potential waste heat exchanges, and cross-sector material exchanges involving fly ash, cement, and steel industries, we attempt to capture all possible material exchanges based on the byproducts produced in one region, a significant expansion of scope. We analyze 149 potential exchanges featuring 64 distinct byproducts produced from a wide variety of industries (see supplementary material is available online at stacks.iop.org/ERL/14/075003/mmedia for a complete list of exchanges considered). Furthermore, while other work tends to analyze IS by focusing on a particular set of materials or exchanges, we use industries as our main unit of analysis—attempting to capture all of the relevant materials for the industrial enterprises in Mysuru.
Context and scope
Mysuru is a district in the state of Karnataka in southern India, with a total population just over 3 million with Mysuru City at its core. We have chosen Mysuru as a case study for several reasons. Typical of many medium-sized cities in developing countries, Mysuru has a fast-growing economy and is rapidly urbanizing—the urban population of Mysuru grew by 26.8% between 2001 and 2011 (Census of India 2011). This rapid growth has created problems for Mysuru's waste management infrastructure (see e.g. Star of Mysore (blog) 2018). Globally, Hoornweg and Bhada-Tata (2012) estimate that by 2025, 4.3 billion urban residents will be producing 2.2 billion tonnes of waste annually, up from 1.3 billion now. This will create an immense demand for new solutions to waste management.
Furthermore, Mysuru's city officials and private firms have already shown an interest in progressive approaches to waste management. The city has won numerous awards for cleanliness and environmental performance consistently ranking in India's top 10 cleanest cities, and the local government recently set up several recycling centers and a compost plant (Pradhan 2018). The district has also been the subject of earlier symbiosis research. A previous Yale study found very high levels of industrial symbiosis in the Nanjangud Industrial Park, a cluster of firms in the Mysuru District 30 min south of the city (Bain et al 2010). These facts suggest city officials and private firms are already receptive to initiatives to extract value from waste streams.
We circumscribe the scope of our study in several important ways that collectively cause us to underestimate Mysuru's true industrial symbiosis potential. We only consider material exchanges that could occur within the boundaries of the district. In reality, many exchanges are likely to occur with firms outside the district, however we make this decision for two reasons. The first is computational. Considering the economic and transport dimensions of the material exchanges would add a significant layer of complexity to the analysis, and while we think it would be profitable to expand inquiry in that direction, we exclude it at this point. Second, by aligning the scope with the boundaries of the district, our results are well packaged for district officials who are responsible for local infrastructure, and it is easy to appreciate how the benefits of the material exchanges would trickle up to the regional level.
We also restrict our scope to the formalized industrial sector of the district, excluding potential material exchanges with agriculture, food processing, construction, and household consumption, as well as the informal economy. This is mostly due to data limitations, but adding these industries would be an important extension for future industrial symbiosis potential research, given that the industrial sector accounts for only around 30% of economic activity, and a substantial amount of that is informal. Agriculture, food processing, and construction play significant roles in IS in other studies, and the informal economy, although understudied in this context, is likely to be important given its large share of total economic activity and importance to recycling. For some India-specific industries, such as agrabathi (incense) production, we modeled the process based on the closest equivalent for which input–output data was available (in this case, charcoal briquette production). This highlights the importance of more life cycle research in emerging market countries.
Finally, we focus specifically on materials more than energy or heat exchanges. We do consider energy generation from biomass waste streams, in particular wood waste, however we find larger environmental benefits to reusing the wood in other exchanges. In line with the IS literature, we define industrial symbiosis potential as compared to an imaginary baseline where no material exchanges take place.
Methodology
We use a combination of public, private and subscription data sources to derive Mysuru's industrial symbiosis potential including a list provided by the Karnataka state government of industrial and manufacturing establishments in Mysuru. The data listed each facility's name, address, relative size (small, medium, large), products, amount of total invested capital, and operational status—open or closed. In total, the data described ∼1000 currently operating industrial establishments producing ∼400 unique end-use products. As noted above, the data do not include agriculture, food processing, construction, or informal sector businesses. Mysuru has a fairly diverse industrial base (figure 3), including the plants of several large automakers and tire manufacturers, as well as hundreds of smaller firms in dozens of industries from brick manufacturers to metal refiners.
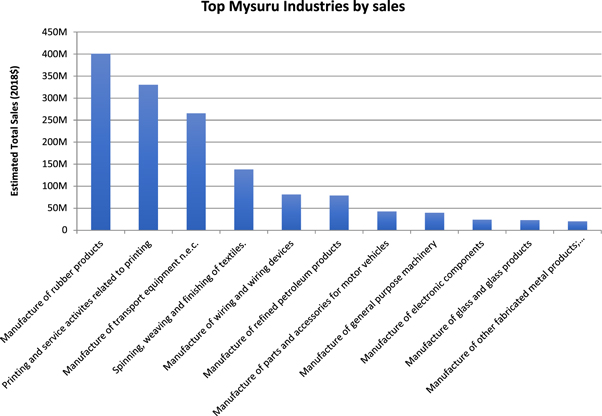
Figure 3. Mysuru's top industries by sales.
Download figure:
Standard image High-resolution imageUsing the description of each establishment's primary end-use product (i.e. cement, glass, tires), we matched each observation to a National Industry Classification code (NIC) and a National Product Classification Code (NPC) in India's Annual Survey of Industries (ASI) microdata for Karnataka (Government of India 2014). The ASI data contain production quantities and revenues for a representative sample of formal industrial firms in Karnataka, allowing us to translate an estimate of firm output into a production quantity.
We also matched each end-use product to a LCI unit process in the Ecoinvent 3.4 database using the cutoff system allocation model (Wernet et al 2016). LCI unit process data give the quantities of material and energy used to produce a reference unit of a given product, as well as the byproducts produced. For example, the LCI data would show that 1 kg of stainless steel would require a certain quantity of water, energy, pig iron, and other chemicals, while producing slag and dust as byproducts. We used the Brightway 2.0 package for Python in Jupyter Notebook for accessing the data and performing all LCA calculations described below (Mutel 2017).
The combination of the ASI data and the LCI data allows us to estimate the total amount of each byproduct available in the district. First, we create an estimate of the production mass for each establishment. While the ASI contains data on production masses, the finest level of disaggregation is by state. The Karnataka government data is broken out by district, and even finer geographies, making it better suited for IS research. However, it only has data on capital investment. We turn this into an estimate of production mass using the formula:

where Y is the production mass of firm i in industry j producing product k. K is the capital investment taken from the Karnataka government data, S is an industry specific capital-to-sales ratio calculated from the ASI summary data by dividing total industry sales by total industry capital, both of which are observed. Q is a product-specific sales-to-quantity ratio. This is calculated from ASI microdata for Karnataka. C is a product specific conversion factor converting the quantity units in the ASI microdata to the unit process units in Ecoinvent—for example kilograms to tonnes or a measure of volume to a measure of mass, depending on the case.
From Y we can directly calculate the total input requirements and byproducts produced for each firm in Mysuru by simply scaling the LCI unit process data to the firm's production mass (see figure 4). Following the steps laid out in figure 2, we then aggregate the total mass of byproducts produced across all the firms in the data. We end up with 64 distinct byproducts. By far the largest quantity is hazardous waste, with 180 thousand tonnes—45% of all byproducts—but no symbiosis applications. Figure 4 shows the quantity of the other most abundant byproducts. Interestingly, a large percentage are produced by small firms, showing the importance of IS initiatives that target small and medium enterprises.

Figure 4. Byproducts produced by industries in Mysuru, by size of firm. Byproduct names come directly from Ecoinvent 3.4. Firm sizes are defined by amount of invested capital: small firms have less than INR 20 million, and medium firms less than INR 50 million.
Download figure:
Standard image High-resolution imageFor each byproduct, we reviewed the IS literature for any documented examples of exchanges using that material. A complete list of all exchanges we considered is in supplementary material. There are 149 different exchanges, because certain byproducts can be used to substitute for multiple different inputs—for example waste concrete can be processed to substitute for sand, gravel, or other types of minerals in certain applications.
From here the matching algorithm is simple. All potential exchanges are ranked, in this case, we prioritize the exchanges based on life cycle CO2e abatement, but one could optimize for other criteria, for example to save on landfill space or water usage. Each byproduct is first applied to the highest impact exchange. If there is sufficient byproduct available to fulfill all of the demand for that input, the remaining byproduct is applied to secondary or tertiary exchanges.
Results
Our calculations show that 83 000 tonnes of industrial byproducts could be reused in industrial symbiosis within the district of Mysuru annually. This is equivalent to 21% of all byproducts produced in the district by mass—or 38% of total by-products when we exclude the unusable hazardous waste category. Based on the same method, we find IS could divert 22 million liters a day of wastewater. These percentage estimates of symbiosis potential are in line with actual levels of symbiosis found in an earlier study of the Nanjangud industrial cluster in the Mysuru district, where interfirm symbiosis activities reused just under 20% of the total mass of byproducts produced in the cluster (Bain et al 2010). While scaling symbiosis beyond the confines of an industrial park to an entire district creates new challenges, the fact that material availability is in line with previous estimates gives confidence in our algorithm.
To put these numbers in context, 95 000 tonnes of solid waste is collected and landfilled each year in Mysuru City, much of which is organics or aggregates, both of which have IS applications (Chandra and Devi 2009). Therefore, the potential for byproduct reuse in the district is nearly 90% of the annual landfill capacity of Mysuru City. This clearly shows how IS could alleviate pressure on a city's infrastructure, in this case by forgoing the need to nearly double landfill capacity. Similarly, 22 million liters of wastewater represents 14% of the total treatment capacity of Mysuru City. Thus, IS could significantly ease capacity constraints on wastewater treatment facilities.
In addition, we conduct a LCIA of Mysuru industrial production with symbiosis compared to a no-symbiosis baseline. The LCIA uses the total material and energy requirements from the LCI data for the firms in our dataset and calculates associated emissions. Then it repeats the calculation but subtracts the need for disposal of byproducts that could be used in symbiosis and the upstream impacts associated with the production of virgin materials that could be substituted for with locally produced byproducts. The difference in impacts between the two scenarios is the potential impact of industrial symbiosis.
We find that, compared to the no-symbiosis baseline, the symbiosis scenario would reduce annual lifecycle CO2e emissions by 74 000 tonnes, equivalent to taking 16 000 cars off the roads, and reduce PM10 emissions by 100 000 kg, resulting in significant health benefits. We recognize that these numbers might be higher than what could actually be achieved, given that they assume no symbiosis is currently occurring in the district. Also, many of these reductions would occur upstream, not necessarily within the district. Still, these numbers show that industrial symbiosis clearly has significant health and climate co-benefits. Table 1 shows several of the most impactful exchanges, based on CO2e emissions averted. Figure 5 shows the network of the 100 largest potential inter-industry material exchanges in Mysuru—allowing for a visualization of which industries are connected to each other, as well as the direction of the potential material flows.
Table 1. Most impactful exchanges by CO2e reductions.
| Exchange | Local by product available (MT) | Local input demand (MT) | Kg CO2e averted/kg of input | Total CO2e potential reduction (MT) | Kg PM10 averted/kg of input | Total PM10 potential reduction (MT) | Demand industries | Byproduct producers |
|---|---|---|---|---|---|---|---|---|
| Polyethylene, low density, granulate from waste plastic, mixture | 67 545 | 16 098 | 2.1 | 32 547 | 0.000 85 | 13 151 | Beverages, synthetic fibers | Electric motors, generators, wiring |
| Cotton fiber from waste textile, soiled | 4535 | 40 627 | 3.4 | 15 398 | 0.0087 | 39 482 | Textiles, apparel, material recovery | Textiles, apparel, material recovery |
| Clinker production from waste cement, hydrated | 16 236 | 7775 | 1.0 | 4934 | 0.000 86 | 4168 | Non-metallic minerals | Waste treatment and disposal |
| Nitrogen fertilizer, as N from poultry manure, fresh | 1043 | 382 | 10.9 | 4090 | 0.014 | 5253 | Rubber products, basic chemicals, fertilizer | Food products |
| Polystyrene, expandable from waste mineral wool, final disposal | 867 | 827 | 3.5 | 2863 | 0.0033 | 2700 | Plastics, non-metallic minerals | Synthetic fibers, parts and accessories for motor vehicles |
| Sulfate pulp from waste paper, unsorted | 28 761 | 3887 | 0.6 | 2134 | 0.0031 | 12 153 | Paper and paper products, printing | Printing |
| Waste polyethylene, for recycling sorted from waste plastic, mixture | 67 545 | 12 580 | 0.2 | 2123 | (0.0012)a | (15 305)a | Material recovery | Electric motors, generators, wiring |
| Steel, unalloyed from scrap steel | 839 | 3571 | 2.0 | 1645 | 0.0076 | 6384 | Special-purpose machinery, structural metal products | Fabricated metal products |
aThe two negative values reflect that the emissions created from the treatment process are greater than emissions reduced from avoided production and disposal. Note that the difference between the two polyethylene exchanges is that in the former, waste plastic is substituting for virgin polyethylene, while in the latter, it is substituting for waste polyethylene.

Figure 5. The network of potential inter-industry exchanges in Mysuru.
Download figure:
Standard image High-resolution imageFigure 6 below shows the percentage of district industrial demand for a variety of inputs that could be met through IS. It suggests that 100% of the local demand for at least 7 materials (the first seven listed in figure 6), and significant percentages of several other materials could be met through IS. Together, these charts show the usefulness of our algorithm for planning local circular economy initiatives by targeting specific industries or material flows.

Figure 6. The percentage of local industrial demand for each input that could be met through industrial symbiosis. * Reflects an aggregation of similar inputs (i.e. aggregate/minerals includes sand, gravel, gypsum, and crushed limestone). Each color represents a different byproduct—the legend is not shown due to space constraints—but for example, 5 different byproducts could contribute towards aggregate/mineral demand (supplementary material).
Download figure:
Standard image High-resolution image
Discussion and conclusion
Our paper is an attempt to operationalize Chertow et al's definition of industrial symbiosis potential (ISP) as the sum of the wastes and byproducts from all of the industrial facilities in a defined area that could reasonably serve as resource inputs to other processes (2015). We develop an algorithm based on local economic and LCI data to quantify the industrial symbiosis potential of Mysuru District in India, in terms of mass of industrial byproducts, liters of wastewater, and lifecycle CO2e and PM10 emissions. The algorithm allows for disaggregation by industry, material flow, and optimization for various outcomes, making it a useful tool for city planners to target specific high-impact material exchanges. Furthermore, it would be easy to apply in other contexts, and it relies on readily available data sources.
Using this algorithm, we can answer our first question from the introduction—what amount of local demand could be replaced with locally available byproducts? We can also address question 3—to what extent could IS extend local infrastructure in terms of landfill capacity and wastewater treatment? We found that Mysuru's symbiosis potential is equivalent to 38% of the mass of non-hazardous industrial byproducts produced in the district. This represents 90% of the total annual landfill capacity and 14% of the wastewater treatment capacity of Mysuru City. Waste management and water treatment are often two of the largest budget items for many local governments (Hoornweg and Bhada-Tata 2012), so finding ways to promote IS in the private sector could potentially save significant sums of money for the local government or at least be able to support new enterprises and new housing with the reserved capacity.
In terms of emissions, Mysuru's industrial symbiosis potential corresponds to possible reductions of 74 000 MT of CO2e and 100 kg of PM10 annually. Thus, it is clear that the benefits from IS can accrue to entire cities and surrounds, by increasing the capacity of infrastructure, potentially forestalling the need for new investments, and creating health and climate co-benefits as found through the LCIA calculations described above.
Furthermore, we are able to answer question 2—among which industries can these exchanges be facilitated? If a local planner is attempting to optimize for CO2e reductions, it appears from table 1 that industries with a lot of plastic waste—such as manufacturers of electric motors, generators, and wiring—should facilitate exchanges with the local beverage and synthetic fiber industries, that might be able to use some of that material. From the network diagram, we can see that the wiring industry is actually the most connected in terms of potential exchanges with other industries. Private sector leaders could also use our results to see what percent of their input needs could be met through IS, as shown in figure 6.
This raises the question of whether it would be good policy for cities to subsidize IS. A new policy idea could be a waste feed-in-tariff, structured such that subsidized byproduct reuse would be based on public health benefits and savings on city infrastructure spending. For example, if a local firm committed to using a certain percentage of local byproducts as its feedstock instead of virgin material, the city will save on the need for landfilling. The city could potentially use a portion of those savings to subsidize additional material reuse. While optimal policy is beyond the scope of this paper, this is clearly a fruitful area for future research.
Other areas for further research include more detailed screening of the material exchanges for technological and economic feasibility. With a better understanding of the transport limitations for each exchange, it would be straightforward to expand the analysis to all of India and other countries as well. There is also an opportunity to expand the analysis to include missing sectors, especially agriculture, construction, food processing, and the informal sector, which would significantly increase the numbers.
Industrial symbiosis potential is calculated based on a no-symbiosis baseline, meaning that to whatever extent firms already use symbiosis strategies in Mysuru, the city is already experiencing those benefits. Another dimension for future research is to look at the possible exchanges we have found and discover to what extent they already exist, and, when they do not exist, determine what are the obstacles to their fruition. Our work makes this sort of exchange 'prospecting' much more tractable.