

Abstract
The 2017 Arctic Boreal Vulnerability Experiment Airborne Campaign (AAC) was one of the largest, most complex airborne science experiments conducted by NASA's Earth Science Division. Between April and November, the AAC involved ten aircraft in more than 200 science flights that surveyed over 4 million km2 in Alaska and northwestern Canada. Many flights were coordinated with same-day ground-based measurements to link process-level studies with geospatial data products derived from satellite sensors. The AAC collected data spanning the critical intermediate space and time scales that are essential for a comprehensive understanding of scaling across the ABoVE Study Domain and ultimately extrapolation to the pan-Arctic using satellite data and ecosystem models. The AAC provided unique opportunities to validate satellite and airborne remote sensing data and data products for northern high latitude ecosystems. The science strategy coupled domain-wide sampling with L-band and P-band synthetic aperture radar (SAR), imaging spectroscopy, full waveform LIDAR, atmospheric trace gases (including carbon dioxide and methane), as well as focused studies using Ka-band SAR and solar induced chlorophyll fluorescence. Targets of interest included field sites operated by the ABoVE Science Team as well as the intensive and/or long-term sites operated by US and Canadian partners.
Export citation and abstract BibTeX RIS

Original content from this work may be used under the terms of the Creative Commons Attribution 3.0 licence. Any further distribution of this work must maintain attribution to the author(s) and the title of the work, journal citation and DOI.
1. The ABoVE domain and acquisition strategy
NASA's Arctic-Boreal Vulnerability Experiment (ABoVE, above.nasa.gov) is a decade-long research campaign focused on the study of environmental change in the Arctic and boreal region of western North America and its implications for social-ecological systems (ABoVE Science Definition Team 2014). ABoVE science is driven by the question: 'How vulnerable or resilient are ecosystems and society to environmental change in the Arctic and boreal region of western North America?' To address this overarching question, ABoVE research is organized around six Science Themes that represent critical aspects of Arctic and boreal social-ecological systems: permafrost, hydrology, flora and fauna, carbon biogeochemistry, ecosystem services, and disturbance.
Airborne science is a key component of ABoVE. Airborne measurements have the potential to link field-based, process-level studies with geospatial data products derived from satellite remote sensing, spanning the critical intermediate space and time scales that are essential for a comprehensive understanding of Arctic system scaling issues (Vörösmarty et al 2010). Ultimately, we plan to merge airborne and satellite data products with terrestrial biosphere models, to scale data products and process variables across the ABoVE Study Area (figure 1) and the pan-Arctic.
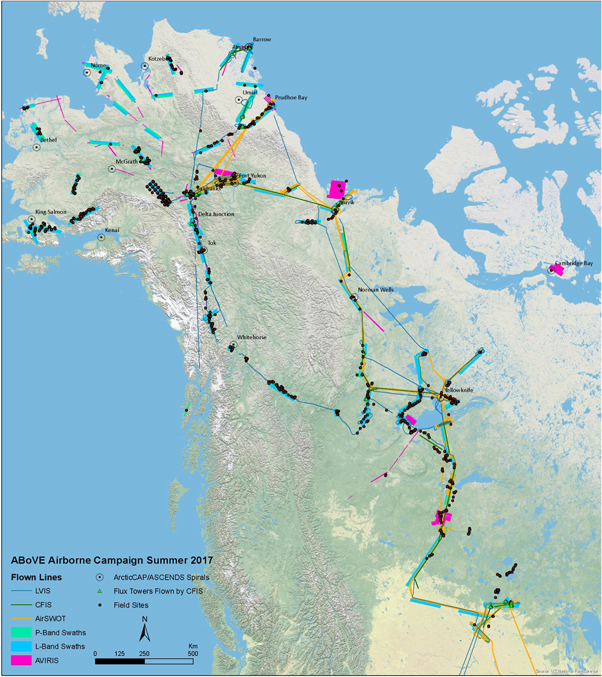
Figure 1. As-flown flight lines from the 2017 ABoVE Airborne campaign surveyed more than 4 million km2 of Arctic-Boreal North America, sampling critical ecosystems, gradients and bioclimatic zones. See https://above.nasa.gov/airborne_2017.html#2017 for additional details. For a full list of acronyms see https://above.nasa.gov/acronyms.html.
Download figure:
Standard image High-resolution imageUnderstanding the vulnerability and resilience of the socio-ecological systems in the ABoVE domain requires knowledge of ecosystem state properties, environmental controls, processes and dynamics across multiple space and time scales. The science questions, remote sensing, and integration and modeling tools used by ABoVE researchers will necessarily vary with the space and time scale(s) under consideration. Additionally, we expect the dominant processes and controls to vary across scales and for emergent properties to manifest themselves at larger space and time scales. One emergent property that is pervasive across the ABoVE domain is irreversibility: changes persist in new post-disturbance states even after the original forcing is restored (Higgins et al 2002). Microtopography controls many aspects of ecosystems, permafrost and hydrologic dynamics at site to local scales (<1 to ∼100 m). Landscape scale dynamics (100 m to 10 km) manifest in such ecosystem characteristics as habitats, disturbance patterns, lakebed history, and small watersheds. Meso- and regional-scale dynamics (10 to 1000 km) reflect the characteristics of ecoregions, bioclimatic zones and their gradients.
Sampling across time scales from hours to centuries is essential for ABoVE science and provides unique challenges. Processes that occur on time scales much longer than the 10 year duration of ABoVE—such as fire recovery, shrubby encroachment, permafrost degradation, peatland bog-fen evolution, etc—may be studied through chronosequences (i.e. across sites with similar attributes but of different ages) or by using space-for-time trades (e.g. using the landscape of Alaska's Seward Peninsula as a proxy for a future North Slope). Hourly, daily, seasonal, annual and interannual time-scale sampling will also be key to enabling ABoVE researchers to characterize fundamental processes, the differences between various forcings, and abrupt, discontinuous state changes due to disturbance events (Grosse et al 2011).
A key challenge for ABoVE researchers will be to develop models that accurately integrate the range of data acquired from field studies, airborne measurements, and satellite remote sensing (Fisher et al 2018). Approaches that enable both accurate upscaling and downscaling of ecosystem dynamics across the range of space and time scales of interest to ABoVE have heretofore proven elusive.
2. Sampling strategy
The ABoVE airborne science sampling strategy was designed to address the space and time scales of data acquired at ABoVE field sites and remote sensing observations returned from satellite instruments. The strategy must also deliver data that challenge models, particularly their scaling properties, and enable their improvement. The strategy must sample space, time, and biogeophysical gradients across the vast and diverse ABoVE Study Domain. Finally, the strategy must allow for multi-sensor retrievals and syntheses.
Targets of interest included field sites operated by the ABoVE Science Team as well as the intensive sites operated by the Department of Energy's Next Generation Ecological Experiment in the Arctic (DOE NGEE-Arctic) team on the Seward Peninsula and in Barrow, National Science Foundation's Long-Term Ecological Research sites at Toolik Lake (Arctic/North Slope) and Bonanza Creek (Boreal/Interior Alaska), the Canadian Cold Regions Hydrology sites in the Arctic tundra near Trail Valley Creek NT, the interdisciplinary science stations at Daring Lake NT and Scotty Creek NT, the Government of the Northwest Territories Slave River/Slave Delta watershed time series, the Kluane Lake (YT) Research Station, and numerous forest and fire disturbance plots maintained by the National Park Service, and the US and Canadian Forestry Services (Hoy et al 2018).
After careful consideration of the ABoVE science objectives and requirements, flight lines were developed for four NASA facility instruments: L- and P-band synthetic aperture radars (SARs), the Land, Vegetation, and Ice Sensor (LVIS) LIDAR, and the Next Generation Airborne Visible/Infrared Imaging Spectrometer (AVIRIS-NG). Detailed flight lines for each sensor were constructed to overlap the ground projections for each sensor while simultaneously maximizing field site sampling. The ∼12 km swath of the P-band SAR was used to anchor all flight lines. The L-band SAR (∼15 km swath) flight lines were designed with the requirement to maximize near-field overlap of the P-band and L-band swaths, while extending past the P-band swath in the far field. Flight lines for LVIS (∼1.4 km swath) and AVIRIS-NG (∼3.6 km swath) were slaved to the centerline of the P-band swath, except where deviations were required to capture critical ground sites.
The resulting flight lines span the ABoVE Study Domain and a diversity of Arctic and boreal ecosystem landscapes (figure 2). They feature intersection points at key infrastructure and field experiment sites, linking regional scale airborne observations with detailed studies from airborne observations focused on higher space-time resolution. The flight lines contain north-south and east–west transects that combine in 2 basic circuits:
- The Alaskan circuit features two north-south transects: the Western North Slope—Seward Peninsula—Yukon–Kuskokwim Delta transect and the Dalton Highway (Deadhorse—Toolik Lake—Fairbanks—Delta Junction) transect. These are connected via east–west transects that cover the transition from the boreal interior to the Bering taiga and sampling across the North Slope Arctic coastal plain. Fairbanks AK served as the base of operations for the Alaskan circuit.
- The Canadian circuit features an extended transect from the Inuvik–Tuktoyaktuk corridor and Mackenzie Delta south along the Mackenzie River Valley to The Great Slave Lake region and south to the Peace–Athabasca Delta and then to the BOREAS/BERMS sites in northern Saskatchewan. This circuit also contains an east–west transect that extends from Daring Lake NT across the tundra/taiga ecotone through the southern Northwest and Yukon Territories and onto Fairbanks AK. Yellowknife NT served as the base of operations for the Canadian circuit.
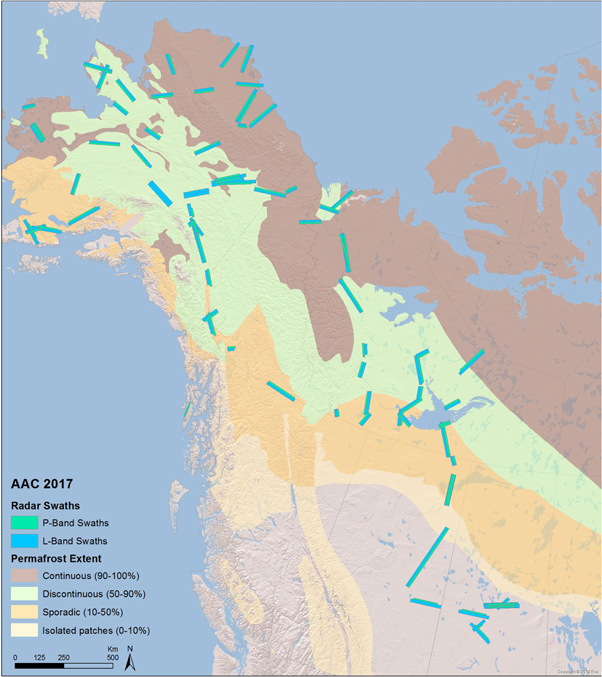
Figure 2. The SAR flight lines superimposed over a map of permafrost extent and type (Brown et al 2002) illustrates the AAC strategy for sampling within and across critical physical and climatological gradients. These data will test models for the full range of conditions from continuous permafrost to areas having only isolated patches of seasonally frozen ground.
Download figure:
Standard image High-resolution imageThe ABoVE Airborne Campaign (AAC) flight lines traverse important latitudinal and longitudinal gradients that control patterns of both precipitation and temperature. Additionally, data collected along these flight lines sampled across significant variations in both topography and soil characteristics that are, in turn, controlled by a range of geomorphological processes, including the impacts of glaciation and variations in surface deposition (e.g. alluvial, colluvial, and eolian processes). The variations in climate, topography, and surface geomorphology interact to control important variations in permafrost type and ice content. The variations in topography, geomorphology and permafrost interact to control important gradients in surface hydrology, including soil moisture and surface water inundation. These interactions result in a complex mosaic of terrestrial and freshwater ecosystems controlled by variations in surface hydrology, in particular landscapes where upland vegetation (forests, shrublands, and tundra) are interspersed with wetlands, peatlands, small ponds, and lakes. Furthermore, the flight lines produced airborne remote sensing data over gradients that are caused by disturbances, providing the opportunity to understand how these disturbances affect vegetation, permafrost and surface hydrology (soil moisture and inundation).
3. Sensors and payloads
The 2017 AAC featured ten different aircraft and their sensor payloads. A short summary of each and how it fits into the overall context of the AAC is provided below. We begin with the primary acquisitions done by NASA airborne facility instruments.
3.1. L-band and P-band SAR
Polarimetric SARs operating at wavelengths of 24 cm (L-band) and 70 cm (P-band) provided fundamental measurements for the 2017 AAC. Both SARs are sensitive to geometrical and material properties of vegetation, soil surface, and sub-surface profiles (Saatchi and Moghaddam 2000; Tabatabaeenejad et al 2015). The use of both L- and P-band gives enhanced sensitivity to near-surface (<5 cm, L-band) and root zone (10–40 cm, P-band) portions of the sub-surface profile compared to use of either wavelength alone. ABoVE researchers are also exploiting polarimetric interferometry and tomography data from both SARs to characterize surface deformation (Liu et al 2010, 2014, 2015; Iwahana et al 2016), active layer thickness (Liu et al 2012; Schaefer et al 2015), as well as above-ground biomass and vegetation canopy structure (Hensley et al 2014, 2016). Finally, the L-band SAR in particular provides key pre-launch ecosystem algorithm development and validation data sets for the NASA-ISRO SAR (NISAR, https://nisar.jpl.nasa.gov) mission (Rosen et al 2017).
A summary of the L-band SAR data acquisition for the ABoVE campaign and description of the data products may be found at https://uavsar.jpl.nasa.gov/cgi-bin/data.pl. ABoVE L-band data may be explored by selecting the 'L-band' box and using the keyword 'ABoVE' in the search window. ABoVE L-band SAR (UAVSAR) data products may be found at the Alaska Satellite Facility:
https://asf.alaska.edu/sar-data/uavsar/.
ABoVE P-band SAR data products may be found at https://uavsar.jpl.nasa.gov/cgi-bin/data.pl by selecting the 'P-band' box and using the keyword 'ABoVE' in the search window. See also 'Data Access and ABoVE Data Policy' following the Summary of this paper.
3.2. AVIRIS-NG
NASA's Next Generation Airborne Visible/Infrared Imaging Spectrometer (AVIRIS-NG) is an advanced imaging spectrometer that provides spectroscopic measurement in the range from 380 to 2510 nm with 5 nm sampling (427 spectral bands). Measurements in this spectral range provide access to the full set of molecular absorption and scattering properties of vegetation and support a range of terrestrial ecology science. AVIRIS-NG was installed aboard a Dynamic Aviation B-200 (N53W) during the 2017 AAC.
Spectral imagery and innovative data products from the original AVIRIS instrument (AVIRIS Classic or AVIRIS-C) have played a key role in NASA's Terrestrial Ecology Program since the Boreal Ecosystem Atmosphere Study (BOREAS) field campaign (Gamon et al 2004). The improved spectral resolution from AVIRIS-C/AVIRIS-NG provides finer definition of vegetation types and functional states than remote sensing based multi-band radiometers, enabling optical characterization of the chlorophyll red edge, leaf pigment content, leaf area index, etc. AVIRIS-C/AVIRIS-NG also enables the simultaneous retrieval of reflectance indices known to have specific physiological or structural significance. These include narrow-band formulations of the normalized difference vegetation index (an indicator of photosynthetic capacity of plant canopies), the photochemical reflectance index (an indicator of chlorophyll and carotenoid pigment levels, including xanthophyll cycle pigments), the chlorophyll/carotenoid index (an indicator of evergreen photosynthetic activity at multiple spatial scales) (Gamon et al 2016), and the 970 nm water band index (an indicator of canopy water content). Additionally, ABoVE Science Team members are leveraging recent advances in the use of AVIRIS-NG for methane retrievals (Thompson et al 2015; Frankenberg et al 2016a; Thorpe et al 2016a) to map natural and anthropogenic methane emissions across the ABoVE domain. ABoVE is the first opportunity to evaluate AVIRIS or AVIRIS-NG data products for northern high latitude ecosystems and significant improvements in AVIRIS-NG algorithms and classification schemes for tundra and taiga ecosystems are expected as a result of ABoVE investigations. See also section 3.4.4.
A summary of the AVIRIS-NG data acquisition for the ABoVE campaign and description of the data products may be found at the Oak Ridge National Laboratories Distributed Active Archive Center for Biogeochemical Dynamics (Miller et al 2018). ABoVE AVIRIS-NG data may be accessed via https://doi.org/10.3334/ORNLDAAC/1569. Additional information on AVIRIS data products may be obtained through the AVIRIS data portal https://aviris.jpl.nasa.gov/.
3.3. LVIS
NASA's Land, Vegetation, and Ice Sensor (aka the Laser Vegetation Imaging Sensor or LVIS, lvis.gsfc.nasa.gov) is an airborne, scanning laser altimeter which, when combined with aircraft position and attitude knowledge, produces topographic maps with decimeter accuracy and vertical height and structure measurements of vegetation (Blair and Hofton 1999; Blair et al 1999). LVIS is a pulsed laser altimeter and measures range by timing a short (<10 ns duration) pulse of laser light between the instrument and the target surface. The entire time history of the outgoing and return laser pulses is digitized using a single detector, digitizer and timing clock, and unambiguously describes the range to the surface as well as the vertical distribution of surfaces within each laser footprint.
LVIS' unique capability for measuring the sub-meter topography beneath boreal forest canopies is facilitating improved hydrologic modeling at the individual drainage basin level in complex peatland fen-bog systems that remain understudied (Langlois et al 2017). LVIS is also being used to quantify boreal forest structure and biomass, building upon previous work using LIDAR alone (Kristensen et al 2015; Margolis et al 2015) and LIDAR in conjunction with SAR (Montesano et al 2014) or optical imagery (Goetz et al 2010; Bolton et al 2015; Langford et al 2016). LVIS data are also being used to characterize the tundra-taiga ecotone (after Callaghan et al 2002a, 2002b) and as control data in pan-Arctic digital elevation maps derived from high spatial resolution imagery such as ArcticDEM (https://pgc.umn.edu). Finally, planning of the LVIS flight lines maximized overlap with the L-band, P-band, and Ka-band SARs as well as legacy LIDAR acquisitions in Alaska (e.g. Cook et al 2013; Jones et al 2015) and Canada (e.g. Bolton et al 2015) to maximize the potential of multi-sensor synergies and data fusion.
A summary of the LVIS data acquisition for the ABoVE campaign and description of the data products may be found at https://lvis.gsfc.nasa.gov/Data/Maps/ABoVE2017Map.html. ABoVE LVIS L1B Geolocated Return Energy Waveforms, Version 1 (Blair and Hofton, 2018a) and L2 Geolocated Surface Elevation Product, Version 1 (Blair and Hofton, 2018b) may be obtained from the National Snow and Ice Data Center via doi: https://doi.org/10.5067/UMRAWS57QAFU and doi: https://doi.org/10.5067/IA5WAX7K3YGY, respectively.
3.4. Additional sensors and payloads
Several other sensors and payloads contributed to the 2017 AAC. Acquisitions with these sensors generally focused on specific research questions or where the NASA Facility instrument data acquisitions were a secondary objective that complemented primary objectives centered on the development and use of innovative sensor technologies. We summarize these activities below.
3.4.1. Atmospheric CO2, CH4, and CO measurements: Arctic-CAP, ASCENDS and ATom
The Arctic-CAP investigation was designed to measure vertical profiles of atmospheric CO2, CH4 and CO concentrations to capture the spatial and temporal variability of carbon cycle dynamics (Sweeney et al 2015; Parazoo et al 2016; Zona et al 2016) across the ABoVE domain. Flights were conducted at ∼4 week intervals from April to November 2017 aboard a Scientific Aviation mooney Ovation 3 M20R (N617DH). Profiles were acquired from ∼6000 m to the surface at 20 different airfields whose locations were selected to complement regular long-term vertical profiles (Karion et al 2013; Sweeney et al 2015) as well as more intensive measurements recorded during the ABLE (Harriss et al 1992) and CARVE (Chang et al 2014; Commane et al 2017) airborne campaigns. Other locations were selected for their proximity to ground-based tall tower (Duglokencky et al 2011; AMAP 2015; Karion et al 2016) and eddy covariance flux tower (Euskirchen et al 2012; Ueyama et al 2013; Oechel et al 2014; Zona et al 2016; Helbig et al 2017) measurements.
Preliminary data products from Arctic-CAP data acquired during the 2017 AAC and may be explored via:
https://above.nasa.gov/profiles_/above_products.html?projType=product&projID=1091&progID=6. Interim L1 products are available. Archive is in progress.
Arctic-CAP flights were complemented by additional vertical profiles collected by the ASCENDS (Active Sensing of CO2 Emissions over Nights, Days, & Seasons) and ATom (Atmospheric Tomography) investigations. ASCENDS and ATom were on separate deployments aboard the NASA DC-8 and provided a limited number of valuable profiles from ∼14 km to the surface.
ASCENDS flights occurred from late July through early August and provided profiles complementary to Arctic-CAP in Alaska and Canada, and unique profiles over Kugluktuk NU and Cambridge Bay NU in the Canadian Arctic. Additionally, the ASCENDS flights acquired extensive CO2 LIDAR partial atmospheric column data (Abshire et al 2010) over boreal forests, tundra, and the Arctic Ocean, providing the first high latitude data for testing ASCENDS technology. Specifics of ASCENDS instrumentation are given in (Kawa et al 2018).
ATom flights occurred during the first and fourth weeks of October. The early October flight was based out of Anchorage AK and flew a round-trip transect that extended north from Anchorage across Alaska and over the Arctic Ocean to ∼80° N. The late October flight was the end of an extended transect that originated in Bangor ME, headed north over Quebec and the Canadian Archipelago, arced westward across the Arctic Ocean, then veered south acquiring a vertical profile over Deadhorse AK and landing in Anchorage. The Arctic Ocean data from these flights provided crucial spatial context for understanding the early cold season boundary layer CO2 and CH4 enhancements observed over land across the ABoVE domain. Specifics of ATom are available at http://espo.nasa.gov/atom/content/ATom.
3.4.2. AirSWOT
AirSWOT, the airborne analogue to the Surface Water and Ocean Topography (SWOT) mission, is a Ka-band SAR that delivers high-precision interferometric measurements of water heights to assess hydrologic flow in lake, river and wetland systems, and hydrologic connectivity in permafrost soils. AirSWOT flight lines were slaved to the center of the P-band SAR line to maximize overlap of its ∼4 km swath with the swaths of the L-band and P-band SARs, LVIS, and AVIRIS-NG to augment the AirSWOT interpretation. AirSWOT flights in Alaska in 2015 demonstrated 9.0 cm RMSE for AirSWOT measurements of WSEs when averaged over 1 km squared areas and 1.0 cm km−1 for slopes along 10 km reaches (Altenau et al 2017). Ultimately, it will be possible to validate lake water storage variations against storage changes computed from in situ water levels and inundation area derived from AirSWOT. Specifics of AirSWOT are available at airbornescience.jpl.nasa.gov/instruments.
Two AirSWOT data products are available at the Oak Ridge National Laboratories Distributed Active Archive Center for Biogeochemical Dynamics (Kyzivat et al 2018; Fayne et al 2019).
https://doi.org/10.3334/ORNLDAAC/1643 and https://doi.org/10.3334/ORNLDAAC/1646.
A summary of the Ka-band SAR (AirSWOT) data acquisition for the ABoVE campaign and description of the data products was given by Pitcher et al (Pitcher et al 2019). Additional information on AirSWOT may be found at https://swot.jpl.nasa.gov/airswot.htm and https://airbornescience.jpl.nasa.gov/instruments/airswot.
3.4.3. CFIS
The Chlorophyll Fluorescence Imaging Spectrometer (CFIS) provides airborne measurements of vegetation solar-induced fluorescence (SIF) to help fill the spatial gap between leaf- or canopy-level observations of SIF flux and extensive satellite footprints. CFIS is a high resolution (<0.1 nm) imaging spectrometer covering the 740–770 nm wavelength range and optimized for SIF quantification (Frankenberg et al 2016b; Sun et al 2017). CFIS was developed for validation of satellite SIF retrievals from the Orbiting Carbon Observatory (OCO-2) (Sun et al 2017) and has flown extensively in the Midwest US and Northern California.
Preliminary data products from CFIS data acquired during the 2017 AAC may be explored via: https://above.nasa.gov/profiles_/above_products.html?projType=project&projID=3569&progID=6.
3.4.4. NEON airborne observation platform (AOP)
The National Ecological Observatory Network (NEON) is a continental-scale ecological observation platform designed to collect and disseminate data that contributes to understanding and forecasting the impacts of climate change, land use change, and invasive species on ecology (Kampe et al 2010). The NEON Airborne Observation Platform (AOP) carries remote sensing instrumentation designed to achieve sub-meter to meter scale ground resolution, bridging scales from organisms and individual stands to satellite-based remote sensing (Thorpe et al 2016).
ABoVE AVIRIS-NG data were collected during near-optimal conditions in early July to permit cross-calibration of AOP and AVIRIS-NG data sets to facilitate extension of AOP data to larger spatial domains. Additionally, the ABoVE and NEON teams are exploiting the synergies from the LVIS, AVIRIS-NG, SAR, CFIS and Arctic-CAP acquisitions targeted over the NEON core sites. NEON AOP data are available at https://neonscience.org/data/airborne-data.
4. Results and discussion
We highlight here a few of the many results from the 2017 AAC to convey the interdisciplinary nature of the data and ongoing ABoVE research investigations. Detailed reports are being published separately by the payload teams and in synthesis studies undertaken by the broader ABoVE Science Team, several of which we expect will be published in this ERL Focus Collection of ABoVE research outcomes. All NASA-funded data products produced by the ABoVE field campaign will ultimately be archived, or accessible, through the NASA Earthdata Search Portal for ABoVE at https://search.earthdata.nasa.gov/search?fpj=ABoVE. For questions about data products or access, please contact the Oak Ridge National Laboratories Distributed Active Archive Center for Biogeochemical Dynamics at https://daac.ornl.gov/.
4.1. LIDAR imaging of boreal forest structure
The circumpolar boreal zone is one of the world's major biogeoclimatic zones, covering much of North America and Eurasia with forests, woodlands, wetlands, and lakes. It regulates climate, acts as a reservoir for biological and genetic diversity, plays a key role in biogeochemical cycles, and provides renewable resources, habitat, and recreational opportunities (Brandt 2009). The boreal zone covers about 627 Mha, or 29% of the North American continent, and airborne LIDAR has a proven record for enhancing the accuracy of forest inventories, especially when combined with ground-based observations. For example, Ene et al 2018, in conjunction with the Forest Inventory and Analysis program of the USDA Forest Service, demonstrated improved above ground biomass estimates using a probabilistic sampling design in the 138 566 km2 Tanana Inventory Unit in interior Alaska. LIDAR is also useful for extending structure and above ground biomass measurements into areas where few, if any, ground plots exist, e.g. unmanaged forest regions (Wulder et al 2012).
Figure 3 presents LVIS full waveform LIDAR data products for a 3 km × 8 km section of boreal forest near Delta Junction AK. The products include ground elevation (i.e. with the canopy stripped away), canopy height (expressed as RH 100, the vertical distance between the mean ground elevation and the highest detected LIDAR return) and surface complexity. Complexity indicates how many components are detected in the reflected waveform. Closer examination of figure 3 reveals canopy heights up to 25 m with the tallest trees distributed around the perimeter of the forested area. Note that the tallest trees do not have the highest complexity of the forested area in this image. These details complement the insights previously gained using space-based LIDAR (Lefsky et al 2005; Nelson et al 2009; Goetz et al 2010; Margolis et al 2015). Delta Junction was also the focus of both L- and P-band repeat pass tomography or tomoSAR acquisitions—this joint data set provides a unique opportunity with which to evaluate SAR and SAR + LIDAR boreal forest structure remote sensing (Sun et al 2011; Zolkos et al 2013; Urbazaev et al 2018).
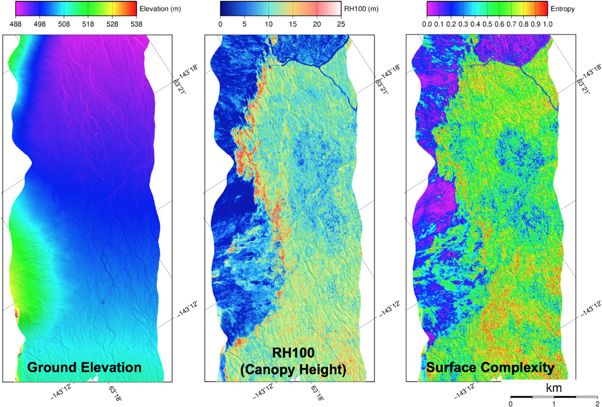
Figure 3. LVIS data products for a 3 km × 8 km swath of boreal forest near Delta Junction AK. Left: ground elevation. Middle: canopy height (RH100). Right: surface complexity. These products represent a composite analysis of acquisitions over multiple flight days. Note that the tallest trees concentrate along the perimeter of the forested area and the most complex surfaces are found for moderately tall trees in the lower right hand portion of the swath.
Download figure:
Standard image High-resolution imageLVIS sampling will also help elucidate transitional boreal forest structure across the tundra-taiga ecotone (see section 4.2), thermokarsting in disturbed tundra (e.g. section 4.3), and permafrost mapping in areas of discontinuous or sporadic permafrost. In fact, Whitley et al (2018) mapped permafrost distribution in the Yukon–Kuskokwim Delta with 94.9% accuracy using LIDAR and a simple elevation threshold model. LVIS acquisitions over coastal wetlands in the Yukon–Kuskokwim Delta will provide further insights into permafrost dynamics and change in these highly productive yet vulnerable ecosystems.
4.2. Characterizing the complexity of the tundra-taiga ecotone
The tundra-taiga ecotone stretches more than 13 400 km across the pan-Arctic. Regionally, it occurs as a south-to-north transition from forest through an area of forest with small patches of tundra, to tundra in which patches of forest occur, and then into treeless tundra (figure 4). This pattern is frequently complicated by east–west gradients generated by river valleys, bogs, uplands, etc, which confound the concept of a linear boundary—it is more accurately described as an interface area based on tree cover gradients (Callaghan et al 2002a).
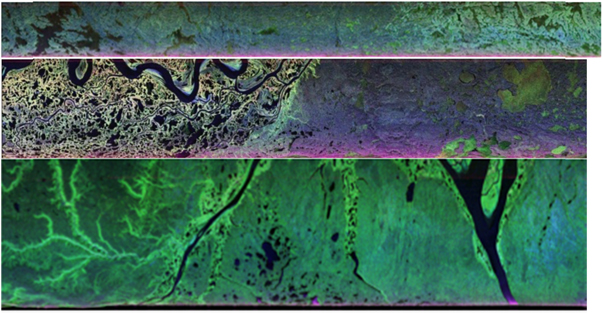
Figure 4. Top Panel (A): L-band SAR imagery of the tundra-taiga transition from the tundra near Daring Lake NT (left) toward the boreal forest surrounding the Great Slave Lake (right). Tree cover increases gradually over many tens of kilometres (Swath: daring_21405, flown on 6/14/2017). Middle Panel (B): P-band SAR image recorded near Inuvik, NT showing the dramatic transition from boreal forest and wetlands of the Mackenzie Delta (left) to the tundra of the Arctic Ocean coastal plain (right) occurring over just a few kilometres. Small oases of trees are observed deeper into the tundra and well removed from the tundra-taiga interface (Swath: tukhwy_01703, flown on 6/20/2017). Bottom Panel (C): L-band SAR image of the tundra-taiga interface at the southern edge of the Mackenzie Delta near Fort McPherson NT. The wetlands and boreal forest of the Delta (right) transition to the tundra of the Peel Plateau (left). Dendritic extensions of the treeline follow the drainage channels of the Peel Plateau, highlighting the complex nature of the transition zone in this region (Swath mcpher_05529, flown on 6/22/2017).
Download figure:
Standard image High-resolution imageThe tundra-taiga ecotone exhibits complexity that varies in space and time. Climatically, it separates the boreal forest to the south from the treeless and climatically harsh tundra to the north. Locally, differences in microclimate and hydrology due to microtopographic features (often on the scale of meters) produce complex patterns along the tundra-taiga interface. These include oases of trees within the tundra (figure 4, middle panel, right hand side) and dendritic patterns where the trees are restricted to river valleys flowing through the taiga into the tundra (figure 4, bottom panel). Temporal snapshots of the tundra-taiga interface mask the complex dynamics that have shaped, are shaping, and will continue to shape the interface (Callaghan et al 2002b).
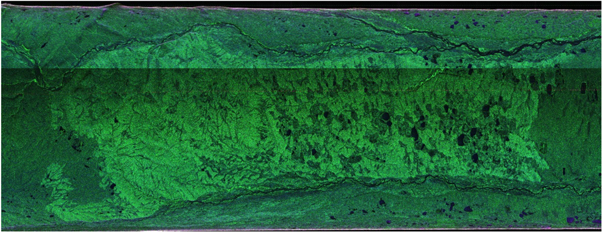
Figure 5. L-band SAR of the Anaktuvuk River fire scar reveals distinct differences in burned (lighter) versus unburned (darker) landscape 10 years post-burn. For reference, the scar is ∼100 km long and ranges from 10–15 km wide. L-band and P-band SAR will quantify near-surface soil moisture inside and outside the burn scar while interferometric SAR (InSAR) will help quantify thermokarsting and surface roughening across the burn area (Swath: anaktW_16405, flown on 6/21/2017).
Download figure:
Standard image High-resolution image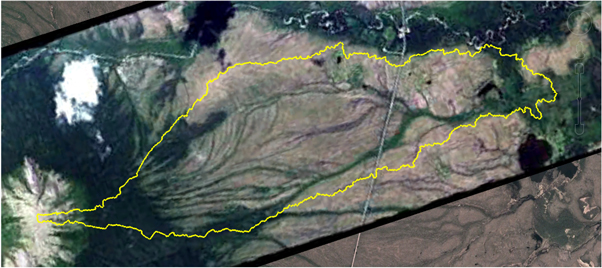
Figure 6. AVIRIS-NG imaging of the Council AK watershed. Airborne remote sensing data complement the extensive UAS and ground-based vegetation, hydrology and geophysical data collected by the NGEE-Arctic team to characterize this site (Image: ang20170713t015932_RGB, flown on 7/13/2017).
Download figure:
Standard image High-resolution imageThe 2017 AAC exploited the large swath widths (∼15 km) and long transects (up to 200 km) of the L-band and P-band SARs to quantify several variants of the tundra-taiga interface. Figure 4(a) presents a ∼200 km long transect that extends southwest from the Daring Lake Tundra Ecosystem Research Station towards the Great Slave Lake. The SAR image shows tree density increasing gradually over tens of kilometers until it reaches the edge of the continuous boreal forest. In contrast, figure 4(b) illustrates the abrupt tundra-taiga interface in the Mackenzie Delta near Inuvik NT where the forested wetlands of the Delta transition into sub-Arctic tundra in the space of a few kilometers. Figure 4(b) also shows small, isolated oases of trees in the tundra well separated from any continuous tree cover. Moving to the southern end of the Mackenzie Delta, one finds a complex tundra-taiga interface extending southwest from Fort McPherson onto the Peel Plateau (figure 4(c)). Here, fingers of tree cover penetrate from the Delta into the tundra along the drainage channels, with the penetration decreasing with increasing altitude and distance from the Delta. Finally, the airborne SAR data is being used to train and validate retrievals of tundra-taiga properties from RADARSAT-2 (Banks et al 2014) and other space-based SARs.
4.3. Interferometric measurements of post-fire tundra change
The 2007 Anaktuvuk River tundra fire burned more than 1000 km2 on the North Slope of Alaska. Burn severity mapping revealed that more than 80% of the Anaktuvuk River fire burned at moderate to extreme severity (Jones et al 2009). This disturbance transformed carbon and energy fluxes (Rocha and Shaver 2011a, 2011b), vegetation (Bret-Harte et al 2013), and accelerated thermokarst activity (Liu et al 2014, Jones et al 2015) within the fire scar. While large tundra fires are rare (Mack et al 2011; Jones et al 2013), their number is expected to increase under climate change (Mack et al 2011; Jones et al 2013; Veraverbeke et al 2017).
Complete L- and P-band SAR maps of the Anaktuvuk River fire scar were acquired during the 2017 AAC (figure 5). Lines were flown immediately after thaw and then again near maximum thaw depth, enabling the generation of subsidence maps, following the methods of Liu et al 2014 and Iwahana et al 2016. Increased surface roughness, thermokarst activity and pond formation are evident within the burn compared to unburned areas around the periphery. The 2017 AAC occurred 10 years after the Anaktuvuk River fire, capturing the onset of post-fire thermokarst formation, consistent with previous studies of thermokarst activity following tundra fires (Jones et al 2015).
LVIS and AVIRIS-NG north-south and east–west transects over the Anaktuvuk River fire scar were also acquired, providing complementary DEM, vegetation coverage, and productivity information. There were insufficient flight hours to acquire complete maps of the fire scar and adjacent undisturbed areas with LVIS and AVIRIS-NG, but that is a high priority for future work. Repeat mapping with airborne L- and P-band SAR and LIDAR will be key for evaluating the evolution of the fire scar landscape.
4.4. Imaging spectroscopy of arctic wetlands
The composition and distribution of vegetation across the major bioclimatic zones of the ABoVE domain provide critical information on the health and function of its ecosystems. Changes in vegetation and biomass will have important consequences for many components of the Arctic system including status of the permafrost, hydrological cycles, wildlife, and human occupation. There will also be important feedbacks to climate through changes in albedo and carbon fluxes (Walker et al 2005).
Similarly, wetlands, particularly in the High Arctic, provide the major vegetated areas in the cold, arid polar environment. Different wetlands have their unique characteristics, although peat accumulation is common. The peat cover insulates the wetland from summer heating and encourages permafrost aggradation, with the feedback that a shallow frost table reduces the moisture storage capacity in a thinly thawed layer, which becomes easily saturated (Woo and Young 2006).
During the 2017 AAC, AVIRIS-NG surveyed wetlands from the Arctic to the southern edge of the boreal forest. We highlight two examples where AVIRIS-NG mapping of entire watersheds will help to improve understanding of the processes controlling ecosystem function and strengthen collaboration with key ABoVE partners.
The Council AK watershed (figure 6) covers an area of ∼6.5km2 and is one of three Seward Peninsula watersheds intensively studied by NGEE-Arctic. This site offers a unique opportunity to study the impact of remote sensing spatial resolution on inferred ecosystem properties (e.g. albedo or productivity) from microtopographic to landscape scales using a combination of unmanned aerial system (UAS), airborne and satellite imagery. The ABoVE and NGEE-Arctic teams are also using this site to investigate the relationship between surface and sub-surface hydrology, vegetation distribution, and canopy water content.
The CHARS (Canadian High Arctic Research Station, https://canada.ca/en/polar-knowledge/constructingstation.html) Experimental Research area (ERA) on Victoria Island near Cambridge Bay NU (figure 7) covers an area of ∼2000 km2. The ERA was mapped to better understand vegetation-wetlands interactions in the high Arctic. AVIRIS-NG maps of the ERA establish an important baseline at the outset of research at CHARS and will complement the array of ground-based studies planned for the ERA. They will also augment the satellite imagery used to study its dynamics and evolution. The AVIRIS-NG data were acquired near the peak of vegetation productivity (early August) during one of the rare cloud-free periods in this region—persistent cloud cover is a major factor limiting the use of satellite remote sensing of the Arctic. As seen in figure 7, the AVIRIS-NG data reveal vegetation and productivity details in and around the myriad lakes in the ERA. The AVIRIS-NG spectra will also characterize vegetation composition, chemistry and water use.

Figure 7. A detail of the tundra wetlands in the CHARS Experimental Research Area (ERA) near Cambridge Bay, NU recorded by AVIRIS-NG in August 2017. Analysis of the AVIRIS-NG imagery for vegetation type and distribution will complement the intensive soil and hydrologic studies of the ERA (Images: ang20170803t210543_RGB, ang20170803t211654_RGB, ang20170802t200959_RGB, ang20170803t212759_RGB, ang20170803t213935_RGB, flown on 8/3/2017).
Download figure:
Standard image High-resolution image
5. Summary
The 2017 ABoVE Airborne Campaign surveyed over 4 million km2 in Alaska and northwestern Canada between April and November. The AAC acquisition strategy coupled domain-wide sampling with L-band and P-band SAR, AVIRIS-NG imaging spectroscopy, and LVIS' full waveform LIDAR, with more spatially and temporally focused studies using Ka-band SAR and solar induced chlorophyll fluorescence. Domain wide estimates of CO2 and CH4 fluxes inferred from atmospheric in situ measurements provide context for the process-oriented remote sensing observations. Preliminary results from the 2017 AAC illustrate the wide range of interdisciplinary science that these observations will enable. Future syntheses linking the airborne results with ground-based data from ABoVE, as well as other Arctic research efforts and partners, will significantly advance our understanding of the vulnerability and resiliency of Arctic-Boreal ecosystems to environmental changes already underway. Interested readers will find detailed technical analyses of the 2017 AAC data in separate papers throughout the ERL ABoVE Focus Collection.
5.1. Data access and ABoVE data policy
Researchers are encouraged to use NASA's Earthdata Search Portal for ABoVE to access data and data products from the 2017 ABoVE Airborne Campaign as well as ABoVE field work: https://search.earthdata.nasa.gov/search?fpj=ABoVE. The NASA Earthdata Search Portal for ABoVE will return all ABoVE products that have reached archive status at any NASA DAAC (Distributed Active Archive Center). For questions about data products or access, please contact the Oak Ridge National Laboratories Distributed Active Archive Center for Biogeochemical Dynamics (ORNL DAAC) at https://daac.ornl.gov/.
A complete listing of ABoVE ground sites and links to field measurements available for the 2017 ABoVE Airborne campaign are available via the ORNL DAAC (Hoy et al 2018): https://doi.org/10.3334/ORNLDAAC/1582.
Researchers wishing to use ABoVE data in their investigations are asked to contact the data providers directly and to follow the ABoVE policy for providing credit to data collectors: https://above.nasa.gov/implementation_plan/data_policy.html.
Acknowledgments
We thank our many Alaskan and Canadian colleagues who supported flight and ground operations during the 2017 AAC. We especially thank the aircraft flight and support crews from Armstrong Research Flight Center, Johnson Space Center, Wallops Flight Facility, Goddard Space Flight Center, the Jet Propulsion Laboratory, Scientific Aviation, Dynamic Aviation, and Twin Otter International who made the campaign a success. We also extend special thanks to Andrew Applejohn and Bruce Hanna (Government of the Northwest Territories) for their help and support in coordinating flights in the NWT. We thank Tim Hill (Alaska Aerofuel) and Bryan Laserich (Adlair Aviation) for outstanding FBO and logistics support. Our thanks to Bruce Tagg, Randy Albertson and the NASA Airborne Sciences team for their support. This research was supported by the NASA Terrestrial Ecology Program as part of the Arctic-Boreal Vulnerability Experiment (ABoVE). A portion of the research presented in this paper was performed at the Jet Propulsion Laboratory, California Institute of Technology, under contract with the National Aeronautics and Space Administration. Copyright 2018. All rights reserved.