

Abstract
The tropics have suffered substantial forest loss, and elevated deforestation rates have been closely linked to large-scale land acquisitions (LSLA). Having a timely and accurate understanding of global LSLA pattern will be critically important for concluding related policies and actions. Here, we investigate global LSLA networks and find that land acquisitions are characterized by dominant acquisition flows from the developing to the developed world (75.4%), and less of these flows are retained within the developing world (22.8%) or the developed world (1.8%). Policy-driven moratoria on existing LSLA are a key mechanism used to minimize global forest loss and recently employed in Indonesia, however their effectiveness remains unclear given a lack of quantitative synthesis. Based on a spatially-explicit temporal analysis of forest loss from 2001–2017, we find that, as a whole of Indonesia, the increased forest loss rate of 0.091 Mha yr−1 (2001–2011) slowed down to 0.001 Mha yr−1 (2012–2017) after moratoria established in 2011. Meanwhile, based on a comparison of annual forest loss in logging, timber, and oil palm concessions, we find that land concessions outside the moratorium experienced 35%–396% higher rates of forest loss than in comparable land concessions within the moratorium. Decreased forest loss from full implementation of moratoria on all land concessions could mitigate a maximum aboveground biomass carbon emission of 112 888 ± 24 766 Mg C yr−1, which is a nearly 41.89% reduction relative to the counterfactual scenario of no moratorium. These findings lend support for international cooperation and collective action to put into practice effective land moratoria to reverse decade-long trajectories of tropical forest loss.
Export citation and abstract BibTeX RIS

Original content from this work may be used under the terms of the Creative Commons Attribution 3.0 licence. Any further distribution of this work must maintain attribution to the author(s) and the title of the work, journal citation and DOI.
1. Introduction
The tropics house 44.2% of the world's forest cover (Hansen et al 2013) and store 228.7 Pg C in above-ground woody vegetation (Baccini et al 2012). These regions also suffer significant annual forest loss and degradation (Miettinen et al 2011, Baccini et al 2012, Hansen et al 2013, Baccini et al 2017), estimated at 71 546 km2 yr−1 (2000–2012) (Hansen et al 2013), which directly contribute to rising CO2 in the atmosphere (Baccini et al 2017). The consequences of such tropical deforestation are by no means restricted to the affected local or regional areas but have far reaching impacts on the global carbon cycle and climate systems (Miettinen et al 2011).
Over the past few decades, the global demand for agricultural commodities has become a significant driver of tropical deforestation (Meyfroidt et al 2010, Sabine et al 2015). For example, the production of four commodities (beef, soybeans, palm oil, and wood products) has been responsible for 40% of total tropical deforestation in Argentina, Bolivia, Brazil, Paraguay, Indonesia, Malaysia, and Papua New Guinea (Henders et al 2015). In the context of supply- and demand-side globalization, the role of large-scale land acquisitions (LSLA) in accelerating tropical deforestation has gained increasing attention (Gibbs et al 2015, Davis et al 2015c, Carter et al 2017). LSLA can be defined as large land transactions (≥200 ha) that entail a transfer of rights to use, control, or own land through sale, lease or concession (Nolte et al 2016). Under LSLA, investors can alter the landscape for their specific intentions (e.g. forest clearing for soy expansion (Gibbs et al 2015) or oil palm replantation (Koh et al 2011), and other agricultural and forestry intentions (Koh and Ghazoul 2010, Johansson et al 2016)) for a defined period of time, thereby leading to far-reaching and long-lasting influences on local ecosystems.
Previous studies have shown that LSLA are closely linked to elevated tropical deforestation rates in Southeast Asia (Carlson et al 2013, Busch et al 2015, Davis et al 2015b). In Cambodia, Davis et al (2015b) found that the annual forest loss within concessions was 29%–105% higher than in comparable lands outside concessions, with most concession forest clearing occurring after the land deal date. In the entire Kalimantan in Indonesia, nearly 90% of lands within government-allocated land leases that were converted to oil palm were formerly forested, and contributed 61%–73% of net oil palm emissions from 1990 to 2010 (Carlson et al 2013). Site-level deforestation rates in Indonesia were estimated to increase on average by 17%–127%, 44%–129%, or 3.1%–11.1% by granting land concessions for oil palm, timber, or logging, respectively (Busch et al 2015). The phenomenon of LSLA driven by agriculture, forestry, and multi-intention uses has therefore accelerated rapid land use transitions across the tropics and led to elevated deforestation rates.
In addition to the United Nations Programme on Reducing Emissions from Deforestation and Forest Degradation (REDD+) as an important climate change mitigation strategy (UN-REDD 2015), policy-driven moratoria on land concessions are increasingly implemented as a mechanism to reduce tropical forest loss due to LSLA. Policy intervention in Brazil decreased its deforestation rate from a 10 year average of 19 500 km2 yr−1 until 2005 to 5843 km2 in 2013: a nearly 70% reduction (Nepstad et al 2014). In addition, Brazil's Soy Moratorium (SoyM) signed in July 2006 contributed to a 5.7 fold decrease in annual deforestation rate (Kastens et al 2017), and dramatically decreased the deforestation for soy expansion in Amazonia from 30% to ∼1% between 2004 and 2014 (Gibbs et al 2015). Similarly, Indonesia instituted a nationwide moratorium on new land concessions for oil palm, timber, and logging activities on primary forest and peat lands (Busch et al 2015), and practiced it into force in May 2011 (Government of Indonesia 2011). The ability of policy-driven moratorium on LSLA to address this driver of deforestation remains unclear given a lack of quantitative synthesis at both global and national scales. To fill this knowledge gap, we conducted a comprehensive global analysis of LSLA networks that reveal patterns of targeted and investor countries and their origin-destination flows, and the sectors driving domestic and transnational LSLA. We then follow-up with a more detailed spatiotemporal analysis at the national scale, using Indonesia as a case study, to examine the impact of policy-driven moratoria on land concessions and to estimate their potential role in reducing tropical deforestation and mitigating greenhouse-gas emissions.
2. Data and methods
2.1. Spatiotemporal analysis of global LSLA
The Land Matrix launched in April 2012, is a global initiative that has built an evolving public database for monitoring LSLA to foster transparency and accountability in decision making over land deals and investment (Nolte et al 2016, Land Matrix 2017). For each land deal recorded in the Land Matrix database, there is general information on the target and investor countries, the land deal size (≥200 ha) and its intended land use, and the negotiation or implementation status. In this study, we collected the Land Matrix database containing 2412 full land deals (http://landmatrix.org/get-the-detail/database.csv?download_format=xls, accessed 28 April 2017). We excluded failed land deals and used all concluded and intended land deals (N = 2237) to analyze the LSLA spatial patterns. In total, 89 countries are the targets and 124 countries are the investors of LSLA. We calculated the sum of concession sizes of all land deals for each target country and for each investor country, and spatially assigned the aggregated results for a direct visualization of both the distribution of land-acquisitions and investors. We categorized all target and investor countries with respect to their income levels (low, low middle, upper middle, and high income) (World Bank 2013), and calculated the sum of concession sizes of all land deals accordingly.
Finally, we investigated the origin-to-destination acquisition flows from targets to investors to provide a deeper understanding of the land acquisition networks. Based on all concluded concessions between targets and investors in Land Matrix database (N = 1957), we grouped all target and investor countries by continental division and income-level, respectively, and then synthesized all land deals by these two divisions.
2.2. Land concession and moratorium data in Indonesia
In this study, we used the land concessions and moratorium boundaries collected and digitalized by Greenpeace to examine the effectiveness of policy-driven moratorium in Indonesia (http://greenpeace.org/seasia/id/Global/Seasia/Indonesia/Code/Forest-Map/en/data.html, accessed at 27 December 2017). Specifically, the moratorium boundaries (Greenpeace 2017a) are digitalized based on the 8th revised moratorium map on land concessions in 2015 from Indonesia's Ministry of Environment and Forestry. Land concessions include tree major types: selective logging concessions ('logging concessions' for short hereafter) (Greenpeace 2017c), wood fiber concessions ('timber concessions' for short hereafter) (Greenpeace 2017d), and oil palm concessions (Greenpeace 2017b).
2.3. Quantification of annual forest loss across Indonesia
Global Forest Change V1.5 (2000–2017) product (Hansen et al 2013) covering the entire Indonesia was downloaded from the Google Earth Engine cloud platform (http://earthenginepartners.appspot.com/science-2013-global-forest, accessed November 25, 2018). This product provides the year of gross forest cover loss event (i.e. layer = lossyear), which disaggregates the total 2000–2017 forest loss to annual increments. For the initially forested pixel (1 arc-second x 1 arc-second) that underwent deforestation in a given year, we assumed complete forest loss for that pixel in that year and all subsequent years. In addition, forest gain from 2000 to 2017 was not considered in the calculation of annual forest loss because the year of gross forest gain event was not reported at annual time scales. We obtained the forest cover map in 2000 (i.e. 'treecover_2000' layer) and the year of gross forest cover loss event (i.e. 'lossyear' layer) from the Global Forest Change V1.5 (2000–2017) product, and classified forest cover into forest and non-forest by applying a tree-cover threshold of 30% in light of the official definition of forest in Indonesia. The 'lossyear' layer was encoded with either 0 (i.e. no loss) or else a value in the range 1–17, representing loss detected primarily in the year 2001–2017, respectively. Thus, we calculated the total areas of pixels (1 arc-second x 1 arc-second) encoded from 1 to 17 to quantify annual forest loss from 2001 to 2017 for Indonesia, respectively. Because of the regular latitude/longitude-gridded products used in the analysis, the area of the grid cells varied with the latitude (ranging from 740. 42 m2 to 769.32 m2 for each cell's area in this study), and the actual forest loss area was computed as a projection-transformed summation. Specifically, the annual forest cover loss between the years 2001–2017 was quantified for Indonesia as a whole and by island group (Sumatra, Kalimantan, Java and Bali, Maluku, Papua, Sulawesi, and Nusa Tenggara).
2.4. Comparison of annual forest loss before and after concession moratorium
To assess the general effectiveness of Indonesia's LSLA policy measure, we first compared forest cover change before and after implementing concession moratorium. To detect the change in annual forest loss over the entire study period (2001–2017) and before and after implementing moratorium, a least-square linear regression model was first applied as follows:

where y represents the area of annual forest loss, t is year, a and b are the least-square fitted coefficients (a is the intercept and b is the trend slope), and ε is the residual bias.
The moratorium was first established in 2011 (Government of Indonesia 2011), and then extended in May 2013 and May 2015 each for an additional two years (Government of Indonesia 2013, Sapariah et al 2015). As of May 2017, the Indonesian government extended another 2 year moratorium protecting forest and peatlands for a third time (Reuters 2017). We therefore considered the temporal period of 2001–2011 as the scenario before moratorium, and the temporal period 2012–2017 as the scenario after the moratorium.
2.5. Comparison of annual forest loss within and outside concession moratorium
We further compared forest cover change in concession areas within and outside the policy-based moratorium in a counterfactual scenario. We overlapped the moratorium boundaries and the land concessions for selective logging activities, timber plantations, and oil palm plantations, and then extracted the areas within and outside the moratorium boundaries for each land concession type (see figure S1, available online at stacks.iop.org/ERL/14/044009/mmedia). This allowed us to quantify rates of forest loss for land concessions within the moratorium as well as for those land concessions not under this policy. Given that other factors, such as density of vegetation, relative remoteness, and land accessibility could also influence forest change rates (Geist and Lambin 2002, Davis et al 2015c), we employed the randomized pixel-based comparison to examine the difference in the physical vegetation coverage, climatic and water balance, slope, and accessibility to infrastructure within and outside the moratorium areas based on the Terra MODIS Vegetation Continuous Fields (VCF) product (Townsend and DiMiceli 2015), TerraClimate product (Abatzoglou et al 2018), Global Multi-resolution Terrain Elevation Data (Danielson and Gesch 2011), and the travel time to nearest densely-populated area product (Weiss et al 2018), respectively. We determined the statistical significance of difference within and outside moratoria in term of all these variables using a Z-test (see detailed descriptions in supplementary materials).
2.6. Carbon emissions with/without implementing concession moratorium in Indonesia
When forests are cleared, carbon stored above ground in leaves, branches, and stems will be released (Baccini et al 2012), thereby contributing to a direct source of CO2 to the atmosphere. To compare the difference in aboveground biomass carbon (ABC) emissions between scenarios with and without implementing land concession moratorium, we designed three scenarios: no moratorium, intermediate moratorium, and entire moratorium. For the scenario with no moratorium, we assumed that the rate of forest loss was equal to the deforestation rate estimated outside the moratorium for each land concession; for the scenario with intermediate moratorium (i.e. the current situation), we applied different rates of forest loss within and outside the moratorium for each land concessions; and for the scenario with entire moratorium, we assumed that the rate of forest loss was equal to the deforestation rate estimated within the moratorium for each land concession. The pan-tropical aboveground vegetation biomass carbon data (figure S2) was used as a reference for the ABC estimates in this study. More methodology details are provided in the supplementary materials, and a flowchart of our research framework is presented in figure S3.
3. Results
3.1. Global large-scale land acquisitions (LSLA) networks
Based on the comprehensive analysis of Land Matrix database, 89 counties are the targets of LSLA and 80.9% of these are located within the tropics and encompass 85.6% of the total land concession size (figure 1(a)). However, most land acquisition concessions lack transparency, with limited information on their geographies. Based on a handful of public released land concessions with detailed geographic coordinates (see supplementary materials, and figure S4), we find that land concessions frequently occur in dense forested areas, such as Amazon basin, Congo basin, and Indonesia. All target countries belong to low/middle income levels, of which 49.5% are low income level and encompass 58.8% of total land concession size (table S1). The majority of land-acquisition investors are from North America, Europe, Middle East, East Asia, and Southeast Asia (figure 1(b)). We find that 29.5% of investor countries are considered to be high income level and encompass 42.3% of total land concession size, while 70.5% of investors are within low/middle income levels and encompass the remaining 57.7% of the total land concession size (table S1).
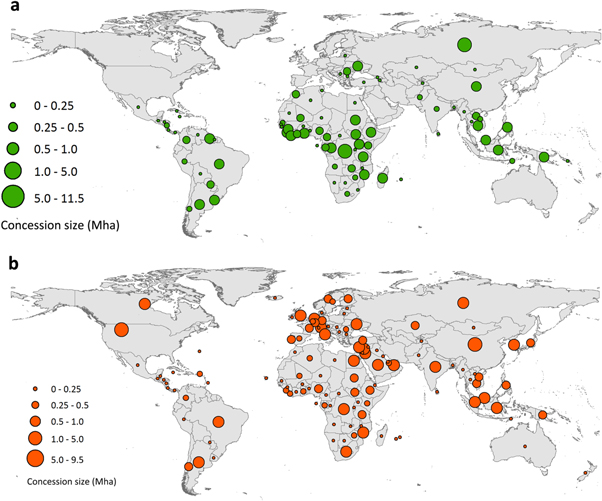
Figure 1. Land concession patterns. (a) Land concession size of target countries (denoted as green circles); and (b) land concession size grabbed by investor countries (denoted as orange circles). Each circle denotes the target/investor country's total concession size grabbed by/from other countries.
Download figure:
Standard image High-resolution imageGlobally, land acquisition networks tend to be characterized by dominant land grabbing flows from the developing world to the developed world (75.4%), with a smaller percentage of land grabbing flows within the developing world (22.8%) and the developed world (1.8%) (figure 2(a), tables S2–3), and from countries with lower income levels to higher income levels (figure 2(b), table S3). Europe, North America, East Asia, South Asia, and West Asia are the most common investors (figure 1(b)) while Africa, South America, and Southeast Asia are the most common targets (figure 1(a)). Based on concluded LSLA (N =1957), the top ten net investor countries in order of dominance are United States of America, Malaysia, Singapore, China, United Arab Emirates, United Kingdom, India, Liechtenstein, Saudi Arabia, and Canada (table S4). The most common intended land use of the LSLA is for agriculture and secondarily for forestry: with 59% and 17% for transnational deals and 58% and 23% for domestic deals, respectively (figure S5).
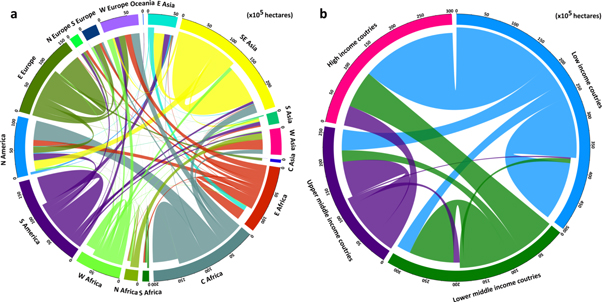
Figure 2. Global land acquisition network by grabbing flows from the developing world to the developed world (a); and by grabbing flows from countries with lower income levels to higher income levels (b).
Download figure:
Standard image High-resolution image3.2. Temporal trends in annual forest loss before and after moratorium in Indonesia
Based on a quantification of annual loss of forest cover from 2001 to 2017 across the entire country and by island group, we found that, as a whole, Indonesia experienced an average forest loss by 1.39 Mha yr−1 with an increased rate of 0.075 Mha yr−1 (figures 3, S6, table S5). Relative to the increased forest loss rate of 0.091 Mha yr−1 before the moratorium (2001–2011), it slowed down to 0.001 Mha yr−1 after the moratorium (2012–2017). This trend was partly consistent by island group (figures 3(a), S6), except for the Maluku, Nusa Tenggara, Papua, and Sulawesi islands. Additionally, a spike of forest loss rate was detected in the subsequent one-year after granting and renewing moratoria (i.e. 2012, 2014, and 2016). In 2016, however, Indonesia's forest loss increased to a new high rate of 2.43 Mha yr−1. This trend is consistent with a World Resources Institute's report (Mikaela and Elizabeth 2017, Hidayah et al 2018), due in part to the effects of late 2015 and 2016 El Niño (Field et al 2016), the second-strongest ever recorded, which brought drought conditions that triggering a strong fire season across the tropics (Field et al 2016). By excluding 2016 from the period after moratoria, we could still find a pronounced downward trend in annual forest loss from 2012 to 2017 especially for the entire Indonesia, Sumatra, and Kalimantan (figures 3, S6, table S5).

Figure 3. Annual forest cover loss during the period of 2001–2017, for Indonesia as a whole, and by island group (Sumatra, Kalimantan, Java and Bali, Maluku, Papua, Sulawesi, and Nusa Tenggara). Forest loss is shown across all lands irrespective of concession status.
Download figure:
Standard image High-resolution image3.3. Annual forest loss within and outside the concession moratorium in Indonesia
Given that land concessions span all of Indonesia, it is unrealistic to provide wall-to-wall comparisons of abiotic factors between all land concessions within and outside the moratorium. A randomized pixel-based comparison of vegetation coverage, climatic and water balance, slope, and land accessibility revealed that the majority of these widely-used abiotic factors did not statistically vary between land concession areas within and outside the moratoria (z < 1.96, and p > 0.05) (table 1), except for tree cover, non-tree vegetation, and actual evapotranspiration in logging concessions, and Palmer Drought Severity Index and travel time in oil palm concessions, and slope for timber concessions (table 1). Despite these small detected differences, the probability density profiles of all abiotic factors within and outside moratoria for each concession exhibited a similar distribution (figures S7–10), lending support for our comparison as a counterfactual to evaluate the effectiveness of moratoria on land concessions.
Table 1. Comparison of abiotic factors within and outside moratorium areas for logging, timber, timber and oil palm concessions in Indonesia.
| Category | Variable | Statistics | Logging_In | Logging_Out | Timber_In | Timber_Out | Palm_In | Palm_Out | Sample size |
|---|---|---|---|---|---|---|---|---|---|
| Vegetation cover | Tree_Cover (%) | Mean ± std | 61.42 ± 21.13 | 56.45 ± 23.11 | 53.38 ± 22.95 | 52.74 ± 22.83 | 70.57 ± 16.82 | 71.25 ± 15.53 | 2000 |
| Z-value | 7.09 | 0.89 | 1.32 | ||||||
| Nontree_Vegetation (%) | Mean ± std | 32.22 ± 19.05 | 35.17 ± 20.50 | 37.83 ± 19.68 | 38.86 ± 21.08 | 24.52 ± 16.34 | 24.31 ± 15.27 | 2000 | |
| Z-value | 4.71 | 1.60 | 0.42 | ||||||
| Non_Vegetation (%) | Mean±std | 7.79 ± 5.59 | 8.14 ± 5.80 | 8.42 ± 5.80 | 8.78 ± 6.65 | 5.40 ± 4.70 | 5.34 ± 4.37 | 2000 | |
| Z-value | 1.92 | 1.82 | 0.45 | ||||||
| Climatic and water balance | AET (mm) | Mean ± std | 103.81 ± 7.29 | 105.22 ± 6.52 | 103.07 ± 6.26 | 103.67 ± 5.83 | 104.82 ± 5.34 | 104.58 ± 4.49 | 500 |
| Z-value | 3.23 | 1.57 | 0.77 | ||||||
| PDSI | Mean±std | 2.03 ± 1.77 | 2.13 ± 1.65 | 3.35 ± 1.76 | 3.17 ± 1.79 | 3.65 ± 2.07 | 3.22 ± 1.94 | 500 | |
| Z-value | 0.93 | 1.58 | 3.39 | ||||||
| PR (mm) | Mean ± std | 299.71 ± 72.58 | 306.23 ± 81.79 | 271.42 ± 50.64 | 272.19 ± 50.77 | 283.00 ± 56.89 | 281.59 ± 54.33 | 500 | |
| Z-value | 1.33 | 0.24 | 0.40 | ||||||
| RO (mm) | Mean±std | 194.23 ± 76.69 | 200.52 ± 79.22 | 166.25 ± 48.34 | 167.57 ± 49.80 | 178.39 ± 57.00 | 182.91 ± 55.97 | 500 | |
| Z-value | 1.28 | −0.43 | −1.27 | ||||||
| SOIL (mm) | Mean ± std | 54.62 ± 44.75 | 53.53 ± 43.30 | 93.90 ± 57.25 | 99.33 ± 62.37 | 84.70 ± 53.88 | 82.04 ± 47.78 | 500 | |
| Z-value | 0.39 | 1.43 | 0.83 | ||||||
| SRAD (W m−2) | Mean ± std | 182.81 ± 8.57 | 183.80 ± 8.67 | 179.62 ± 8.63 | 180.63 ± 7.94 | 180.42 ± 8.21 | 179.93 ± 7.33 | 500 | |
| Z-value | 1.81 | 1.91 | 1.00 | ||||||
| Topography | Slope (degree) | Mean ± std | 10.17 ± 8.49 | 6.89 ± 7.04 | 6.14 ± 7.42 | 3.07 ± 4.30 | 2.17 ± 4.27 | 2.18 ± 3.10 | 2000 |
| Z-value | 13.28 | 16.01 | 0.06 | ||||||
| Accessibility | Travel time (minutes) | Mean ± std | 771.47 ± 533.38 | 737.08 ± 576.74 | 309.87 ± 326.92 | 300.17 ± 292.77 | 356.54 ± 591.89 | 274.90 ± 328.30 | 1000 |
| Z-value | 1.38 | 0.70 | 3.81 |
Abbreviation note.(1) Logging_In (Logging concessions within moratorium); Logging_Out (Logging concessions outside moratorium); Timber_In (Timber concessions within moratorium); Palm_In (Timber concessions outside moratorium); and Palm_Out (Oil plam concessions outside moratorium);(2) AET (Actual evapotranspiration); PDSI (Palmer Drought Severity Index); PR (Precipitation accumulation); RO (Runoff); SOIL (Soil moisture); and SRAD (Downward surface shortwave radiation) at monthly averaging level in 2010.
For all three types of land concessions and in almost all years (2011–2017), we found that land concessions outside the moratorium experienced higher rates of annual forest loss than those inside the moratorium (figure 4). Specifically, the annual average rate of forest loss (2011–2017) within moratorium boundaries was 0.14% for selective logging, 1.63% for timber plantation, and 2.24% for oil palm plantation concessions; whereas it was 35% to 396% higher in comparable land concessions outside the moratorium (i.e. 0.69% for selective logging, 3.16% for timber plantation, and 3.03% for oil palm plantation concessions). During the first (2011–2013) and second rounds (2013–2015) of the moratorium, logging, timber, and oil palm concessions had forest loss rates that were consistently lower inside than outside the moratorium, except for oil palm concessions, whose forest losses within and outside moratorium appeared to be getting closer and even reversed from 2014 to 2016.

Figure 4. Annual forest loss rate within and outside moratorium. (a) The geographic distribution of land concessions within and outside moratorium boundaries; and (b) annual forest loss rate for land concessions within and outside moratorium from 2011 to 2017.
Download figure:
Standard image High-resolution image
3.4. Mitigated ABC emissions due to Indonesia moratorium
Based on the distributions and the uncertainty of the ABC densities for forested areas within each land concession (figure S11), we estimated that timber concessions contain the largest ABC density (301 ±16 Mg C ha−1), followed by logging concessions (292 ± 18 Mg C ha−1), and lastly oil palm concessions (280 ± 17 Mg C ha−1) (table S6). We then compared ABC emissions among the three scenarios: no moratorium, intermediate moratorium, and full moratorium (table 2). Implementing the full moratorium on all concessions during 2011–2017 is estimated to result in a decreased forest loss that would mitigate a total ABC amount of 112 888 ± 24 766 Mg C yr−1 (∼41.89% reduction) relative to the scenario of no moratorium. The accumulative mitigated ABC emissions could be 789 492 ± 173 462 Mg C (∼41.85% reduction). Similar to nationwide temporal trends of forest loss after implementing moratoria, we also found out that the reduction magnitude of ABC emissions gradually decreased from 57.96% to 26.85% during 2011–2016, and increased to 45.60% in 2017 (table 2).
Table 2. Estimated aboveground biomass carbon emissions from forest loss in land concessions with different-level moratoria.
| Logging concessions | Timber concessions | Oil palm concessions | ABC emissions (Mg C) | |||||
|---|---|---|---|---|---|---|---|---|
| within | 1085 | 229 | 1056 | |||||
| Total area (ha) | outside | 17 740 | 10 258 | 14 477 | No moratorium (Forest loss rate outside moratorium) | Intermediate moratorium (Forest loss rate within and outside moratorium) | Full moratorium (Forest loss rate within moratorium) | Reduction magnitude between with/without moratorium |
| Forest loss rate (%) | ||||||||
| 2011 | within | 0.07 | 0.92 | 1.78 | 262 408 ± 15 192 | 255 568 ± 14 787 | 110 305 ± 6 481 | 57.96% |
| outside | 0.41 | 3.19 | 3.20 | |||||
| 2012 | within | 0.14 | 2.27 | 2.52 | 364 726 ± 21 060 | 356 614 ± 20 579 | 188 951 ± 10 938 | 48.19% |
| outside | 0.69 | 4.69 | 4.11 | |||||
| 2013 | within | 0.07 | 0.94 | 1.21 | 202 249 ± 11 754 | 196 516 ± 11 412 | 86 146 ± 5 010 | 57.41% |
| outside | 0.41 | 2.29 | 2.47 | |||||
| 2014 | within | 0.15 | 2.16 | 2.70 | 295 968 ± 17 219 | 291 011 ± 16 922 | 193 857 ± 11 262 | 34.50% |
| outside | 0.72 | 3.30 | 3.50 | |||||
| 2015 | within | 0.18 | 1.58 | 2.75 | 252 140 ± 14 692 | 249 313 ± 14 524 | 179 373 ± 10 523 | 28.86% |
| outside | 0.86 | 2.77 | 2.70 | |||||
| 2016 | within | 0.23 | 2.41 | 3.46 | 326 987 ± 18 995 | 323 663 ± 18 798 | 239 200 ± 13 960 | 26.85% |
| outside | 1.19 | 3.85 | 3.22 | |||||
| 2017 | within | 0.14 | 1.14 | 1.28 | 182 630 ± 10 636 | 178 500 ± 10 389 | 99 351 ± 5 767 | 45.60% |
| outside | 0.58 | 2.02 | 2.00 | |||||
| Average(2011–2017) | within | 0.14 | 1.63 | 2.24 | 269 459 ± 15 641 | 264 326 ± 15 336 | 156 571 ± 9 124 | 41.89% |
| outside | 0.69 | 3.16 | 3.03 | |||||
| Sum(2011–2017) | within | 0.98 | 11.42 | 15.70 | 1 886 675 ± 109 521 | 1 850 781 ± 107 386 | 1 097 183 ± 63 940 | 41.85% |
| outside | 4.86 | 22.11 | 21.19 | |||||
4. Conclusions and discussion
In recent decades, the tropics have suffered substantial forest loss, and previous studies have revealed that LSLA is linked to elevated deforestation rates in a few specific regions (DeFries et al 2010, Gibbs et al 2015, Davis et al 2015c). In this study, we extend this research and show that global LSLA networks are mainly characterized by dominant land grabbing flows from the developing to the developed world (75.4%), with small percentages of land grabbing flows contained within the developing world (22.8%) or the developed world (1.8%). Land available for agriculture and accessibility were identified as key factors for counties being targeted for transnational LSLA (Carter et al 2017), and Nolte et al (2016) reported that globally most LSLA deals (∼80%) are for agriculture. When considering all concluded and intended land deals (and after excluding failed ones), we also find that the most common intended land uses of global LSLA is for agriculture and secondarily for forestry, of which 59% and 17% are for transnational deals and 58% and 23% for domestic deals, respectively. Land grabbing flows from the global South to the North and from the South to the South have been characterized in previous studies (Rulli et al 2013, Seaquist et al 2014, Carter et al 2017). Yet, we further reveal that domestic and transnational land acquisitions driven by investors in low and low middle income countries also make up a substantial proportion. For example, at least 40% overall, and over ∼50% of LSLA in Southeast Asia, are driven by investors from low and low middle income countries.
To better understand the role of policy-driven moratoria to mitigate forest losses on existing LSLA within a country, we measured forest cover change in Indonesia before and after concession moratorium using high-resolution forest change data and carbon-density mapping. Our results revealed that Indonesia experienced an average forest loss by 1.39 Mha yr−1 with an increased rate of 0.075 Mha yr−1 from 2001 to 2017. However, relative to the increased forest loss rate of 0.091 Mha yr−1 before the moratorium (2001–2011), it slowed down to 0.001 Mha yr−1 after the moratorium (2012–2017). This trend is consistent with other recent findings (Mikaela and Elizabeth 2017, Hidayah et al 2018). After excluding 2016 from the period after moratoria, a year with an extreme high rate of forest loss due to the exacerbated fires caused by the late 2015 and 2016 EI Nino events (Field et al 2016), the rates of forest loss may have shifted between the two time periods due to other events independent of the moratorium, such as the mentioned EI Nino events and fire burns, implementation of voluntary sustainability initiatives, and shifts of macroeconomic trends and commodity prices (Siegert et al 2001, Page et al 2002, Broich et al 2011, Assunção et al 2015).
Therefore, we further compared the rates of forest loss for logging, timber, and oil palm concessions, and found that land concessions outside the moratorium had 35%–396% higher forest loss rates than those inside the moratorium. We estimated that the decreased forest loss from implementing the entire moratorium on all the three land concessions would mitigate a maximum total amount of ABC emission at 112 888 ± 24 766 Mg C yr−1: a nearly 41.89% reduction relative to the counterfactual scenario without any moratorium. Full implementation of the forest moratorium would help Indonesia realize a 'green economy' and meet its aspirations to reduce its CO2 emissions by 29% by 2030 (Anderson et al 2016). Previous studies have identified deforestation, forest clearing and conversion are more likely to occur where agricultural profits and returns are higher, climatic and topographic conditions are more favorable with a convenient transportation and greater population (Ferretti-Gallon and Busch 2014). All these factors, in combination with potential leakage issues (Busch et al 2015), will impact the actual effectiveness of land moratoria under policy-driven intervention, and should be evaluated as risk factors during the implementation, surveillance, and coordination phases.
Our results, however, should be interpreted in light of certain limitations and uncertainties. First, our results are based on the Land Matrix database, which is increasingly being used in academic research to understand global LSLA networks given its spatial details and attributes of land deal activities (Rulli and D'Odorico 2013, Scoones et al 2013, Seaquist et al 2014, Carter et al 2017). While this database facilitates real-time tracking and monitoring of land deals from regional to global scales, it also has its limitations. For example, the Land Matrix database only records general information of land deals between the targets and investors without providing their detailed geographic coordinates or boundaries (see supplementary materials). Thus, the spatial extents of existing land concessions are unable to be located and tracked, which limits the ability of governments and international communities to attribute and assess the socio-environmental impacts of LSLA (Davis et al 2015b). Despite these uncertainties, the Land Matrix database is valuable for developing a science and policy agenda on the implication of LSLA globally (Rulli and D'Odorico 2013, Scoones et al 2013) and for investigating the spatiotemporal pattern of LSLA networks (as done in this study; and in (Anseeuw et al 2013, Davis et al 2015a, Carter et al 2017, Matrix 2017). Importantly, this database fosters wide public participation in updating, correcting, and improving its information to increase its accuracy over time. The use of crowdsourced data is invaluable, especially for land use activities that may be difficult to detect by satellite imagery and are often proprietary in nature (like land holdings). Second, although the majority of abiotic factors (i.e. vegetation coverage, climatic and water balance, slope, and accessibility) did not statistically differ between the areas within and outside moratorium, we did not control for all potential impact factors given the nationwide assessment in this study. Zooming into the details of specific land concession patches within and outside the moratoria in certain regions and controlling all possible factors using statistical matching approaches (Andam et al 2008) would be a next step towards this direction. Third, it should be noted that the carbon emission estimates represent the trade-off between over- and under- estimated total amounts of the mitigated carbon emissions. On the one hand, our estimates may be over estimates of the mitigated ABC emissions because we do not consider sequestration gains by forest gains and assume a 100% release of ABC (an approach that is consistent with Indonesia's forest reference emission levels submitted to UNFCC that do not account for forest gains in deforested areas in the emission calculation from deforestation MoEF 2016). On the other hand, the mitigated carbon could be even higher because we do not include below-ground carbon sequestration and losses in soil and other carbon pools when forests are converted to other uses. Despite these uncertainties, our results reinforce that effective moratorium is a promising mechanism to reduce LSLA driven forest loss. Our findings lend support for international cooperation and collective action to put into practice land moratoria to reverse decade-long trajectories of tropical forest loss.
Acknowledgments
This work was supported by the Ministry of Science and Technology of China under the National Key Research and Development Program (2016YFA0600104) and donations from Delos Living LLC and the Cyrus Tang Foundation to Tsinghua Univeristy, and was also supported by a project funded by the China Postdoctoral Science Foundation (2017M620739). The authors would like to thank three anonymous reviewers and the editor for providing valuable suggestions and comments, which have greatly improved this manuscript.