

Abstract
The heating of biomass under low-oxygen conditions generates three co-products, bio-oil, biogas, and biochar. Bio-oil can be stabilized and used as fuel oil or be further refined for various applications and biogas can be used as an energy source during the low-oxygen heating process. Biochar can be used to sequester carbon in soil and has the potential to increase crop yields when it is used to improve yield-limiting soil properties. Complex bio-physical interactions have made it challenging to answer the question of where biochar should be applied for the maximum agronomic and economic benefits. We address this challenge by developing an extensive informatics workflow for processing and analyzing crop yield response data as well as a large spatial-scale modeling platform. We use a probabilistic graphical model to study the relationships between soil and biochar variables and predict the probability and magnitude of crop yield response to biochar application. Our results show an average increase in crop yields ranging from 4.7% to 6.4% depending on the biochar feedstock and application rate. Expected yield increases of at least 6.1% and 8.8% are necessary to cover 25% and 10% of US cropland with biochar. We find that biochar application to crop area with an expected yield increase of at least 5.3%–5.9% would result in carbon sequestration offsetting 0.57%–0.67% of US greenhouse gas emissions. Applying biochar to corn area is the most profitable from a revenue perspective when compared to soybeans and wheat because additional revenues accrued by farmers are not enough to cover the costs of biochar applications in many regions of the United States.
Export citation and abstract BibTeX RIS

Original content from this work may be used under the terms of the Creative Commons Attribution 3.0 licence. Any further distribution of this work must maintain attribution to the author(s) and the title of the work, journal citation and DOI.
1. Introduction
Biochar is a carbon rich soil amendment produced from biomass by a thermochemical process, pyrolysis, or gasification [1]. Soil biochar applications have generated interest as a strategy for mitigating climate change by sequestering carbon (C) in soils, and simultaneously as a strategy for enhancing global food security [2–6] by increasing crop yields especially on degraded and poor quality soils [7]. There is evidence that the recalcitrant C in biochar has a significantly greater residence time compared to C in uncharred plant biomass [5, 8] suggesting that biochar application is a possible avenue for drawing down C from the atmosphere and stabilizing it in the soil [2, 9]. The alkalinity of biochar, its high internal porosity [10], and capacity to absorb cations, i.e., a cation exchange capacity (CEC), can increase soil nutrient and water holding capacity [11–13] without compromising soil conservation goals [5]. This can lead to increases in crop yields in less fertile and degraded soils which often coincide with high rural poverty [2, 5]. However, the ability of biochar to sequester carbon and alleviate soil limitations on crop yields depends on the biochar's properties, which are influenced by properties of the feedstock used to produce the biochar and by the production technology (pyrolysis/gasification technologies) [8, 14].
While there is no or little incentive for farmers to adopt most climate change mitigation practices, the potential yield increase following biochar application has made it a promising new climate mitigation strategy. However, the degree of adoption of biochar technology is closely tied to the farmer's costs and benefits [2]. Hence, in the absence of a carbon credit market, crop yield increase is the primary factor determining the economic viability of biochar applications [1, 15]. Farmers will have to weigh the cost of applying biochar—which usually happens in the first year—with the increase in revenue triggered by higher yields in subsequent years. Thus, the ability to accurately predict crop yield response to biochar applications is critical to the development of a viable biochar industry and to the design of incentive programs to enhance biochar adoption and C sequestration. Previous research suggests the need to match biochar type with soil type and management systems to optimize agronomic and environmental outcomes [6].
Crop yield responses to soil biochar applications are highly variable [8, 16, 17] indeed, yield responses reported in reviews have ranged from negative to positive due to variations in soil properties, biochar properties, and complex soil × crop × biochar × climate ×management interactions [8, 18, 19]. Based on 507 field studies assessing yield differences, only 25% showed a significantly negative or positive biochar effect (21.6% positive and 3.5% negative) on yields [8]. Other studies have reported minor increases in crop productivity with considerable variability [18] and small but statistically significant increases in crop productivity (either grain or biomass) from both pot and field experiments [19]. The key finding of those studies was large variability (from −28% to 89%) in yield response to biochar applications. Some research suggests that biochar may reduce plant growth and limit nutrient availability [2, 6, 19]. A recent global meta-analysis from 109 studies found that there is significant geographical variation in the yield response [6]. Although a global mean increase of 13% is reported, yields in the tropics (≤35th degree latitude) increase by approximately 25% whereas yields in temperate (>35th degree latitude) regions decrease by 3%.
The complex nature of biochar interactions with soils and crops as well as lack of clear understanding of mechanisms and interactions [20, 21] has led to reports with conflicting interpretations, even under similar conditions [19]. In addition, the large amount of missing data in the literature [22] including inconsistent reporting of soil and biochar properties [19] has made the prediction of crop yield response to biochar a very challenging modeling exercise [2].
In this study, we addressed the challenge of predicting crop yield responses to biochar applications by developing an extensive informatics platform for collecting, preprocessing and analyzing data, and large-scale spatial modeling. Several statistical procedures and informatics technologies were integrated to facilitate the interpretation and modeling of crop yield responses to biochar. We used probabilistic graphical models in our platform to study the causal relationships among different soil and biochar variables and model the yield response at a large spatial scale. These models are inherently capable of handling missing data [23] and accounting for uncertainty associated with observations [24, 25]. In this platform, we combined expert knowledge (for better defining the relationship among the variables) and data (for estimating the parameters of the model) to handle the complexity of our problem.
Probabilistic graphical models are commonly used in cases with incomplete datasets [26] and high uncertainty [27] which makes them a suitable candidate for the current status of biochar science. We hypothesize that building this platform using available peer-reviewed data will allow us to refine our understanding of biochar interactions with crops and soils. Furthermore, we hypothesize that our platform can help us make large scale predictions of regional average crop response to different types of biochar. Our main goal was to identify areas with high probability of crop yield response to biochar applications in the United States as well as the magnitude of those responses. Our outputs can significantly advance the science of biochar use in agriculture by identifying highly responsive areas and the reasons these regions are more responsive. Therefore, our main objectives were threefold:
First, we want to understand the relationships between soil and biochar properties associated with crop yield increase following biochar application. Second, we quantify the probability, magnitude, and location of positive crop yield responses following biochar application in the United States. Third, we identify regions with the highest increase in revenue over a 10 and 20 year period for three major crops. Our work also adds a geographic dimension to the literature by constructing GIS data showing the yield increase for cropland in the United States at specific locations.
2. Methodology
2.1. Data collection
We built our database on top of the raw data previously collected from a meta-analysis [2]. The original dataset was built upon 40 studies (published up to 2013) with 17 variables and 685 observations [2]. New peer-reviewed studies from both pot and field studies were found using academic search engines (Google Scholar, Web of Science, Scopus) and the same variables were extracted and added to the database. These search engines were searched using 'biochar AND crop productivity' OR 'biochar AND crop yield' keywords and the latest date for inclusion of the studies was 31 April 2016.
Among all studies, publications which examined the effect of biochar application on crop production (grain/biomass) were selected. We did not include studies or observations in the database if either biochar application rate or grain/biomass yield data were missing. In total, from the 63 new studies which met our criteria, 575 more observations were added to the database.
Soil organic carbon (SOC), sand, silt, clay content, CEC and soil pH were extracted from all studies to describe the chemical and physical properties of soils. Biochar carbon, nitrogen, ash content, pH, carbon-to-nitrogen (C:N) ratio, highest pyrolysis temperature (HPT), feedstock, and thermochemical process were variables extracted to account for differences in biochar type. Biochar feedstock was classified into woody, non-woody, and manure, while pyrolysis type was characterized as fast and slow.
In addition to soil and biochar properties, our model also included latitude and both N fertilizer and biochar application rates. Given that absolute yield is not readily comparable among studies, response ratio (RR) was used as the target variable [28]. The RR is defined as:

A positive RR indicates a positive yield response to biochar application, whereas a RR of 0 shows no change from control treatment. This variable also can be easily transformed back to percentage relative increase (RI) using  . Many key drivers of crop yields (e.g. soil N) particularly soil nutrient levels are not included in the database because nutrient availability does not perfectly correlate to total nutrient content in soil given spatially heterogeneous soil chemistry [2]. Therefore, it is expected to see smaller variability in the models estimation of RR compared to the observed RR.
2.2. Model development
A Bayesian network (BN) was used for modeling the yield response to biochar applications. BN models usually are made of qualitative and quantitative components. The qualitative component is a graphical model which represents how the variables are statistically dependent on each other; nodes indicate variables and arcs show dependencies. The quantitative component is the conditional probability distribution of a node xi (specified in the graphical model) on its parents  . Taking into account the conditional independence assumption (Markov condition), the joint distribution over all the variables xi for
  is equal to [25]:

which is the product of conditional distributions defined for each variable. When new evidence is introduced, it propagates through the BN and the posterior probabilities are computed. This is called an inference and it allows for detecting the change in the probabilities of some variables given a value for other variables [27].
In the current study, a hybrid BN model (a model that includes both discrete and continuous variables) was developed within the R environment [29] and by using the Bayes Server software [30]. The final design of the model's structure resulted in 84 parameters. The heterogeneity among crop species and other key drivers of yield that are not included in the model, convinced us to use the probability of yield increase P(RR > 0) instead of directly using estimated mean of RR; this inherently accounts for the variability around the average estimate of RR. Thereby, the estimated mean and variance were used to estimate P(RR > 0) and identify places with high probability of yield increase. We setup a repeated cross validation procedure with 250 iterations for training and testing our BN. In each iteration, the model was trained with 80% of the observations in the dataset and tested against the remaining 20% of observations. Predictions made by the BN were then compared with the previously developed statistical model [2]. Model efficiency (EF) and mean absolute difference (MAD) were used to compare the performance of these models as follows:


where Ym is modeled yield, YO is observed yield,  is the mean of the observed yield and n is the number of the observations. EF varies between
  to 1; EF = 1 represent the perfect match between modeled and observed data, whereas
  indicates an unsatisfactory model performance. Biochar properties were produced from common biomass feedstock materials such as corn (C), soybean (S), switchgrass (G) and hardwood (W) using both fast (F) and slow (S) pyrolysis engineering (hereafter designated as CS, CF, GS, SF, and WS). Details on biochars properties can be found in table 1.
Table 1. Chemical properties of biochar types used in this study. The pyrolysis temperature is 500 °C for all biochar types. Slow pyrolysis is used for biochar from switchgrass, and hardwood. For comparative purposes, we are reporting slow and fast pyrolysis properties for biochar derived from corn stover.
| Feedstock | pH | C (%) | N (%) | Ash (%) | CN (Molar) |
|---|---|---|---|---|---|
| Switchgrass (GS) | 9.9 | 71.0 | 0.88 | 15.2 | 94.1 |
| Corn, slow pyrolysis (CS) | 9.9 | 69.8 | 1.25 | 9.1 | 65.4 |
| Corn, fast pyrolysis (CF) | 8.4 | 52.4 | 0.46 | 37.0 | 134.4 |
| Soybeans, fast pyrolysis (SF) | 9.3 | 53.1 | 0.63 | 56.9 | 98.3 |
| Hardwood (WS) | 7.0 | 77.6 | 0.53 | 7.0 | 169.2 |
The final BN model was then projected onto all cultivated lands in the US based on the 2016 Cropland Data Layer (CDL) with 30 m × 30 m resolution [31, 32] using the Gridded Soil Survey Geographic (gSSURGO) [33] database for the five biochar types (table 1) and two application rates, i.e. 5 and 15 Mg ha−1. The gSSURGO database provides a wide range of soil properties in 10 m × 10 m resolution including all the variables required for our model [34]. A pixel in the map is considered cultivated if it is identified as cultivated in at least two out of the five years of CDL data. The gSSURGO database includes the heterogeneity of soil properties (as different compartments) for each pixel. In the current study, the most representative soil type was used to extract the basic soil properties.
3. Results
3.1. Analyzing the literature data
The estimated average RR to biochar showed a 12% increase for all studies in our database. A large variability in RR was also observed, ranging from −24.4% to 98%, with the interquartile range ranging from 0 to 21% (figure 1). Among all soil properties, clay content, SOC, pH and CEC showed a significant negative correlation with RR, while sand and silt content were positively correlated with RR. Yield response was invariant with nitrogen application rate, biochar ash content, and biochar pH. The HPT, biochar N, and C:N ratio showed a significant negative correlation with RR. Higher biochar C content was significantly correlated with a higher RR (figure 1). A linear model analysis revealed a minor (not significant) association between feedstock and crop type with RR while no direct association was found between thermochemical technology and RR. Note that we do not make any assumptions about the functional form of yield response to biochar application. The model predicts that the biochar application rate has a diminishing marginal effect on the yield response, i.e. the yield effect is higher with low biochar application rates and flattens out at higher application rates.
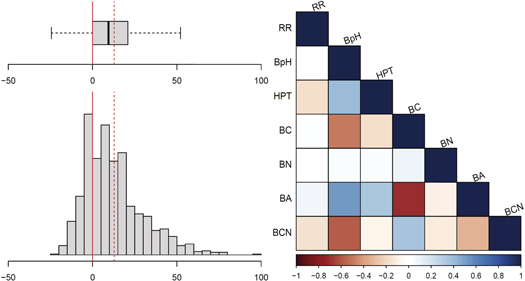
Figure 1. Left: estimated density plot of RR with the dotted red line representing the mean and the solid red line representing the threshold for no yield response to biochar application. Right: correlation matrix plot for RR with biochar properties: Biochar pH (BpH), highest pyrolysis temperature (HPT), biochar carbon (BC), BN: biochar nitrogen (BN), biochar ash (BA), and biochar C:N ration (BCN).
Download figure:
Standard image High-resolution image3.2. Large-spatial scale modeling
We compared our BN model and the only available statistical model for explaining the heterogeneity in yield response to soil and biochar properties [2]. The authors of that study used a generalized additive model (GAM) with 162 parameters to develop smooth functions mapping of independent variables to RR. In more than 250 iterations, the BN model consistently outperformed the GAM; as the BN model average EF and MAD values were 0.23 and 0.10, respectively, compared to −1.96 and 0.18 for the GAM. Negative EF implies that the observed mean is a better predictor than the model; and the positive average EF proves the merit of the BN and indicates that it can be used to explore different scenarios of soil and biochar properties within the scope of the training dataset. Given the proficiency of the BN model, spatially explicit analysis of response to biochar was explored for cropland in the US under different biochar scenarios. Figure 2 shows the estimated probability, magnitude, and expected yield increase for hardwood biochar and 15 Mg ha−1 application rate scenarios. We focus on locations that have a positive expected yield increase because farmer's will not apply biochar if the expected yield change is negative. This assumes that the only incentive for farmers to apply biochar is the yield increase.
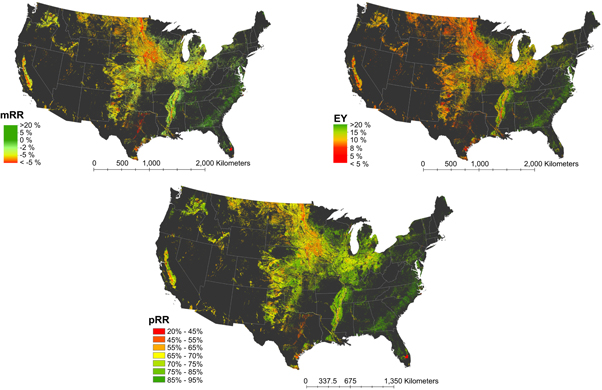
Figure 2. Estimated probability (pRR), response ratio (mRR), and expected yield (EY) increase for biochar derived from hardwood and an application rate of 15 Mg ha−1 (WS15).
Download figure:
Standard image High-resolution imageRegions known to have high soil quality (e.g. Des Moines lobe in north central Iowa) showed a low probability of having a yield increase under all biochar scenarios. Our model indicates a high probability of a positive RR in areas with highly weathered soils (e.g. Eastern half of San Joaquin valley in California). Yield response was predicted to be the lowest in areas with very high SOC, CEC, or soil pH such as those found in north Texas and Minnesota (figure 2).
Our results show the highest increase in expected yields of 6.43% for biochar derived from hardwood with an application rate of 15 Mg ha−1. The lowest increase increase of 4.69% was observed for biochar derived from soybeans at an application rate of 5 Mg ha−1. Assuming farmers with the highest expected yield increase are the first to apply biochar to the field, then minimum yield increases ranging from 8.8% (soybeans biochar at 5 Mg ha−1) to 11.4% (hardwood biochar 15 Mg ha−1) are necessary to cover 10% of crop area. A minimum yield increases ranging from 6.1% (switchgrass biochar at 5 Mg ha−1) to 7.9% (hardwood biochar 15 Mg ha−1) are necessary to cover 25% of crop area.
We estimated the total area where a 75% (or higher) probability of yield increase is expected for each scenario as well as areas where this is expected to be lower than 25%. This helped us identify the most and least responsive regions to biochar applications across the United States. Total high probability areas for biochar application range from 8.4% to 30% of total cropland in the United States. The slow pyrolysis hardwood biochar with an application rate of 15 Mg ha−1 was the scenario with the largest high probability area with 39.7 Mha, whereas fast pyrolysis soybean biochar with an application rate of 5 Mg ha−1 resulted in the lowest high probability area with 11.2 million ha. In general, for similar application rates, biochar produced from hardwood and corn stover resulted in larger responsive areas than switchgrass, while fast pyrolysis soybean biochar showed the lowest response. In low-quality soils, the higher application rate (15 Mg ha−1) resulted in a higher probability of a yield increase, whereas high quality soils showed no response to application rate.
We selected the Central Valley of California to assess the model's response to different soil properties under the slow pyrolysis from corn stover scenario with an application rate of 15 Mg ha−1. The Central Valley is an agricultural region drained by the Sacramento and San Joaquin rivers. It is about 82 kilometers wide and extends 600 km northwest from the Tehachapi Mountains to Redding. The southern part of the valley, also known as San Joaquin valley, is well-known for having highly variable alluvial soils ranging from very acidic-low organic matter soils to very alkaline-high organic matter soils. The BN model successfully captured the essence of our general understanding of crop yield response to biochar on high and low-quality soils. Yield response was the weakest in west side of the San Joaquin valley, which is dominated by soils with high clay, pH, CEC, and organic matter (figure 3). On the other hand, the old, highly weathered soils on the east side of the valley, which have low organic matter, CEC, and pH, showed the greatest response to biochar applications. The model's response was not attributed to just one variable, as all soil properties contributed to the estimation of yield response (figure 3). The total area with high probability of yield response to biochar application varied from 0.01 Mha for fast pyrolysis soybean biochar (5 Mg ha−1) to 0.6 Mha for slow pyrolysis hardwood biochar (15 Mg ha−1) which is approximately 1% and 15% of total cropland in the Central Valley, respectively.

Figure 3. Spatial variation of soil properties and probability of a yield increase for WS15 scenario in the Central valley of California. SOM: soil organic matter; CEC: cation exchange capacity; P(RR > 0): Probability of finding positive yield response to biochar application.
Download figure:
Standard image High-resolution image3.3. Economic aspects of biochar application
There are various economic aspects of biochar application such as expected revenue from applying biochar, cost of biochar application, commodity price effects of biochar-induced yield increases in the long-run, or potential revenue from the provision of environmental services (e.g. increased carbon sequestration and/or reduction in nitrogen leaching). For this case study, we focus only on the increase in revenue at the county level and the long-term effects on commodity prices. The differences in the expected yield increase between the 5 Mg ha−1 and the 15 Mg ha−1 biochar application rate is not sufficient to justify the higher application rate and thus, we focus on the lower rate. We assume that the application of biochar occurs in the first year and lasts for the remainder of the projection period, i.e., 10 and 20 years.
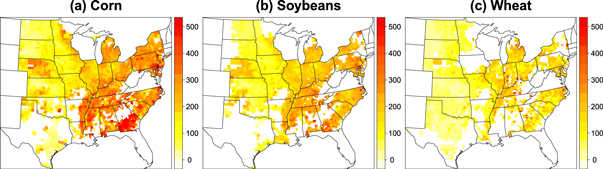
To determine the farmers' willingness to pay per ton of biochar, we calculate the net present value (NPV) of the additional revenue triggered by the expected increase in yield over a period of 10 and 20 years (figure 4). Table 2 shows the crop area covered under three different biochar prices over 10 and 20 years. If the yield increase due to biochar is limited to 10 years, the crop area covered is much smaller because the timeframe to recuperate the initial cost is shorter. Because we calculated the NPV per ton of biochar applied, the values in figure 4 represent farmers' willingness to pay per ton of biochar. The highest NPV is observed for corn followed by soybeans and wheat. The highest revenue increases are observed in the southeast for corn and the east for soybeans. Note that those areas do not coincide with large corn and soybean acreage. For wheat and soybeans, the revenue gains are more moderate compared to corn suggesting that the best use of biochar is its application to corn area.
Figure 4. Net present value of expected additional revenue ($ ha−1) from biochar-induced yield increase over 20 years per ton of biochar applied for the scenario CS5. Based on an assumed discount rate of 5%, yield projections (2016–2035), and long-term price projections for corn, soybeans, and wheat [35]. The results are similar for the scenario SF5.
Download figure:
Standard image High-resolution image
Table 2. Area (in million ha) covered with biochar for willingness-to-pay amounts of $200, $250, and $300 and a 10 and 20 years time horizon.
| 10 Years | 20 Years | |||||
|---|---|---|---|---|---|---|
| Corn | Soybeans | Wheat | Corn | Soybeans | Wheat | |
| $200 | 1.72 | 0.13 | 0.02 | 15.69 | 7.16 | 0.68 |
| $250 | 0.36 | 0.00 | 0.00 | 8.43 | 2.48 | 0.20 |
| $300 | 0.08 | 0.00 | 0.00 | 3.56 | 0.72 | 0.04 |
Large-scale application of biochar on US agricultural land will have long-term commodity price effects because the increase in supply will decrease prices. The decrease in commodity prices from the expected yield increase is about 7.5% and 7.6% for soybeans and corn, respectively and 6.3% for wheat based on an economic simulation model for US land-use change [36, 37]. An increase in commodity prices is observed when biochar-induced yield increase is compensated by land being taken out of food and feed crop production. At a biomass price of approximately $70 per dry ton ($4 GJ−1), we see an average increase in corn, soybean, and wheat prices of 6.3%, 10%, and 15.8%, respectively. At a biomass price of $4 GJ−1, our model estimates a biomass production of 117–119 million tons per year from both, corn stover and switchgrass under a low biomass production cost scenario and 87–89 million tons at a biomass price of $5 GJ−1 under high biomass production cost. The effect on commodity prices of biochar-induced yield increases is speculative but highlights one additional aspect of biochar application that can become important under large-scale deployment.
There is a wide range of biochar prices which is the reason why we report willingness-to-pay to avoid any cost assumptions. The biochar price is assumed to range from $87 to $351 per metric ton for farmers [38] but small scale manufacturing costs are estimated to be closer to $500 per metric ton [39].
4. Discussion
In contrast to other researchers [11, 18, 20] who found the greatest effect of biochar on coarse texture soils, we did not find a significant correlation between RR and sand content. Hence, our results are similar to those in the original database [2] and indicate a negative correlation with clay, SOC, soil pH, and CEC. That is, soils with lower values of those soil properties show a higher probability of yield increase after biochar application. For example, the pH of an acidic soil will rise following biochar application which likely results in increased microbial activity [22, 40]. This increases nutrient availability [18, 41] and reduces the mobility of toxic elements [42]. As a second example, biochar has a high capacity to retain nutrients and water and therefore there is a higher probability that biochar will help increase nutrient and water availability to crops grown in soils with low activity clays.
In contrast to the findings of [2, 18], we find evidence suggesting an association between RR and biochar properties such as C, N content, and C:N ratio. This might be due to the increase in total number of observations in our database which strengthened weak associations. HPT was closely associated with biochar C and C:N showing a negative correlation with RR, meaning that the lower the HPT the higher the C content in biochar and the higher the probability of a yield increase.
It was found that biochar from fast pyrolysis soybeans resulted in less area with a high probability of a positive response to biochar regardless of application rate, compared to other types of biochar. The reason for this difference in performance of biochars lies either in feedstock material or thermochemical process. Given that the model is only weakly sensitive to biochar ash content, the lower C content of the SF may have been the dominant factor influencing the small crop yield response to the SF biochar. Given that no additional N fertilizer was assumed to accompany biochar applications in our simulations, the relative sizes of the labile C pool in the biochar and the inorganic N pool in the soil are critical factors influencing N availability to crops and may cause large differences in crop yields for different types of biochar. The large variation in measured crop yield responses [8, 18, 19] and the probability of crop yield responses predicted by our model for different scenarios shows the importance of optimizing the selection of specific biochar types, application rates and management for achieving high probability of a positive crop yield increase.
Examining the model's behavior revealed that crop yield response to biochar was dominated by soil properties and that increases in biochar application rate resulted in higher probability of crop yield increases for soils with lower quality. The increase in probability is not sufficient to compensate for the additional cost of the higher application rate. In soils with PP < 0.25 (mostly high quality soils) there was no direct association between biochar application rate and crop yield response. Other research has also not found a clear relationship between productivity and application rate although they did not differentiate based on soil quality [18, 19].
Crop yields are strongly influenced by weather during the growing season and yield responses to biochar applications are expected to be strongly influenced by complex weather × biochar × soil × crop × management interactions. Therefore, the estimated yield increases, as a result of biochar application, predicted by our model are long-term (5–10 years) averages, which are attributed to improvements in soil physical and chemical properties. This is where other researchers have estimated a much longer time period for the biochar effect [43]. Our modeling approach is not appropriate the address persistence of biochar as a response variable/output but should persistence should be addressed in future research.
The BN developed in this study is computationally fast and accurate enough to be used for large scale modeling, nonetheless, our results have several caveats. For example, our understanding suggests that various management practices (such as residual removal, increases in N fertilization rates, etc), soil properties (such as inorganic N available in the soil), and biochar properties (such the size of labile C and N pools) are potential drivers of crop yield responses that are not explicitly defined in the model. Adequate data is currently unavailable in the literature to cover all possible soil-biochar interactions, and therefore the model focuses on available information. The inference domain of the models output is limited to the extent of the training dataset. However our model paves the way for the use of more computationally intensive process-based crop models by identifying regions, soil types, and biochar types with high and low probability of crop yield response.
Assuming a carbon sequestration rate of 0.59 Mg ha−1 yr−1 [43], we find that expected yield increases of 5.3%–5.9% would result in a biochar coverage of 50% of US cropland and resulting sequestration of 66.0–77.5 million Mg yr−1 or 0.57%–0.67% of US greenhouse gas emissions in 2016 [44].
A one-time application of 5 or 15 Mg ha−1 was the only option considered here; in the future other management options, such as annual co-applications of biochar with fertilizer, may need to be considered. Although the results of this study are not directly pertinent, the pattern of responsive soils identified are likely to be similar under different application scenarios. Future research may open up different pathways of biochar use that do not have to apply 5 or 15 Mg ha−1 of biochar but a lower amount (e.g. when used as part of a composite fertilizer) which would change the economics and very likely also the range of soils where it can be applied. If smaller amounts of biochar as part of a composite fertilizer can increase yields, it may even prompt farmers or farming regions to get their own pyrolysis unit, use the heat for greenhouses and the biochar for producing carbon fertilizers. Farmers may start to plant say hedgerows to get their own biochar at lower costs and create carbon credits while doing so, depending on the political decisions for future land use changes and CO2 prices.
More complicated soil properties such as landscape properties were not considered in our model because not enough data in the literature would allow us to extract and train the model. Given that there are not sufficient studies on biochar effects on crop yield, explicit landscape position, and 'productivity index,' we do not think it is plausible to develop a successful model linking land capabilities with biochar effect on crop yield at this point. Our hope is that inherent soil productivity (which is related to landscape position) is captured by other variables which are available in the database (SOC, sand, silt, clay content, CEC and soil pH).
Acknowledgments
This project was supported by the Global Climate and Energy Project, by Stanford sub-award agreement No. 60413992-112883-A.
Data availability:
Database used for developing the model in this study can be found here: https://github.com/para2x/Bayesian-Network-DB.