

Abstract
Interventions that promote pro-environmental behaviours are increasingly necessary in reducing use of high-emissions goods and services to meet international climate change targets. Here we assess the greenhouse gas emissions reductions associated with behavioural interventions in three high-emitting domains (personal vehicle use, meat consumption, and household energy use) based on an analysis of the peer-reviewed literature. We examined 40 studies from 1991–2018 involving 886 576 subjects. We found that some of the most robust interventions shown to reduce emissions were financial incentives for personal vehicles, defaults for reduced meat consumption, and feedback for home energy use. We estimate mean annual reductions of 571 kgCO2e per vehicle driver for reduced vehicle use, 51 kgCO2e per individual for reduced meat consumption, and 149 kgCO2e per household for reduced energy use. Despite substantial attention to behavioural interventions in the literature, we find that few studies are suitable for quantifying emissions reductions (N = 6 for diet, N = 5 for personal vehicles) and few (N = 3) are conducted outside OECD countries. Due to this imbalance in the literature, we focus our findings on western economies. We find substantial variation in the emission reductions achieved with different interventions within each domain; interventions in diet ranged from reductions of 231 kgCO2e to increases of 116 kgCO2e per person per year (both statistically significant). Further, emissions reductions are sensitive to external factors, such as the emissions intensity of the electrical grid, which may change over time. Key gaps in the literature include a lack of studies conducted using randomized controlled trials or follow-ups, and in high-impact areas for emissions reductions including air travel. We highlight promising areas of intervention, such as habit changes to promote mode shifts in personal transportation, which would benefit from an analysis of greenhouse gas emissions reductions in future research.
Export citation and abstract BibTeX RIS

Original content from this work may be used under the terms of the Creative Commons Attribution 3.0 licence. Any further distribution of this work must maintain attribution to the author(s) and the title of the work, journal citation and DOI.
Introduction
Achieving climate stabilization through meeting the Paris Agreement target of net zero global greenhouse gas emissions, which is consistent with approximately 85% emissions reductions across all sectors over the next three decades (Rockström et al 2017), will likely require changes from high-emitting households in how they eat (Hedenus et al 2014), consume energy (Eyre et al 2018), and travel (Sager et al 2011, Girod et al 2013). However, at the international level, some have claimed that the climate change research community, especially the Intergovernmental Panel on Climate Change (IPCC), has neglected the social sciences (Victor 2015), focusing on technological changes while ignoring the potentially large contribution of demand-side reductions (Creutzig et al 2016). While technological change will be critical to achieving the goal of a low-carbon society, the transition cannot be accomplished without also accounting for human behaviour (Gram-Hanssen 2013). Engaging and supporting the public in making behavioural changes will require governments, public and private institutions, and organizations to understand the types of interventions that are effective at guiding individuals towards low-carbon choices.
As one way to achieve emissions reductions from individual behaviours, Wynes and Nicholas (2017) argued that more focus should be on the actions with the greatest potential to reduce emissions. They evaluated personal actions to reduce greenhouse gas emissions and found that four actions were consistently high-impact across the industrialized (or wealthy) world, which they defined as saving at least 0.8 tons of carbon dioxide equivalents (tCO2e) per person per year: eating a plant-based diet (0.8 tonnes saved per person per year), avoiding air travel (1.6 tonnes saved per roundtrip transatlantic flight), living car free (2.4 tonnes saved per person per year), and having smaller families. Despite a large gap in emissions impact between these actions and actions such as recycling or changing lightbulbs, Wynes and Nicholas found that high-impact actions were mentioned much less frequently in high school science textbooks and government recommendations. They concluded that educators and communicators should focus more on these high impact actions, which are the most effective at reducing emissions for motivated individuals looking to make the largest possible contribution.
An alternative view, advanced by Stern and Wolske (2017), argues that researchers should instead consider the reasonably achievable emissions reductions (RAER) that could be expected from promoting possible actions. The RAER approach would account for the effectiveness of the action in actually reducing emissions, which depends on the baseline behaviour, the proportion of people who respond to a behavioural intervention, the completeness of their commitment, and the policy feasibility of implementing the action. This line of thinking argues that it is preferable to promote actions with smaller emissions reductions if they are more likely to be taken up by a larger population. We agree that what matters for climate change is actual emissions reductions achieved, and therefore we focus on quantifying that metric in this paper, to our knowledge for the first time for behavioural interventions across domains.
Considerable research has already evaluated the effectiveness of interventions that aim to increase many pro-environmental behaviours (PEBs; actions which reduce environmental burdens) (Kurisu 2015). Reviews have been conducted on such topics as recycling (Varotto and Spagnolli 2017), household energy conservation (Abrahamse et al 2005) and reduced car use (Petrunoff et al 2016). Since the goal of interventions that promote PEBs is usually to reduce environmental impact (i.e. ecological footprint or carbon footprint) then '(t)he effectiveness of a program to promote PEB should be measured in environmental impact, not just in amount of changed behavior' (Osbaldiston and Schott 2012, p 281). While several meta-analyses of PEBs report statistical measures of effect size (such as Hedge's g) (Abrahamse et al 2005, Osbaldiston and Schott 2012, Varotto and Spagnolli 2017) in this paper we quantify the emissions reductions reported from a variety of behavioural interventions across high-emitting domains in order to identify promising intervention strategies and areas that require future research. Here we review the literature on the greenhouse gas reductions of behavioural interventions and expand on previous approaches by quantifying effectiveness as measured in kgCO2e reductions achieved, using emissions factors from OECD regions. Note that our goal is not to review the psychological literature on pro-environmental behavior. For theoretical reviews on PEB see Bamberg and Möser (2007), Steg and Vlek (2009) and Stern (2000).
In this paper, we searched for studies in three of the high-impact domains from Wynes and Nicholas (2017) (air travel, vehicle usage and diet) as well as household energy use. (Wynes and Nicholas found that switching to green energy was sometimes but not always a high-impact action depending on policy design; we focus here on reducing household energy use, which is widely studied, and includes some actions, like washing clothes in cold water, classified as achieving moderate emissions reductions (Wynes and Nicholas 2017).) Personal vehicle use accounts for 26% of the greenhouse gas emissions produced by a typical household in the United States, with household energy accounting for 23%, meat consumption for 6% (Jones and Kammen 2011) and air travel accounting for almost 5% in an average household, but closer to 28% in a high income household (Lacroix 2018).
Methods
Scoping procedure
We began by defining a set of search queries for the Web of Science for each of the four domains (personal vehicles, diet, household energy use, and air travel). The search queries were intended to encompass a variety of interventions, including those that were focused on promoting positive health outcomes instead of simply PEBs (supplementary materials 1 is available online at stacks.iop.org/ERL/13/113002/mmedia). We then established inclusion and exclusion criteria, which differed somewhat between the four domains, although we restricted papers to those written in English, peer-reviewed, and published in 1990 or later. We also excluded studies that were purely correlational. For personal vehicles we excluded interventions that focused on workplace driving (e.g. delivery drivers instead of commuters to work) or that increased purchase rates of electric vehicles (electric vehicles are associated with higher emissions than public transit, so they are only effective in reducing emissions if they replace internal combustion vehicles). For diet we excluded health studies where participants were not of good health or were very young (pre-school) as well as those involving food waste, which is less effective in terms of emissions reductions than a plant-based diet (Wynes and Nicholas 2017).
For all interventions, our initial goal was to quantify RAER. This would require measuring 'intent to treat' effect (capturing not just the effectiveness of the treatment among those who participated but also among those who refused to participate), as well as the feasibility of policies designed to implement the intervention. However, many studies did not provide enough information to calculate this approach, so we simply calculate effectiveness as measured by the emissions reductions observed. For the interventions concerning diet and personal vehicle use, we also included studies that relied on self-reported results because we found only two in each domain that used objective measurements. However, because it is relatively easy for researchers to measure behaviours in household energy use (using energy meters and other technology), there were many quantified studies available in this domain, so we excluded self-reported results from this sample. We also excluded studies on structural interventions (such as installing attic insulation), which do not account for the fraction of homeowners who would decline participation as this does not follow the RAER approach and is not a behavioural intervention. However, we included interventions that encouraged individuals to adopt structural changes for their homes or small structural interventions that are intended to influence behaviour (e.g. installing programmable thermostats or devices which monitored household energy). To maintain a high standard of research, studies with a small sample size (n < 10) were also excluded, except in cases where sample size was determined by the number of participating buildings or institutions instead of households. Finally, studies were excluded if it was not possible to calculate emissions reductions from data provided.
With these criteria established we performed a full screening of titles, removing irrelevant papers (figure 1). We then performed a full screening of abstracts, again removing irrelevant papers. In total we began the search with 2157 titles, this was narrowed down to 427 applicable titles and then narrowed down to 97 potential papers (13 in personal vehicles, 26 in diet, 58 in household energy and none in air travel). Finding a small percentage of manuscripts suitable for analysis is common in this field; for example, Graham-Rowe et al (2011) began a literature search on interventions related to personal vehicle use with 3486 search hits and narrowed their findings down to 69 final papers while Hendren and Logomarsino (2017) began with 1005 search hits and found only 18 applicable papers for a study of cafeteria interventions to increase fruit and vegetable intake. Next, we supplemented these papers with papers of which we were already aware (e.g. Brunner et al 2018), and with papers that were found by scanning the reference sections of relevant review articles (Abrahamse et al 2005, Salon et al 2012, Petrunoff et al 2016, Hendren and Logomarsino 2017, Šćepanović et al 2017, Byerly et al 2018). All of the papers from this search contributed to our review of interventions in these domains, but only 40 contained enough information to make greenhouse gas emissions calculations.
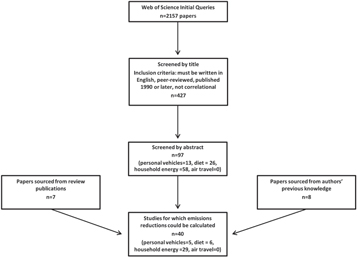
Figure 1. Diagram of scoping procedure to identify studies quantifying greenhouse gas emissions reductions from behavioural interventions in reducing driving, meat eating, and energy use. See methods for full inclusion and exclusion criteria. See supplementary materials 1 for the search queries.
Download figure:
Standard image High-resolution imageAnalysis
To quantify the emissions reduced by each intervention, we used the following calculations. For studies where control groups were available, we calculated the difference between the change in mean of the control group and the change in the mean of the treatment group. This method is preferable for studies spanning multiple seasons where emissions from behaviour fluctuate considerably. For instance, seasonality affects fresh fruit and vegetable consumption, degree heating or cooling days, and the price of gasoline, all of which might influence an individual's decision to undertake a PEB. Allcott (2011) demonstrates the superiority of using controls over econometric models that attempt to make adjustments for seasonality in the case of household energy use, but we present the results of the latter when the former were not available. Where several measurements were recorded over time, we take the final measurement as the post-treatment value, since we are interested in the persistence of the intervention. For studies where no control group was available, the magnitude of the intervention was determined by subtracting the pre-treatment mean from the post-treatment mean. See supplementary materials 2 for details.
To calculate emissions reductions within domains, for personal vehicle use we rely on the lifecycle emissions produced per vehicle kilometer travelled from Hawkins et al (2013), using the emissions from an internal combustion vehicle to provide a conventional estimate (reported in text), and the emissions from an electric vehicle to provide a low range estimate (see supplementary materials 2). Please note that emissions for electric vehicles are quite variable depending on the carbon intensity of the energy grid and can be much higher than the one presented, for instance if using the Australian energy grid (Wolfram and Wiedmann 2017) or much lower in the case of an energy grid powered by renewables (Onat et al 2015). For diet, we multiply measurements of food mass or servings by carbon footprints of those foods compiled in a meta-analysis (Hilborn et al 2018), or Hoolohan et al (2013), accounting for the carbon footprints of the foods that would likely replace meat consumption when appropriate. For the emissions of household energy use we take the average emissions intensity of the United States electrical grid (12 out of 29 household energy studies were based in the US), as well as the highest and lowest emissions intensities of sub-regions in the United States to provide an upper and lower bound (EPA 2016).
To compare interventions across domains we present our results in terms of kilograms of GHG emissions reduced per year per participating unit (driver, household, or individual). This approach gives the best indication of the emissions reduced per unit of outreach by those conducting the intervention. For instance, feedback on household energy use is given at the household level, and the effort required to recruit participants and conduct the intervention varies based on the number of households that participate and not by the total number of individuals in those households. For diet interventions our estimations required assumptions such as the number of meals that this intervention would apply to per year (in cafeteria settings, for instance, we assume one meal per workday). For vehicle interventions, note that driver refers to the main driver or owner of the vehicle who participated in the intervention, although in cases where observations (odometer readings and GPS devices) were used instead of self-reports, changes in vehicle kilometer travelled were also due to other drivers who shared the same vehicle.
Previous reviews of behavioural interventions have reported average treatment effect (measured in percent change of a behaviour such as turning off lights, or an outcome such as decreased kWh) or statistical effect size. To our knowledge, we are the first to calculate absolute reductions of greenhouse gas emissions (kgCO2e) achieved from different interventions. Our metric is more useful for informing policy aiming to meet local, national, or international climate targets, which are based in units of emission reduction. Additional benefits to this method include accounting for consumption differences between countries and between domains, which are easily confounded in previous studies. For informing meaningful national policy, consider two hypothetical interventions that both encourage conservation of indoor lighting, one in Ireland and the other in Canada. With our approach of using the US grid as a constant baseline of the carbon intensity of energy, if the same conservation behaviours (e.g. turning off lightbulbs when leaving a room, etc) took place in the households of both countries, one would expect similar electricity savings and similar greenhouse gas reductions. However, using the currently more commonly reported metric of the percent change of energy usage, the effect of the intervention would appear much larger in Ireland, where per capita electricity usage is almost three times smaller than in Canada (World Bank 2014). For this reason we use the same emissions factors in all regions; we would report a novel and effective intervention tested in a region with a low emissions factor as being appropriately effective rather than downgrading its comparative efficacy.
For informing climate policy between domains, a comparison between the percent change in the number of meat servings consumed per week and a percent change in vehicle kilometer travelled per week is not very useful. As for effect size, including this measurement in our study would require making a separate set of calculations that would not be consistent with those used to determine greenhouse gas reductions (for instance, in some studies the data needed for effect size was presented for the entire sample while the data needed for greenhouse gas calculations was only available broken up by different demographic groups or timeframes, making the two measurements incomparable).
When reporting measures of significance, we caution that our results sometimes require calculations which the authors did not originally report, and we are therefore conveying the significance of the study's intervention in the terms the authors measured it in (kWh, number of servings etc), but associating it with the emissions reductions that we present.
Coding interventions
Each study was coded for the type of intervention according to eleven categories adapted from Osbaldiston and Schott (2012) (table 1). Studies were also coded for duration, location, and experimental design (e.g. randomized controlled trial (RCT)), along with descriptions of strengths and weaknesses of the study design. We classify intervention impact as high (>800 kgCO2e reduced per year), moderate (200–800 kgCO2e), or low (<200 kgCO2e) in accordance with Wynes and Nicholas (2017) (note we have maintained their suggested metric per person for meat consumption, but modified to report results per driver (attributing all emissions from car use to one person) or per household (energy use)). The reductions are expressed per participating unit (driver, individual, household) to best capture the effectiveness per unit of outreach and because of inconsistencies in the number of people per household and per vehicle across the studies, as well as differences in related methodologies.
Table 1. Frequency of studies containing the various types of interventions included in the 40 studies quantifying emissions reductions achieved from behavioural interventions, with classifications adapted from Osbaldiston and Schott (2012). Many studies use multiple strategies in a single intervention (e.g. rewards and feedback).
| Number of studies | ||||
|---|---|---|---|---|
| Type of intervention | Example | Personal vehicles | Diet | Household energy |
| Nudges | Customers 'nudged' by being given pre-portioned meal sizes (Friis et al 2017) | 0 | 1 | 2 |
| Prompts | Participant received SMS reminders to reduce red meat intake (Carfora et al 2017) | 1 | 2 | 0 |
| Justification | Carbon footprint information of meal choices displayed (Brunner et al 2018) | 1 | 4 | 3 |
| Instructions | Energy saving tips provided to households (Allcott 2011) | 0 | 2 | 15 |
| Feedback | Monthly energy statement mailed to households (Carroll et al 2014) | 1 | 1 | 26 |
| Social modeling | Neighbourhood leaders modeled a PEB (no example from the studies we included) | 0 | 0 | 0 |
| Cognitive dissonance | Stressed the gap between an individual's actions (driving) and values (environmental concern) (Tertoolen et al 1998) | 1 | 1 | 0 |
| Commitment | Subjects committed to reduce car use (Tertoolen et al 1998) | 1 | 0 | 0 |
| Rewards | Employees offered option to cash out parking spots (Shoup 1997) | 3 | 0 | 8 |
| Competition | Group competition to reduce energy use at university residence (Sintov et al 2016) | 0 | 0 | 3 |
| Goal | Group goal of 5% energy reduction given to households (Abrahamse et al 2007) | 0 | 2 | 1 |
Results
Emissions reductions achieved across domains
We identified forty studies in three domains of interest from which estimations of greenhouse gas reductions could be calculated: N = 5 studies on personal vehicles, N = 6 on diet, N = 29 on household energy use and N = 0 on air travel (table 2). In total these studies described 68 unique interventions and included 886 576 subjects. The estimated mean annual emissions reductions achieved through behavioural interventions (table 2) were moderate for interventions aimed at personal vehicles (571 kgCO2e/year/driver) and low for household energy use (149 kgCO2e/year/household) and diet (51 kgCO2e/year/individual). These range from 0.3% of an average American individual's emissions (in the case of diet) to 3.2% in the case of personal vehicles. However, there was large variance across the studies, with an overall coefficient of variation for the emissions reductions of all interventions of 1.61 and coefficients of variation for the emissions reductions of personal vehicles, diet and household energy of 0.63, 1.92 and 1.90 respectively.
Table 2. Summary of studies broken down by domain.
| Domain | Number of studies | Number of interventions | Range of sample sizes | Emissions reductionsA | Reductions as a percent of the average American's emissionsB |
|---|---|---|---|---|---|
| Personal vehicles | 5 | 10 | 82–1694 (drivers) | 571 [54–1041] kgCO2e/year/driver | 3.2% |
| Diet | 6 | 10 | 55–3715 (individuals) | 51 [−116–231] kgCO2e/year/individual | 0.3% |
| Household energy use | 29 | 48 | 24–588 446 (households) | 149 [−1125–834] kgCO2e/year/household | 0.8% |
| Air travel | 0 | 0 | NA | NA | NA |
AMean and range of values reported, see supplementary materials 2 for details. A negative value indicates an increase in greenhouse gas emissions. BBased on emissions data from World Resources Institute (2014).
We found that the ranking of mean emissions reductions by domains (with reducing driving having the biggest effect) is reasonably robust to the units of measurement (driver, individual or household). For example, the estimated mean emissions reduction is highest for interventions aimed at personal vehicles even if one assumes an unrealistic average of three people per vehicle and only one person per household. The estimated mean emissions reductions would be similar between household energy use and diet interventions if one assumes 2.5 people per household, typical in North America (however it should be noted that several household energy studies are conducted using university dorm rooms as the participating units, implying greater potential emissions savings from these one or two-person households).
Study design
Comparison of emissions reduction and square root of sample size across all studies (figure 2) shows no strong evidence of publication bias (such as a sudden drop off in points just to the left of zero). For a full discussion on potential publication bias please see supplementary materials 3. Analysis of study findings by year of publication (not shown) shows no indication of convergence in values of emissions reductions over time, so it is unlikely that researchers have reached consensus on the most effective interventions.
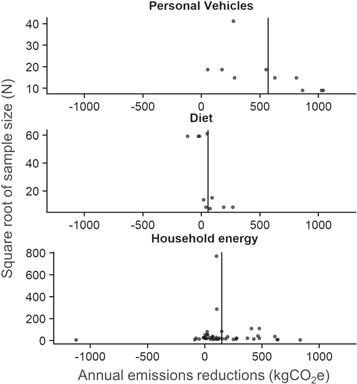
Figure 2. Funnel plots of emissions reductions of interventions in the three domains, with each point representing one intervention. Vertical lines represent mean emissions reductions.
Download figure:
Standard image High-resolution imageOnly two out of the five studies on personal vehicles made use of an RCT design, compared to all of the six studies on diet. However, studies in both of these areas relied heavily on self-reported measurements (three of the five studies on personal vehicles and four of the six on diet). Studies were conducted in a variety of locations across the globe, although some regions received disproportionate attention, including the United States (15 studies, 38% of total sample), Denmark (4 studies, 10% of sample), and Sweden (3 studies, 8% of sample). Very few were conducted outside of the industrialized world; one study was conducted in each of China, India, and South Africa (table 3). Studies ranged in length from the timing of a single meal to three years for household energy use, with an overall median length of 16 weeks (see supplementary materials 4). Although some of the interventions share similarities across domains (rewards and feedback were used in multiple domains, for instance), the interventions used are generally quite distinct between domains, and we therefore divide our analysis by domain, identifying the intervention types where pertinent.
Table 3. Detailed summary of studies.
| Author | Type of intervention | Domain | Design | N | Duration | Location |
|---|---|---|---|---|---|---|
| Jakobsson et al (2002) | Rewards | Personal vehicles | RCT | 82 two-driver households | 2 weeks | Sweden |
| Pendyala et al (1991) | Prompt | Personal vehicles | Quasi-experiment | 219 drivers | 1 year | California |
| Rufolo and Kimpel (2008) | Rewards | Personal vehicles | Pre/post | 207 vehicles, 168 households | ∼8 months | Oregon |
| Shoup (1997) | Rewards | Personal vehicles | Natural experiment/case studies | 8 firms (1694 employees), one control firm | 1–2 years | California |
| Tertoolen et al (1998) | Justification, feedback, commitment, cognitive dissonance | Personal vehicles | RCT | 350 drivers | 8 weeks | Netherlands |
| Abrahamse et al (2007) | Feedback, instructions, goal | Diet | RCT | 189 households | 5 months | Netherlands |
| Brunner et al (2018) | Justification | Diet | RCT | 3715 individuals | 7 weeks | Sweden |
| Carfora et al (2017) | Prompt, justification | Diet | RCT | 228 individuals | 1 week | Italy |
| Klöckner and Ofstad (2017) | Justification, instructions | Diet | RCT | 3508 individuals | 8 weeks | Norway |
| Friis et al (2017) | Nudge | Diet | RCT | 68 individuals | 1 meal | Denmark |
| Loy et al (2016) | Prompt, justification, cognitive dissonance, goal | Diet | RCT | 55 individuals | 3 weeks | Germany |
| Alberini and Towe (2015) | Rewards, justification | Household energy | Quasi-experiment | 11484 households | 4 years | Maryland |
| Allcott (2011) | Feedback, instructions | Household energy | RCT | 588446 households | 2 years | United States |
| Asensio and Delmas (2015) | Feedback, justification, instructions | Household energy | RCT | 118 residences | 100 days | California |
| Ayres et al (2013) | Feedback | Household energy | RCT | 168000 households | 12 months, 7 months | California, Washington |
| Bekker et al (2010) | Feedback, rewards, instructions | Household energy | Quasi-experiment | two halls (190 individuals in intervention hall) | 3 weeks | New Zealand |
| Carroll et al (2014) | Rewards, feedback, instructions | Household energy | RCT | 2722 households | 1 year | Ireland |
| Costa and Kahn (2013) | Feedback, instructions | Household energy | RCT | 81722 households | 2 years, 10 months | California |
| Delmas and Lessem (2014) | Feedback | Household energy | RCT | 66 rooms | 9 months | California |
| Gleerup et al (2010) | Feedback | Household energy | RCT | 681 households | 1 year | Denmark |
| Grønhøj and Thøgersen (2011) | Feedback | Household energy | Quasi-experiment | 183 households | 5 months | Denmark |
| Herter et al (2013) | Feedback, instructions, rewards | Household energy | RCT | 402 households | Summer | California |
| Houde et al (2013) | Feedback, instructions | Household energy | RCT | 1064 households | 3 months | United States |
| Jensen et al (2012) | Nudge, instructions | Household energy | RCT | 748 households | 2 months post treatment | Denmark |
| Martin and Rivers (2018) | Feedback | Household energy | Quasi-RCT | 6881 households | 2 years | Ontario |
| Matsukawa (2004) | Feedback | Household energy | RCT | 319 households | 3 months | Japan |
| Nilsson et al (2014) | Feedback | Household energy | RCT | 39 households | 2 months post treatment | Sweden |
| Nilsson et al (2014) | Feedback | Household energy | Quasi-experiment | 32 apartments, two apartment buildings | 3 months during treatment | Sweden |
| Ozawa et al (2017) | Feedback, instructions | Household energy | Quasi-experiment | 646 households | 185 days | Japan |
| Petersen et al (2007) | Feedback, competition, rewards | Household energy | Pre/post | 18 dormitories, 1743 students | 2 weeks | UK |
| Schleich et al (2013) | Feedback, instructions | Household energy | RCT | 1525 households | 11 months | Austria |
| Schultz et al (2015) | Feedback | Household energy | RCT | 431 households | 3 months | California |
| Schultz et al (2007) | Feedback | Household energy | RCT | 287 households | 4 weeks | California |
| Senbel et al (2014) | Feedback, justification, instructions, competition, goal | Household energy | Pretest-posttest-control (PPC) quasi-experiment | 6500 eligible students (20 residences) | 1 academic year | British Columbia |
| Sintov et al (2016) | Feedback, competition, rewards, instructions | Household energy | Pre/post | 39 suites | 3 weeks | California |
| Sudarshan (2017) | Feedback, rewards, instructions | Household energy | RCT | 473 households | 4 months | India |
| Suter and Shammin (2013) | Rewards, nudge | Household energy | RCT | 24 households | 1 year | Ohio |
| Thondhlana and Kua (2016) | Instructions, feedback | Household energy | Quasi-experiment | 135 households | Four months | South Africa |
| Wilhite and Ling (1995) | Feedback, instructions | Household energy | RCT | 1286 households | 3 years | Norway |
| Willis et al (2010) | Feedback | Household energy | Quasi-experiment | 151 households | 2 weeks | Australia |
| Xu et al (2015) | Feedback | Household energy | Quasi-experiment | 131 apartments in two buildings | 1 month | China |
Behavioural interventions by domain
Personal vehicles
Interventions to reduce personal vehicle use ranged in effectiveness from 54–1041 kgCO2e reduced per driver per year. This is approximately a 2%–40% reduction from the 2.4 tCO2e from the average internal combustion vehicle lifecycle emissions per person per year calculated by Wynes and Nicholas (2017); personal vehicle use is by far the largest per-capita emissions source of the three domains studied here. Five studies were found suitable for our analysis of personal vehicles: three from the United States, one from Sweden and one from the Netherlands. Three of the five studies relied on rewards of some type to motivate PEB.
Incentives such as payments for opting out of company parking spaces ('Rewards') were found to be effective in increasing carpooling while decreasing car use and related emissions (Shoup 1997). We estimate emissions reductions of 273 kgCO2e in the case of this natural experiment on parking management. This experiment benefited from a long follow-up period (1–2 years) but did not contain a true control group. Incentives were also associated with large although statistically non-significant reductions of 865–1041 kgCO2e in a case where the authors suggest that reductions were more likely to be due to the creation of travel plans than the monetary incentives (Jakobsson et al 2002).
Economic disincentives, which approximate congestion pricing and may be considered negative 'Rewards' in our classification, were found to create significant emissions reductions in two studies. In one study in the United States, 284 kgCO2e were reduced per year using a fixed price on vehicle kilometers traveled or 627 kgCO2e reduced per year in a scheme that varied prices based on peak travel times (Rufolo and Kimpel 2008).
A telecommuting intervention with public employees (Pendyala et al 1991) was found to be the highest statistically significant intervention, which we estimated to reduce 813 kgCO2e/driver/year, although the travel diaries workers used to self-report their mileage may overestimate these reductions as employees would be motivated to meet employer expectations.
Diet
Interventions to reduce meat consumption ranged in effectiveness from a backfiring effect where meat consumption and therefore emissions actually increased in a study providing information (Klöckner and Ofstad 2017) to substantial emissions reductions of 231 kgCO2e per person per year in a study using pre-proportioned meal sizes (Friis et al 2017). Wynes and Nicholas (2017) found that eating a plant-based diet could save an average of 0.8 tCO2e per person per year, implying that the most effective intervention in this review achieved nearly one-third of the emissions reduction expected from switching entirely to a plant-based diet.
The mean emissions reductions of a diet intervention was lower than that of personal vehicles or household energy use mostly because vehicles emit so much, but partially because interventions concerning diet may only target a small number of meals per week (one meal a day per five work days is a small fraction of total food consumption). As noted above, the difference between diet interventions and household energy becomes similar if one uses a per-person metric and assumes 2.5 individuals per household. Additionally, the potential population able to make changes concerning diet (the majority of healthy adults and even adolescents) is higher than that of vehicle owners (Chitnis et al 2014), which could lead to increased total emissions reductions. The sample size, however, is too small to draw definitive conclusions on the difference in emissions reductions between interventions on diet and interventions on household energy.
Of the existing research, many studies rely on cafeteria settings to allow for controlled conditions. Friis et al (2017) used 'Nudge' interventions in a cafeteria buffet (such as increased presence of green foliage or default serving sizes) to achieve reductions which, assuming five meals a week for 48 weeks a year, would range from 35–231 kgCO2e annually. Providing carbon labels ('Justification') for meal choices at a university restaurant was found to decrease emissions by 3.6% (or 50 kgCO2e per person annually), with no opt-out effect (Brunner et al 2018). In this case opt-out effects would include the effect of a label that made customers uncomfortable and caused them to eat elsewhere, thus reducing the overall effectiveness of the intervention.
Beyond the cafeteria, public health researchers have found red meat consumption can be reduced using text message reminders ('Prompts') (Carfora et al 2017). The number of portions of red meat consumed by university students decreased significantly in the treatment group, with an estimated impact of 90 kgCO2e yr–1. Though young people may seem to be a promising demographic for changing dietary habits, not all interventions were successful for this demographic; in one study, educating high school students on climate change ('Justification') and providing 'Instructions' on how to cook a vegetarian meal (as part of a larger sustainability course) produced no significant change in meat consumption (Cornelius et al 2014).
Loy et al (2016) show that with a group of university students, interventions focusing either on information provision (considered the control group) or information provision paired with a self-regulation technique (involving a 'Goal') can result in daily reductions in meat consumption. The self-regulation strategy consisted of imagining a future goal as well as the obstacles that will oppose that goal, and then planning future responses that will help an individual to overcome those obstacles. Unfortunately, while using an RCT design, the study lacked a true control group that did not receive any information regarding meat consumption, and results were self-reported. We calculated a conservative estimate of 75 kgCO2e yr–1 for members of the intervention group compared to the information-only group for this study, by assuming that the change in habit observed over three weeks lasted for an entire year.
Klöckner and Ofstad (2017), although unable to conclusively reduce beef consumption through their intervention, used tailored information ('Justification') to encourage participants to move along a stage progression that ranged from not considering reducing beef consumption to finding the best ways to actively reduce beef consumption. One of the more unanticipated findings was that an intervention providing participants with all available information (instead of tailored information) backfired, and significantly increased self-reported beef consumption. The authors suggest that participants may have been unconsciously stimulated to consume more beef by viewing images and text related to meat. In this case, we calculated that the level of increased beef consumption of the group provided with all available information (compared to the control group provided with no information) would result in emissions increasing by 116 kgCO2e annually per person.
Household energy
We considered 29 studies with 48 interventions aimed at reducing household energy use and estimated the mean emissions reductions to be 149 kgCO2e/household/year. Wynes and Nicholas (2017) found actions that conserved household energy (run on current fossil fuel-dominated energy grids) could reduce emissions by approximately 30–250 kgCO2e per person per year. We did not identify any behavioural intervention studies that promoted the switch to green energy—which Wynes and Nicholas found was a more high-impact action in areas where additional renewable energy generation was achieved (2017). Nearly all studies (90% of 29 total studies) in this domain included 'Feedback'; 'Instructions' (52%) and 'Rewards' (28%) were also common. Calculations of emissions reductions achieved in this domain are based on the average emissions intensity of the United States electrical grid and are therefore subject to considerable change if emissions intensities from other nations, or even specific regions of the United States are used instead (e.g. from an average of 51–149 to 283 kgCO2e/person, respectively; figure 3).

Figure 3. Annual emissions reductions per household from household energy use interventions, estimated for low, average and high carbon intensity sub-regions of the United States electrical grid (EPA 2016). Note that a non-significant outlier at −1125 kgCO2e/year/household (from Suter and Shammin (2013), which had a small sample size) is not visible. See supplementary materials 5 for values.
Download figure:
Standard image High-resolution image
The most common intervention to reduce energy use was 'Feedback,' although frequency varied greatly (e.g. monthly for feedback provided by mail, nearly constant for feedback provided online or through in-home displays). The comparatively large sample size in this domain allows us to calculate mean annual emissions reductions for 17 household energy interventions with an intervention type of only 'Feedback' of 133 kgCO2e/year/household (weighted mean of 132 kgCO2e/year/household) (compared with an average US household energy emissions of 9.3 tCO2e (Jones and Kammen 2011)). The mean reductions for interventions where feedback was paired with instructions on how to reduce energy use was 187 kgCO2e/year/household (although the weighted mean was 104 kgCO2e/year/household).
Several studies made use of peer comparisons, as part of a 'Feedback' intervention (Schultz et al 2007, 2015, Allcott 2011, Ayres et al 2013, Costa and Kahn 2013, Carroll et al 2014, Ozawa et al 2017, Sudarshan 2017). Some interventions avoided the issue of the 'boomerang effect' (where low energy users realize that their peers are less efficient and begin increasing consumption) by making a comparison to an efficient neighbour of similar characteristics, rather than an average neighbour (Ayres et al 2013, Asensio and Delmas 2015).
Norms may play an important role in behavioural interventions. Schultz et al (2007) found that an injunctive norm (smiley face on the feedback forms of low energy users) eliminated the boomerang effect, while Allcott (2011) also used injunctive norms but found no evidence that the injunctive norms were responsible for avoiding a boomerang effect. The use of social norms can be taken a step further by publicly divulging individual behaviours, which was shown to effectively decrease energy usage in a university residence, resulting in annual reductions of 250 kgCO2e (Delmas and Lessem 2014).
The surveyed articles note that university dormitories have great potential for mitigation as the residents generally have no financial motivation to conserve energy and rarely receive feedback on their consumption (Emeakaroha et al 2014), and are composed of an engaged population. Some studies (Petersen et al 2007, Bekker et al 2010, Delmas and Lessem 2014, Sintov et al 2016) demonstrated effective dormitory energy use reductions through interventions involving 'Feedback' and 'Rewards,' as well as 'Competition'. Senbel et al (2014) and Delmas and Lessem (2014) both find evidence of significant, sustained reductions over the course of an academic year, ranging from 22–295 kgCO2e reduced per year per student (note that our results for this category assume year-long occupancy of the dormitories). Thus, competitions have been shown to be effective at reducing dormitory energy use, but need further testing beyond a close-knit, community setting of progressive young people.
Air travel
No studies were found that specifically aimed to reduce air travel. Abrahamse et al (2007) did aim to reduce flights for family vacations as one of many possible ways that households were encouraged to reduce energy use but found that variation between the before and after period was so large that they excluded these results from much of their analysis.
Discussion
Our analysis revealed substantial variance in the effectiveness of behavioural interventions, with the largest potential reductions found in the largest emissions source (personal vehicle use), where the most effective intervention was financial 'Rewards' (average 686 kgCO2e/driver/year reductions over six interventions in three studies). 'Feedback' was consistently effective in reducing home energy use (average 133 kgCO2e reductions over 17 interventions in 11 studies), and 'Nudges' such as defaults were most effective in reducing meat consumption (average of 144 kgCO2e reduction over three interventions in one study). In this section we discuss the findings in each of the domains (personal vehicles, diet, and household energy) including not only results from those studies where emissions reductions could be calculated (as described above) but also the broader literature. We also discuss the strengths and limitations of our approach and provide recommendations for future research.
Personal vehicles
Our review identified three main types of interventions that have been used to reduce personal vehicle usage where emissions could be calculated: rewards, parking management and telecommuting. The use of rewards came with mixed results: Rufolo and Kimpel (2008) found moderate, significant emissions reductions, while Jakobsson et al (2002) found moderate to high, but non-significant reductions.
Though the moderate reductions of emissions that we estimated for an intervention on parking management contain caveats in the study design (only eight firms participated and no true control group) their results are in agreement with the results of natural experiments (Petrunoff et al 2015) and the experience of transport practitioners who view parking management as central to the success of promoting active travel to the workplace (Petrunoff et al 2016).
Our review search also generated three studies that examined center-based telecommuting (Henderson and Mokhtarian 1996, Balepur et al 1998, Mokhtarian and Varma 1998). These were not included in the numerical analysis because they involve large structural interventions like the use of additional building space (teleconferencing offices that are closer to an employee's home and therefore intended to reduce commuting). Other studies that analyzed the impact of telecommuting evaluated the travel diaries of volunteers who agreed to telecommute, where the intervention consisted only of either providing requisite teleconferencing equipment (Hamer et al 1991) or the implicit 'Prompt' to begin teleconferencing (Pendyala et al 1991), which resulted in an 813 kgCO2e yr–1 reduction, although this lone result should be interpreted with caution as the participants were state employees (which may not be a generalizable sample) who self-reported their driving habits. The utility of telecommuting is contested in the literature, with some noting that telecommuters tend to travel overall more than non-telecommuters, possibly from increased non-work travel (direct rebound effect) (Zhu and Mason 2014, Kim 2017).
Because vehicle usage is highly habitual, mode shifts are thought to benefit from events or interventions that are able to temporarily interrupt this habit, for instance via temporary road closures (Fujii et al 2001) or public transit promotional offers (Thøgersen 2009). Moser et al (2018) found persistent reduction in car driving in a sample of volunteers who agreed to exchange their car keys for a two-week e-bike trial. Providing free public transit passes increased public transit usage in households who recently moved into an area and therefore had not yet established transit habits (Bamberg 2006) and was also effective for university students (Fujii and Kitamura 2003). A free semester-long public transit pass also reduced car travel for students (Bamberg and Schmidt 2001). The effect of a free month-long pass was found to be effective in increasing public transit use in Copenhagen, even showing persistence after five months (Thøgersen 2009); however a week-long pass was found to be ineffective at reducing vehicle travel in Norway (Tørnblad et al 2014). In the Norwegian case, failure to reduce vehicle use points to the importance of local context since factors such as harsh winters or the availability of parking may influence the effectiveness of interventions. Overall, these interruptions of habit are promising interventions to promote mode-shifts.
An intervention that approximates the recommendation from Wynes and Nicholas (2017) to live car-free was conducted with first year undergraduates at a Japanese university; participants who received information about the risks, costs and enjoyment of automobile ownership were significantly less likely to have a driver's license 18 months later (42.6% versus 69% in the control group) (Fujii 2007). Although it would be difficult to measure the emissions reductions of such an intervention (students without driver's licenses might make more frequent use of taxis, etc than students with a license), this still demonstrates the potential value of interventions aimed at individuals who have yet to choose whether to adopt a high carbon lifestyle or not. Behavioural changes that move beyond improvements in efficiency or conservation of fuel to reductions of per capita personal vehicle use may be necessary for meeting climate goals (Sager et al 2011).
Diet
We found two studies (and four interventions) that could be employed in cafeteria-or restaurant-like settings to reduce emissions, with effectiveness ranging from 35–231 kgCO2e per person per year. There is additional research in this area that showed promising results, but for which it was not possible to quantify emissions reductions; these are important interventions for emissions measurement in the future. For example, Campbell-Arvai et al (2014) found that making vegetarian meals a default choice in a cafeteria significantly increased the chance of a participant selecting a vegetarian meal, from 40% in a control group compared to 89.7% in the group with a vegetarian default menu. Reinders et al (2017) decreased meat portion size (by 12%) in a restaurant setting, which resulted in decreased meat consumption (and emissions), while customers remained satisfied with their dish. Adding mushrooms to beef burger patties is a similar strategy with potentially large, positive impacts for the climate (Waite et al 2018). Lassen et al (2004) explores several strategies to successfully increase fruit and vegetable intake that might also be expected to reduce the amount of meat served in cafeteria settings, such as seeking inspiration from cuisines that tend to be plant-based or offering cooked vegetables as well as salads, since cooked vegetables are easier to digest in large portions. Researchers have also encouraged adoption of the Mediterranean diet for its health benefits (Leblanc et al 2015) since this diet has been shown to have a lower carbon footprint than typical western diets (van Dooren et al 2014). Other studies have found that participants who received statements of dynamic norms (namely that a growing fraction of the population have begun to eat less meat) were more likely to purchase meatless lunches than participants in a static norm or a control group (Sparkman and Walton 2017).
Though cafeteria interventions and outreach to students may successfully reduce emissions, they are only able to reach a limited portion of the population. Adding eco-labels ('Justification') to products at the point of purchase (on a grocery store shelf for instance) offers a way to reach customers beyond schools, workplaces and restaurants, prompting them to make more sustainable choices. Vanclay et al (2011) found that food products given a green carbon footprint label (signalling a low-emissions product) saw a significant increase in sales in a convenience store compared to sales in previous months, provided that they were also cheaper than the higher carbon alternatives. Vlaeminck et al (2014) designed eco-labels for a Belgian supermarket and found that an easy to interpret, comprehensive label shifted consumption of animal proteins to plant-based proteins and fruit and vegetables; the proportion of animal-based protein decreased from 21.1% of total consumption to 14.8% (we were unable to calculate the emissions associated with this change).
Household energy
We found many of the interventions concerning household energy focused on providing 'Feedback' (26 studies) or 'Instructions' (15 studies), with these two intervention types often paired together (14 studies). In practice this usually means giving households updates on their own energy consumption alongside tips on how to reduce that consumption. In agreement with our findings that feedback and instructions were useful interventions to reduce emissions, another meta-analysis found the weighted average treatment effect of information-based interventions (which include feedback and instructions) to be a 7.5% reduction in energy usage (Delmas et al 2013). Some of this feedback can be carried out simply by installing in-home displays. A meta-analysis suggested that such real-time feedback leads to a conservation effect of 3%–5% in the case of large-scale efforts (McKerracher and Torriti 2013).
Most studies we examined focused on energy conservation, but households can also reduce emissions by purchasing green energy (although increased demand for green energy may not always increase renewable energy capacity in the grid (Brander et al 2018)). Case studies suggest that users are more likely to adopt green energy from their utility if it is made the default setting (Pichert and Katsikopoulos 2008) and research in the field confirms this effect, finding that nearly ten times more customers purchased green energy in the opt-out condition (69.1%) compared to the opt-in condition (7.2%) (Ebeling and Lotz 2015). Both groups of researchers note the ethical issues of making a slightly more expensive energy form the default (ranging from 1%–23% more expensive in the two studies) and remind the reader that there would be insufficient supply to switch over a large portion of the population overnight. But there is strong potential for default settings to have positive environmental outcomes in at least select contexts, including not just green energy but also meat consumption (Campbell-Arvai and Arvai 2015).
Interventions that rely on daily behavioural changes (e.g. turning off lightbulbs) must persist to be effective. Studies that specifically aim to answer the question of longevity in household energy interventions arrive at contradictory results. While one study found a decline in significant effects of energy savings from feedback and tips after four weeks (Houde et al 2013), others found evidence of persistence over a two year period (Allcott 2011), with another finding not only persistence but some evidence of ongoing improvement from a feedback device over an eleven month period (Schleich et al 2017). Opposing tendencies may be at work in such interventions; households who receive feedback may become less motivated over time, or conversely, may become more adept at interpreting and responding to feedback or may be motivated to acquire more efficient appliances. In the case of the latter, the long lifetime of some devices may be such that the efforts of households who eventually replace them will not be noticed in a short-term study (Carroll et al 2014).
Comparing between domains
Our literature review produced more studies for interventions in household energy than for personal vehicles, air travel and diet combined, showing that about 75% of studies conducted to date (29 out of 40 included here) have focused on interventions in an area responsible for only about 20% of household emissions (Jones and Kammen 2011). Interventions into household energy are relatively easy to monitor, so even researchers who are not specialists in this domain can use these interventions to understand human psychology, prompting more peer reviewed publications in this area. Measurements in this domain are very precise because utility companies can easily quantify demand and are motivated to reduce it (for example by renewable portfolio standards that require increasing their capacity with renewables, thus incentivizing meeting existing demand more efficiently). Interventions in other domains such as personal vehicle use (or participation in cycling) are not as easily measured. Furthermore, studies regarding personal vehicle use have often been conducted by consulting agencies that have little motivation to release detailed results or publish them in peer reviewed journals (Möser and Bamberg 2008).
Due to the variance in the findings of different studies and the small number of suitable studies on diet and personal vehicles, we are unable to conclusively show whether interventions in one domain tend to be more effective or whether one type of intervention tends to be more effective in all domains (only four of 11 intervention types had more than three studies (table 1)). As more research is conducted and best practice for interventions is established, emissions reductions in these three domains may converge on separate values, though no convergence is notable at this time. Roughly speaking, personal vehicle interventions seemed to be the most effective at reducing emissions, followed by household energy and diet.
Even if interventions to reduce driving, meat eating, and home energy use are not yet optimized to reduce emissions, they can still offer many co-benefits, which may motivate or support their adoption. For instance, interventions that reduce personal vehicle use were conducted not only for greenhouse gas emissions reductions but also to reduce traffic congestion (Rufolo and Kimpel 2008) and local air pollution (Shoup 1997). Interventions for reducing meat consumption were also conducted in order to improve public health outcomes (Carfora et al 2017, Friis et al 2017) and interventions to reduce household energy use were conducted to conserve water (Willis et al 2010), reduce financial burdens on low-income households (Thondhlana and Kua 2016), or to reduce peak energy demand in response to government regulations (Martin and Rivers 2018) which may be motivated by local air pollution, energy security and so forth.
Given limited financial and human resources, most decision makers aiming to reduce greenhouse gas emissions will need to choose between different interventions in different domains. Decision makers might vary between public institutions, corporations, and cities, which may have different goals to reduce emissions and different possible targets of influence (e.g. cafeterias, commuters, and buildings). Some interventions with relatively low impact become highly desirable when considering the minimal cost and effort needed to implement them. Changing the default options on a cafeteria or restaurant menu presents few downsides, while interventions that require purchasing of additional office space (telecommuting centers) may be viewed as less appealing than their emissions reductions suggest. Several studies on household energy (Wilhite and Ling 1995, Allcott 2011, Arimura et al 2011) have addressed cost, but the majority of behavioural intervention studies do not report the time, cost, or feasibility of implementation, making comparisons of cost-effectiveness of actual emissions reductions achieved or expected (RAER) impossible. Studies which measure and report their own cost-effectiveness and greenhouse gas reductions will be more accurate than our post-hoc estimations and represent another area for future research.
Table 4. Key recommendations for future research on behavioural interventions, including examples that follow best practice or investigate each issue where possible.
| Issue | Recommendation | Examples of relevant studies |
|---|---|---|
| Seasonality and persistence | Increase study period or conduct follow-up | Alcott (2011), Houde et al (2013), Schleich et al (2017) |
| Analyze how results change over time | ||
| Experimental design |
|
Jakobsson et al (2002), Ayres et al (2013), McKerracher and Torriti (2013), Friis et al (2017) |
| Location | Conduct studies in non-OECD countries | Matsukawa (2004), Xu et al (2015), Sudarshan (2017) |
| Targeted interventions | Tailor interventions for different segments of the population based on level of energy consumption, education and/or income, and political outlook | Costa and Kahn (2013), Di Cosmo and O'Hora (2017), Gleerup et al (2010), Brandon and Lewis (1999) |
Recommendations for future research
An important recommendation for future research in behavioural interventions is that they study high-impact actions with large potential for reduced emissions, and that they include ambitious as well as incremental behaviours to reduce emissions within the domains of mobility, meat consumption, and energy use, in order to understand what actually works to achieve large reductions in emissions. For example, although we could not find any studies on reducing air travel, avoiding one roundtrip transatlantic flight (a one-time decision by one person) would create as much emissions reductions as 11 households participating for an entire year in one of the average interventions we investigated for home energy use (which must be sustained over time). To study reduced air travel, future investigations might explore the effect of reward programs that encourage local vacations or train travel instead of flights for family holidays. Large institutions with employees who have autonomy over travel decisions might test the effects of peer feedback comparison or the provision of cutting-edge, well-supported videoconferencing equipment on the frequency of air travel. The emissions associated with videoconferencing has been shown to be substantially less than the emissions of air travel, even when accounting for the indirect rebound effect (Matsuno et al 2007).
The review of available literature reveals some best practices for future research tracking the greenhouse gas reductions of behavioural interventions (table 4). Two key issues to consider are the study length and the experimental design (many were not RCTs). The literature on diets would especially benefit from studies with longer follow-up periods; the majority of studies described measurements for a period of weeks only, making it difficult to assess the persistence of any interventions. Finally, a number of studies, especially in the dietary domain, rely on self-reporting, which raises some doubts regarding the validity of these findings (Kormos and Gifford 2014).
While all but three of the studies reviewed here took place in rich, high-emitting countries where emissions reductions are most urgently needed (Peters et al 2015), it will be important to include developing countries in future research. Maintaining low levels of emissions while meeting social needs and increasing quality of life in poor countries will require better understanding of ways to reduce demand for high-carbon goods and services in societies and cultures that may differ from the contexts where most current research is being carried out. The interventions that are conducted in developing contexts need not be founded on messages of austerity for the sake of the climate—Thondhlana and Kua (2016) for instance test interventions that reduce energy usage and thereby save money for low-income households. Societies that take steps to prevent the rise in meat consumption strongly associated with affluence may also benefit from avoiding many of the concomitant negative health outcomes that have afflicted wealthy nations (Tilman and Clark 2014). We see work motivated by these and other co-benefits as important for the ethical implications of promoting PEBs in developing nations, which must take into account the context of sustainable development.
Moving forward it will be important to better understand the importance of rebound effects and persistence on interventions of all kinds, but especially so for diet and car travel which have been less thoroughly explored in the peer-reviewed literature. Because we are describing behavioural interventions which mostly focus on 'sufficiency actions' (e.g. turning off lightbulbs rather than purchasing more efficient lightbulbs), indirect rebound effects are more pertinent (Chitnis et al 2013). Indirect rebound effects include the increased consumption of other goods and services, which have their own embodied emissions. For our results, it would be useful to know if these effects are stronger in certain domains than others. Druckman et al (2011) find that the rebound effect is low for domestic energy reductions (7%), higher for personal vehicle use reductions (25%) and quite high for measures that reduce food waste (51%). Chitnis et al (2014) suggests that because expenditures on food are low in GHG intensity, savings from these areas are redistributed to other forms of household spending that tend to be relatively higher in GHG intensity (this may not be the case in all jurisdictions or circumstances). We have shown how interventions conducted in regions with high greenhouse gas intensity as measured in kgCO2e kWh–1 increase the effectiveness of those interventions (figure 3), but it is also true that interventions targeting high intensity actions as measured in kgCO2e/$ reduce the magnitude of the indirect rebound effect as well, making them more effective overall. Finally, the magnitude of the rebound effect is also dependent on the exact type of intervention even within the same domain; customers who are incentivized to conserve household energy may spend their saved income on other carbon-intensive purchases, while customers who choose to purchase more expensive green energy will have less income to spend on other purchases.
Strengths and limitations
Our use of different ranges of emissions intensities for household energy (figure 2) based on current regional variations hints at an important caveat to these results when looking towards the future: the magnitude of an intervention's effect is likely to change over time. As energy sectors decarbonize and household appliances become more efficient, interventions that reduce energy use will have a smaller effect in terms of absolute emissions reduced. We can similarly expect that vehicles will become more efficient over time (see supplementary materials 3). While improvements in farming practices may somewhat reduce the carbon footprint of meat products over time (Frank et al 2018), there is less scope for the technical potential of emissions reductions in meat production (Hedenus et al 2014), and the climate impact of these emissions increases if one adopts a climate metric for CO2-equivalence that more heavily weights high-impact but short-lived methane (Persson et al 2015) than does Global Warming Potential.
While the potential emissions reductions of interventions may shift with time or geography, they are also subject to the willingness of certain target populations to participate. Politically, liberals are more responsive to feedback about household energy usage than political conservatives, who were more likely to opt out of receiving feedback reports (Costa and Kahn 2013). High education households have been found to respond more sensitively to tariffs on peak electricity usage (Di Cosmo and O'Hora 2017) and more willing to participate in interventions that reduce energy consumption (Gleerup et al 2010). High energy users are also more likely to reduce their usage (Brandon and Lewis 1999) since they have more low-hanging fruit to pick. Thus, the success of an intervention is dependent on carefully targeting the correct population (table 4).
When comparing the expected emissions reductions from interventions between domains or even within domains, an important consideration that we were unable to fully account for in our estimations is persistence (table 4). The studies in our sample had a median duration of four months, which is not enough time to account for seasonal changes that may alter a participant's behaviour. For a study analyzing an intervention taking place over a single meal, this is a reasonable omission. But when determining the impact of a household energy intervention, the timing of the study could be quite important (only 10 of the 29 studies on household energy were one year in duration or longer). A low-impact intervention with strong persistence over time will gradually become more effective than a high-impact intervention with diminishing returns. Some behavioural interventions, like a restaurant default menu that acts on a changing population, are less likely to see such diminishing returns. Other interventions that rely on habit formation for longevity, such as providing tips to reduce household energy, may be more prone to declining effects.
Conclusion
Interventions that promote PEBs are well established in the domain of household energy, and those seeking to implement such treatments have a breadth of studies to rely on. One can be confident, for instance, that interventions that rely on feedback, taking advantage of best practice in the field including accounting for the boomerang effect in low-energy users, are likely to reduce household energy consumption and associated greenhouse gas emissions (mean annual reductions of 133 kgCO2e per household). But in other domains the literature is less convincing. While the high GHG intensity of driving means that successful interventions in this domain would produce considerable greenhouse gas reductions, and financial incentives are promising, more studies with objective measures are needed to increase robustness and examine other possible interventions. Research into interventions to reduce air travel are entirely lacking. Air travel is also a highly GHG-intensive form of transportation, and if successful interventions can be found they are likely to create substantial reductions, given the large contributions that air travel can make to an individual's personal carbon footprint (Wynes and Nicholas 2017, Lacroix 2018). Finally, the handful of interventions that have been studied to reduce meat consumption provide low to moderate reductions in emissions. Most of these studies are relatively recent, and more research in this area will hopefully establish interventions that are both persistent and substantial in effect. We recommend that future studies in all domains aim for best practice in experimental design: RCTs, observations instead of self-reporting, and follow-up measurements that span multiple seasons where possible. Results that can be used to quantify cost-effectiveness and greenhouse gas reductions rather than simply percent change or effect size allow for more useful comparisons between studies and an understanding of the actual utility of an intervention. However, the best studied interventions are not necessarily the most effective (they target a small behavioural change), and studies of major areas are missing (air travel) or very few (diet and personal vehicle use). Overall, emissions reductions observed through behavioural interventions to date are promising, yet much smaller than the scope and scale necessary to meet international climate targets. Further research that focuses on rigorously quantifying the emissions reductions achieved from ambitious, effective, and/or highly feasible interventions is urgently needed to inform the design and implementation of interventions that will be sufficient to avoid dangerous climate change.