

Abstract
Northwestern Canada is one of the most rapidly warming regions on Earth. The scale and rapidity of recently observed warming-induced changes throughout this region indicate that it is particularly sensitive to climate warming and capable of rapid responses to perturbations. Unprecedented rates of permafrost thaw in the zone of discontinuous permafrost are transforming forests to wetlands, and changing the distribution and routing of water over the landscape as evidenced by recent increases in basin discharge. However, the impact of increasing basin discharge on basin water storage is not well understood. Water levels on a permafrost plateau, channel fen, and isolated and connected bogs were monitored from 2003–2017 in the Scotty Creek watershed, Northwest Territories. The water level in the channel fen did not significantly change over the period of study, sustained by inputs from the increasingly-connected network of bogs as permafrost barriers thawed. Bogs with varying levels of connection to the drainage network released from storage between 40 and 53 mm of water over the study period. The water level in the monitored isolated bog did not significantly change over this period. Estimates of moisture contributions derived directly from vertical permafrost thaw and from the lateral expansion of contributing areas account for 90% of the observed cumulative increase of 1043 mm in basin runoff between 1998–2012, leaving 109 mm of this increase unaccounted for. Increasing connectivity to the drainage network and transient wetland drainage at the landscape scale resulted from permafrost thaw-induced talik development. The similarity between the magnitude of wetland drainage and that of enhanced runoff suggests that increased connectivity of wetlands to the drainage network may contribute to increasing runoff from the Scotty Creek watershed. Permafrost thaw-induced land cover transition was found to have both short and long-term effects on runoff generation.
Export citation and abstract BibTeX RIS

Original content from this work may be used under the terms of the Creative Commons Attribution 3.0 licence. Any further distribution of this work must maintain attribution to the author(s) and the title of the work, journal citation and DOI.
Introduction
Air temperatures in northwestern Canada are rising rapidly due to climate warming (Johannessen et al 2004, Kirtman et al 2013), leading to high rates of permafrost thaw within the discontinuous permafrost region; particularly near its southern boundary (Jorgenson and Osterkamp 2005, Baltzer et al 2013, Lara et al 2016). Significant land form change arising from permafrost thaw is observed throughout the discontinuous permafrost region (Rowland et al 2010), resulting in considerable changes to the landscape (e.g. Beilman and Robinson 2003, Quinton et al 2011) and the local hydrological cycle (Pohl et al 2009, Connon et al 2014). St Jacques and Sauchyn (2009) demonstrated a significant increase in mean annual flow in 39% of the 23 long-term (>30 yrs) flow records from basins throughout the Northwest Territories (NWT), with most of the increasing flow occurring in the southern NWT. This increase in runoff has not been accompanied by a corresponding increase in precipitation (Connon et al 2014). Changes to landscape water storage resulting from permafrost thaw-induced land form changes have been attributed to the observed increases in runoff in this region (Connon et al 2014, Connon et al 2015).
In peatland-dominated regions of the discontinuous permafrost zone, permafrost exists below forested peat plateaus while the intervening wetlands (e.g. collapse scar bogs and channel fens) are permafrost-free and generally treeless. The peat plateaus function primarily as runoff generators (Wright et al 2009), while the wetlands predominately store (collapse scars, flat bogs) or convey (channel fens) the water received from precipitation and from surrounding plateaus (Hayashi et al 2004). The thaw, subsidence and eventual removal of permafrost 'dams' increases the connectivity of previously-isolated wetlands to the drainage network, termed 'bog capture', through the activation of surface and subsurface flowpaths and increases runoff from a basin by expanding its contributing area (Connon et al 2014). Little is known about possible long-term (i.e. multi-year to decadal) water storage changes of the intervening wetlands with on-going permafrost thaw, and whether such changes support recent observed increases in basin discharge across the discontinuous and sporadic permafrost regions.
Permanent increases in basin runoff will occur with the expansion of the drainage network as a greater area of the basin is able to partition precipitation inputs toward runoff (Connon et al 2014), and will be most evident during periods of high moisture supply (Connon et al 2015). Transient increases will result from partial drainage of the bogs as they are incorporated into the runoff contributing area, similar to permafrost-thaw induced drainage of lakes in tundra regions (e.g. Pohl et al 2009). The duration of the partial drainage process for a single bog is uncertain but is postulated to be on the order of several years for large bogs, particularly as connections between the bog and adjacent wetlands expand and the hydraulic gradient between the draining wetland and the drainage network is established to contribute to the direction of flow. The transient increase in basin discharge may be prolonged due to the large number of bogs and the sequential drainage via bog capture (Quinton et al 2009). Understanding the difference between permanent and transient increases in basin runoff will help to identify the causes and evaluate the sustainability of the observed increases in basin discharge.
Water storage trends of a peat plateau, channel fen and several bogs including those which have become connected to the basin drainage network due to permafrost thaw were monitored from 2003–2017. This paper examines possible linkages between water storage within and runoff from the Scotty Creek basin, NWT, Canada. Specifically, this paper will: (a) assess if the amount of water comprising the increase in basin runoff from 1998–2012 may be balanced by the amount of water lost from the wetland storage; (b) determine the sustainability of the increase in basin discharge from Scotty Creek since the mid-1990s by estimating how much of it was a permanent increase to a new and higher level and how much was transient; (c) examine the relative runoff contributions of the land forms comprising the runoff contributing area; and (d) propose a new conceptual model that identifies the causal mechanisms and possible feedback processes of the rise in basin discharge from Scotty Creek.
Study site
The Scotty Creek Research Station is located within the sporadic to discontinuous permafrost zone (61.44°N, 121.25°W). The Water Survey of Canada gauged portion of the watershed covers 152 km2 (Quinton et al 2003, Quinton and Baltzer 2013) of heterogeneous upland moraines (48%), raised permafrost plateaus (20%), ombrotrophic bogs (19%), channel fens (12%), and lakes (2%) (Chasmer et al 2014). The forested peat plateaus are dominated by an overstory of black spruce (Picea mariana) trees, with an understory of ericaceous shrubs (e.g. Rhododendron groenlandicum), lichens (Cladonia spp.), and mosses (Sphagnum spp.). Channel fens are dominated by floating vegetative mats of predominantly sedges (Carex and Eriophorum) with individual tamarack (Larix laricina) and birch (Betula glandulosa) trees scattered throughout the fens (Garon-Labrecque et al 2015). Bogs in this basin are vegetated with ericaceous shrubs including leatherleaf (Chamaedaphne calyculata), bog rosemary (Andromeda polifolia), and small cranberry (Vaccinium oxycoccos) (Garon-Labrecque et al 2015). The dominant bryophyte species in the bogs include Sphagnum balticum and S. magellanicum (Garon-Labrecque et al 2015). Peat deposits in the basin range from 2–8 m deep (McClymont et al 2013).
This study was conducted in the headwaters of the basin. The headwaters area, located in the southern portion of the basin, is entirely composed of peatland land cover types including permafrost plateaus, bogs and fens. Water levels were monitored from 2003–2017 in seven locations representing the dominant land cover types in the sub-basin including one peat plateau, one channel fen, and five bogs of varying degrees of connection (figure 1). The level of connection of each bog to the drainage network was assessed both visually using LiDAR imagery (figure 1) and through field observations. The monitored peat plateau is underlain by permafrost, which has rapidly degraded both vertically and laterally over time (Quinton et al 2011), through which a talik has eventually formed, providing a subsurface connection between the adjacent bog and channel fen (Connon et al 2018). The average permafrost thickness was determined to be 9 ± 3 m in 2011 (McClymont et al 2013) and is rapidly thawing over time. As the permafrost beneath the plateau has degraded, the plateau surface has subsided and become increasingly inundated as it transitions to a wetland feature (Quinton et al 2011). Since measurements of this plateau began in 1999, the width of the plateau has decreased by more than half (Connon et al 2018). Flanking the plateau are a channel fen to the west (Fen), which conveys water to the basin outlet, and a connected bog to the east (C-Bog 1), which is directly connected to the fen at the surface as well as the subsurface via a talik through the plateau (figure 1). C-Bog 2, adjacent to C-Bog 1, is also a connected bog (figure 1). C-Bog 3 has a partial direct connection to the fen, which became visible on aerial imagery between 1977 and 2000 (Quinton et al 2011). The connection between the channel fen and C-Bog 3 has subsequently expanded as captured by the aerial image of 2008 (Quinton et al 2011) and the LiDAR image of 2010 (figure 1). C-Bog 4 has a connection to the adjacent bog located to the east, apparent both on the digital elevation model (figure 1) and confirmed by field observations. This bog may form part of a bog cascade draining into a channel fen to the east of C-Bog 4. I-Bog 1 is an isolated collapse-scar bog formed as a result of localized permafrost thaw and ground subsidence (figure 1).

Figure 1. Location of study region in Canada (a), map of Scotty Creek, NWT (b), and a 2010 WV2 image of the 0.25 km2 area of study within Scotty Creek (c). White dots represent the locations of wells in each of the monitored connected bogs (C-Bog), isolated bog (I-Bog), as well as channel fen and peat plateau sites.
Download figure:
Standard image High-resolution imageScotty Creek hydrology
Runoff from Scotty Creek steadily rose during the period of 1995–2012 (Connon et al 2014), with considerable enhancement of runoff from 1998–2012 despite no increase in precipitation in that period (figure 2). Similar runoff increases were recorded for the Jean-Marie, Birch and Blackstone rivers, the three neighbouring Water Survey of Canada gauged basins (see figure 2 for Jean-Marie runoff; Quinton et al 2009, Water Survey of Canada 2017).

Figure 2. (a) Total annual runoff (mm) measured at the Scotty Creek basin outlet (red line) and total annual precipitation (including both rain and snow; mm) measured at Fort Simpson (black line) from 1976–2015. Yellow area denotes extra observed runoff beyond that expected based on the mean of runoff ratios (R R) prior to 1996 and current precipitation patterns (blue line). Runoff from the neighbouring Jean-Marie watershed (grey line), which functions similarly to the Scotty Creek basin, from 1976–2015 is plotted to illustrate the observed shift in increased runoff post-1998 to 2012. (b) Relationship between observed Scotty Creek total annual runoff (mm) and observed Jean-Marie total annual runoff (mm) for the period of overlapping data, 1996–2015. All runoff amounts totalled over the water year (1 October–30 September).
Download figure:
Standard image High-resolution imageIn the Scotty Creek basin, analysis of aerial imagery to assess the rate of permafrost thaw based on land form conversion combined with an estimate of total ice volume in the basin determined the amount of water released by the melt of ice within permafrost that has thawed since 1995 to be approximately 9 mm yr−1, far less than the 137 mm yr−1 increase in runoff over the 1996–2012 period (Connon et al 2014). However, although such a direct contribution of permafrost thaw to the observed runoff increase was minor, permafrost thaw and resulting land form changes significantly alter basin runoff through changes to basin physiography. Several studies suggest that permafrost thaw can increase groundwater contributions to stream flow (Bense et al 2009, Bense et al 2012, St Jacques and Sauchyn, 2009, Sjöberg et al 2016). At Scotty Creek however, the November to March outflow, assumed to be sustained by groundwater input, contributes less than 5% to the total annual stream flow, indicating that the groundwater contribution, although it may be rising, is so small that it cannot account for the increased basin runoff (Connon et al 2014). The process of bog capture is a more plausible explanation of how permafrost thaw has led to increasing runoff from Scotty Creek (Connon et al 2014).
Methods
Hydrometric measurements
A single slotted stilling well was located at each site. Two wells were installed on the peat plateau, the first of which was located centrally on the plateau (referred to as Plateau Interior) and the other was installed approximately 5 m nearer to the plateau edge (referred to as Plateau Edge). Each well was equipped with a vented pressure transducer (Global Water WL15x and WL16s, Gold River, CA, USA). These vented transducers were used from 2003–2012, and in 2013 were replaced with total pressure transducers with internal data loggers (Levelogger Gold F15/M5, Solinst Canada Ltd, Georgetown, ON, Canada, and HOBO U20 Water Level Data Logger, Onset Computer Corporation, Bourne, MA, USA). To correct for barometric pressure, a barometric pressure transducer (Solinst Barologger Gold) was installed in the study area. During all study years, water level measurements were recorded at 30 min intervals. From 2003–2013, water level loggers were installed in the wells each year either during or immediately following the spring freshet and removed prior to freeze-up in the late summer or early fall. Beginning in 2014 for C-Bog 1 and the channel fen and in 2015 for all other wetland wells, the pressure transducers were lowered within each well at the end of the growing season and remained in the wells over the winter season.
To convert the pressure transducer measurements to actual water level depths, manual measurements from the top of the well casing to the water level were recorded typically at both sensor installation and removal. Absolute elevation, expressed in metres above sea level (m asl), for the top of each well casing was measured in May 2015 using a differential global positioning system (dGPS; SR530 RTK, Leica Geosystems Inc., Norcross, USA; system accuracy ±0.02 m).
Data analysis
Water level records for each of the eight long-term monitoring wells were compiled for the period of 2003–2017. Annual water level data was aligned using the manual measurements from the top of the well casing (ToC) to the water table at sensor installation. Manual measurements of ToC to water table at sensor removal were used to confirm the stability of each well. The water level record standardized with the installation manual measurements was within 0.9 ± 3.6 cm (n = 62) of the manual measurements at sensor removal, which is reasonable given the accuracy of manual well water level readings. In some instances when manual water level measurements at sensor installation were not available, the manual measurements collected during sensor removal were used to standardize the record for the year.
All water level readings at each site are expressed in absolute elevation (m asl) using the dGPS survey of well ToC elevation measurements and the manual measurements of water level below well ToC. By using the 2015 elevation survey for all years of the water level record, we are assuming that the wetland well elevations did not considerably change over this period. We do not expect drastic vertical shifts in the bog well positions over this period. Elevations from bog wells were compared with the fen well, which was anchored in the underlying mineral sediment. Elevations of the top of casing did not change over this period, suggesting that this assumption is valid. The water level records of the two wells located on the peat plateau were corrected to account for the subsidence of the ground surface over time as a result of permafrost thaw. Ground surface surveys of the peat plateau were conducted in 2002, 2006, 2009 and 2015 along a transect spanning the width of the plateau. A 3rd-order polynomial function was fit to the mean ground surface elevations in each of these measurement years and used to interpolate the mean ground surface elevation in the intervening years between surveys. This function was applied to both of the plateau wells (Plateau Interior and Plateau Edge). Assuming that the wells located on the plateau subsided at the same rate as the ground surface, the plateau water level records were expressed in absolute elevation according to this relationship.
Analysis of changing water balance contributions
Similar to Connon et al (2014), the runoff contributions of moisture inputs from permafrost thaw, precipitation directly on the expanding channel fen area, and runoff from the flanks of the remaining peat plateaus were estimated over the period of 1998–2012 during which runoff observed from the Scotty Creek basin exceeds that expected based on precipitation patterns and pre-1996 runoff ratios (see figure 2). Over the period of 1998–2012, the extra observed water year runoff beyond that generated by precipitation (figure 2(a)) was computed from the estimated pre-1996 runoff ratios for the Scotty Creek basin based on those of the neighbouring Jean-Marie basin, which functions hydrologically much the same way as Scotty Creek (Connon et al 2014). This approach was justified given the similar trend in annual runoff for the Scotty Creek and Jean-Marie River basins for the 18 years of overlapping record (figure 2(b)). Observed water year precipitation for the period of 1998–2012 was multiplied by the estimated pre-1996 runoff ratios to calculate runoff amounts expected for these years based on precipitation patterns alone (blue line in figure 2(a)). To determine the change in peat plateau areal coverage and edge length of the area contributing to stream flow from 1977–2010, Connon et al (2014) manually digitized aerial photographs and remotely sensed imagery over a 6-km2 area of interest to delineate the boundaries of permafrost and permafrost-free terrain and to determine the contributing area that is hydrologically connected to the drainage network. The change in contributing area determined by Connon et al (2014) from 1977–2010 was linearly pro-rated in this study to account for the further loss of permafrost plateau area by 2015, determined by Chasmer and Hopkinson (2017). The expansion in contributing area was used to estimate the amount of runoff derived from precipitation directly on the drainage network. Contributing area and plateau edge length differences over this period were also applied to the calculated runoff rates to estimate the fraction of the increased runoff that can be attributed directly to increased wetland connection to the drainage network and to primary runoff from the remaining plateau areas. Additional moisture derived from permafrost thaw was estimated using average permafrost thickness and peat porosity to determine a total ice volume underlying the permafrost areas in the basin between 1977–2010 (Connon et al 2014). Observed runoff from the Scotty Creek basin over the 1998–2012 period was compared to the expected runoff based on pre-1996 runoff ratios plus the additional inputs resulting from permafrost thaw including precipitation-induced changes in runoff from direct precipitation on the channel fen, and the non-precipitation induced sources of primary runoff from the plateau flanks, and moisture derived from thawing permafrost. The disparity between the observed runoff for 1998–2012 and that anticipated based on precipitation-induced and non-precipitation induced runoff changes from the increased contributing area was computed as a residual. This excess runoff which cannot be accounted for by these landscape changes was compared with the amount of water storage lost from wetlands as they become connected to the drainage network with the loss of intervening permafrost barriers.
Statistical analyses
All statistical analyses were performed using R statistical software (R Development Core Team 2014) with α = 0.05. All data were tested for normality using the Shapiro-Wilk test. As the data were determined to be normally-distributed, any potential significant trend in water level trajectory in each of the eight long-term monitoring wells over the period of record was assessed using a linear regression on the water level data collected at a 30 min interval. Arithmetic and areal-weighted average changes in water levels of the connected bogs over the 2003–2017 period were calculated and multiplied by an average porosity of 0.85, as determined for the upper 40 cm of peat by Quinton and Hayashi (2004), to estimate storage losses. To scale these storage loss estimates to the basin, a bog coverage estimate of 50% was further applied to the water yield estimates. This value represents the approximate wetland areal coverage in the headwaters portion of the basin (Quinton and Hayashi 2004, Quinton et al 2009).
Results and discussion
Land form storage trends
The mean water level of the peat plateau decreased over the period of record (figure 3(a)), with a significant decrease in the Plateau Edge water level of 511 mm (p < 0.001; table 1). In the Plateau Interior well, the water level decreased on average 205 mm over the measurement period, although this decrease was only marginally significant (p = 0.06; table 1). This contrast in water level trends and the rate of water level decline on the same peat plateau is likely a function of the well position. The Plateau Edge well is more susceptible to ground subsidence from both vertical loss and lateral permafrost degradation due to heat transfer from the adjacent flowing fen (Baltzer et al 2013, Connon et al 2018). The width of the plateau has diminished significantly since measurements began and the wetland edge is encroaching upon this well (currently 4 m from the well decreasing from 20 m at the time of installation). Consequently, the rate of water level decline in the Plateau Edge well is greater than that of Plateau Interior as the perched water table in the active layer lowers as the permafrost table subsides and the plateau width shrinks.
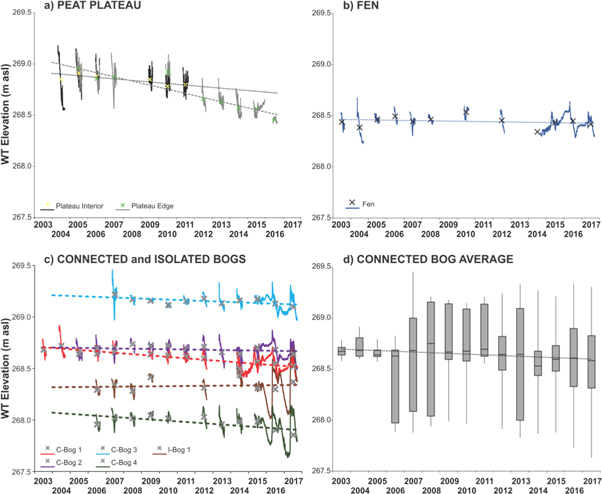
Figure 3. Water table elevations (in m asl) for the period of record for the (a) peat plateau, (b) channel fen, (c) representative connected and isolated bogs, and (d) boxplot of annual arithmetic average of all four monitored connected bogs. In (a)–(c), solid lines are the 30 min. water level records, 'x' symbols represent mean annual water level position in each site, and dotted lines represent linear best fit trends in water level over the period of record. The boxplots in (d) represent the 25th, 50th and 75th quartiles, with the whiskers representing the maximum and minimum annual arithmetic water level averages of the four connected bogs. See table 1 for regression statistics.
Download figure:
Standard image High-resolution imageTable 1. Change in mean water level (mm) from 2003 through to 2017 calculated from best fit trend for each of the eight long-term monitoring wells. p-values of significant regression trends are in bold.
| Site | Change in mean water level over record (mm) | Regression P-value | |
|---|---|---|---|
| Peat Plateau | |||
| Plateau Interior | −205 | 0.06 | |
| Plateau Edge | −511 | <0.001 | |
| Fen | |||
| Fen | −38 | 0.50 | |
| Isolated bogs | |||
| I-Bog 1 | +38 | 0.60 | |
| Connected bogs | |||
| C-Bog 1 (fully connected) | −219 | <0.0001 | |
| C-Bog 2 (fully connected) | −44 | 0.22 | |
| C-Bog 3 (partially connected) | −110 | 0.06 | |
| C-Bog 4 (partially connected) | −164 | 0.03 | |
| All connected bogs—arithmetic mean | Arithmetic mean: | −134 ± 66 | |
| (n = 4 bogs) ± 95% C.I. | With porosity = 0.85: | −114 ± 56 | |
| Watershed scale: | −57 ± 28 | ||
| All connected bogs—areal-weighted mean | Areal-weighted mean: | −109 ± 15 | |
| (n = 4 bogs) ± 95% C.I. | With porosity = 0.85: | −93 ± 13 | |
| Watershed scale: | −46 ± 6 | ||
Permafrost plateaus generate runoff as the underlying permafrost and seasonally frozen soil limit the amount of water that can be stored in the active layer (Wright et al 2009, Walvoord and Kurylyk 2016). As the permafrost beneath the plateau degrades and the peat surface subsides, the hydraulic gradient between the plateau and the adjacent wetland diminishes. Lowering of the hydraulic gradient, thickening of the suprapermafrost layer (i.e. the combined thickness of the active layer and talik) and reduction of plateau surface area with permafrost loss reduce subsurface runoff shed from the plateau area (Quinton and Baltzer 2013). Water storage capacity of these features increases as the permafrost table is lowered (Quinton and Baltzer 2013). Simultaneous lowering of the water table elevation of the transitioning plateau occurs as the underlying permafrost body degrades and no longer maintains a perched water table near the peat surface (figure 3(a)). The plateau water level is approaching that in the adjacent channel fen (figure 3) as the suprapermafrost layer thickness increases, which is causing the plateau response to precipitation events to become increasingly similar to that of the adjacent connected bog (C-Bog 1) and channel fen. Permafrost degradation and loss lower the plateau water table below the zone of high hydraulic conductivity (Quinton et al 2008) as the depth to permafrost increases thereby diminishing the runoff response to precipitation events (Quinton and Baltzer 2013). As these features transition to wetland, the water level in the newly-created bog or fen edge is typically located at or near the ground surface (Jorgenson and Osterkamp 2005). However, during dry periods the magnitude and timing of the runoff response may be dampened by the enhanced storage deficit within the active layer and since the water table resides in deeper peat layers of low hydraulic conductivity, flow rates are reduced. The greater connectivity between wetlands with the loss of permafrost barriers that impeded flow increases the area contributing to basin discharge, while reducing rapid runoff generation from plateau landforms to the surrounding wetlands.
Three of the four monitored connected bogs exhibited a significant water level decrease over the measurement period (table 1). The water level of C-Bog 1, which is fully connected to C-Bog 2 and the channel fen via the surface and subsurface through a talik (Connon et al 2018) (see figure 2), significantly decreased from 2003 through to 2017 by 219 mm (p < 0.0001) and is approaching the position of the water level in the channel fen (figure 3(c), table 1). The water level decrease in C-Bog 2 (44 mm), which is connected to C-Bog 1 and another bog to the southeast, was not significant (p = 0.22). The water level in C-Bog 3, which is partially connected to the channel fen, exhibited a marginally significant decline of 110 mm (p = 0.06; figure 3(c), table 1). The water level trend of C-Bog 3 suggests that this bog is draining as a result of recent bog capture with the fen (Connon et al 2014). In C-Bog 4, the water level significantly decreased over the period of record (164 mm decrease, p = 0.03). This bog may comprise part of a collapse scar feature potentially contributing runoff to the eastern fen as its connection expands. The relatively recent connection of C-Bog 3 to the channel fen with the loss of the intervening permafrost barrier accounts for the steady decline in water level in this bog through the period of record as the connection broadens with continued permafrost thaw. The continued decline in water storage in C-Bog 1 and C-Bog 2 throughout the period of water level records is likely a function of the expansion of the fen connection facilitating more direct and efficient drainage in the direction of flow according to the gradient of the basin and the enhancement of the area contributing to runoff generation.
Sustained by inputs of upstream lake exports, groundwater discharge (Hayashi et al 2004), as well as contributions from bogs connected directly, partially or seasonally, the channel fen water level remained effectively unchanged over the period (figure 3(b)), with a non-significant (p = 0.50) decrease of 38 mm (table 1). In contrast to the trend of the connected bogs, the water level in I-Bog 1, which is isolated from the drainage network by surrounding permafrost plateaus was unchanged over the period of record (38 mm increase, p = 0.60; figure 3(c)). Water storage in I-Bog 1 is likely governed by the balance between precipitation and evapotranspiration as there is no obvious connection with any surrounding wetlands (figure 1).
Partitioning runoff sources
In the neighbouring Jean-Marie watershed, annual runoff ratios between 1976 and 1996 remained fairly constant. Since discharge measurements began in 1996 for the Scotty Creek basin, runoff has steadily increased (figure 2). In 1996 and 1997 however, observed runoff from Scotty Creek was lower than expected based on precipitation amounts and pre-1996 runoff ratios likely due to low precipitation amounts received by the basin in 1996 (figure 2). Between 1998–2012, runoff observed at the Scotty Creek basin outlet exceeded the amount expected based on precipitation patterns and the mean runoff ratio prior to 1996 by 1043 mm (figure 2). This observed shift in the magnitude of runoff exported from the basin has been attributed to a threshold response of permafrost loss triggered by the El Niño—Southern Oscillation (ENSO) year of 1997–1998 (Chasmer and Hopkinson 2017). Significant increases in air temperature and changes in precipitation patterns following 1997 with an increase in the proportion of precipitation received as snow, a considerable reduction in snow cover duration and an associated increase in shortwave energy received by the landscape, were concluded to be the main drivers causing accelerated permafrost loss in the Scotty Creek basin after 1997 (Chasmer and Hopkinson 2017). From 1997–2011, Chasmer and Hopkinson (2017) also noted a shift to higher runoff ratios which could not be accounted for by changes in the proportion of snow received by the basin or by the additional moisture inputs derived from thawing permafrost.
In this study we observe that the source of increased runoff during this period is predominantly the result of the expansion in area contributing to basin runoff due to the loss of permafrost (table 2). This concurs with the previous findings of Connon et al (2014), which presented similarly partitioned estimates for the 2012 water year. Of the extra cumulative 1043 mm of runoff over the 1998–2012 period beyond that expected from precipitation alone and pre-1996 runoff conditions, approximately 52% (539 mm) is the result of greater effective precipitation which is available to be partitioned to runoff directly to the expanding channel fen areas (table 2). Another 27% of the total extra runoff (284 mm) is contributed from the banks of the degrading plateaus (termed primary runoff), which decrease in areal coverage and become increasingly fragmented with permafrost loss (Baltzer et al 2013, Connon et al 2014). Therefore, 79% of the increased runoff from 1998–2012 can be attributed to the increased contributing area and drainage efficiency resulting from the loss of permafrost plateau barriers. Direct moisture contributions from thawing permafrost are estimated to account for approximately 11% of the increased runoff (110 mm; table 2). Although these non-precipitation induced contributions account for 90% of the increased basin runoff, a residual of 109 mm remains to be accounted for (table 2).
Table 2. Expected 1998–2012 runoff calculated with the 25% trimmed mean runoff ratios from 1976–1995 (beginning of period of apparent increase in stream flow) and observed precipitation for 1998–2012. Additions from the conversion of ground ice to water as a result of permafrost thaw, increased drainage areas and increases to plateau runoff are factored into the 'New Total'. Plus/minus columns indicate the range of runoff that may be expected (minimum and maximum estimates of trimmed runoff ratios). Unaccounted water is calculated by subtracting the new total from the observed 1998–2012 runoff.
| Additional inputs (mm) | ||||||||||||
|---|---|---|---|---|---|---|---|---|---|---|---|---|
| 1998–2012 total precipitation with 1976–1995 runoff ratios (mm) | + | − | Thawed permafrost | Channel precipitation | Primary runoff contributing areas | New total (mm) | + | − | Observed 1998–2012 runoff (mm) | Mean unaccounted water (mm) | Range of unaccounted water (mm) | |
| 1393 | 319 | 309 | 110 | 539 | 284 | 2327 | 319 | 309 | 2436 | 109 | −210 | 418 |
The long-term water level records presented here illustrate water level decline over a period of active drainage from 2003–2017 in bogs with varying levels of connection to the drainage network (table 1, figure 3(c)). In contrast, the water levels in an isolated bog remained virtually unchanged (figure 3(c)). The increased connectivity between wetlands and the drainage network resulting from the loss of intervening permafrost triggers a transient loss in storage of these previously-isolated features. An arithmetic average of the water table elevation change observed across all monitored connected bogs exhibited a decline of approximately 134 ± 66 mm (mean ± 95% confidence interval) over 15 years (table 1). Given that there is considerable variation in the size of bogs monitored as well as the magnitude of water level decline, an areal-weighted average water table elevation change was also calculated and yielded a similar mean of a 109 ± 15 mm decline (table 1). Scaling the areal-weighted mean up to the Scotty Creek watershed, with 50% bog cover and estimating an average peat porosity of 0.85 (Quinton and Hayashi 2004), water contributed to basin runoff from the storage loss in increasingly-connected wetlands over the monitored period of active drainage ranges from 40 to 53 mm, with an average of 46 mm (table 1). Although the timeframes of the water level and extra runoff values do not align perfectly, the similarity in storage loss magnitude from the connected bogs over the 15 year period of 2003–2017 to the extra runoff unaccounted for by contributing area changes over the 15 year period of enhanced runoff from 1998–2012 may suggest wetland storage loss as a contributor to runoff.
The 1997–1998 ENSO year is suggested to have accelerated permafrost thaw (Chasmer and Hopkinson 2017) with talik development the likely mechanism facilitating this threshold shift (Connon et al 2018). These layers of perennially unfrozen ground located between the active layer and the underlying permafrost form when energy inputs conducted into the ground exceed the amount of energy released over the winter (Atchley et al 2016, Connon et al 2018). Advective heat from water flowing through taliks may accelerate the degradation of a permafrost body and further prevent re-freeze during the winter months (Kurylyk et al 2016). Using a space-for-time substitution approach, Connon et al (2018) suggest that the suprapermafrost layer thickness will increase, rapidly degrading the underlying permafrost over a period of years to decades once a talik opens. Therefore, the 15 year period of augmented basin runoff from the ENSO event in 1997–98 through to 2012 may suggest that ENSO-induced talik development likely contributed to thaw-induced drainage enhancement from the Scotty Creek watershed. The disparity between observed and expected runoff increases steadily over this period, except during years with low net ground heat flux (2004 and 2008; figure 2), limiting further permafrost thaw. Similar anomalies in thaw depth and suprapermafrost layer thickness have been observed by Quinton and Baltzer (2013) and Connon et al (2018). The subsequent decline in the magnitude of extra runoff towards the end of the 15 year period in 2013 suggests that the response of the threshold shift induced by the ENSO event may be transient in nature in the discontinuous and sporadic permafrost landscape.
Permanent and transient influences on runoff generation
The increased proportion of precipitation partitioned to runoff directly reflects the physical changes to land form resulting from permafrost thaw, and as such can be considered a permanent change in basin hydrological function. Between 1977–2015, the runoff contributing area of Scotty Creek has increased from approximately 31.4% to 46.3% due to permafrost thaw based on digitized aerial photographs and remotely sensed imagery from 1977–2010 (Connon et al 2014) and forecast through to 2015 (Chasmer and Hopkinson 2017). As a result of this increase, runoff from the basin would be expected to increase by 539 mm when accounting for the influences of precipitation-induced runoff (table 2), assuming no change in runoff production per unit of contributing area.
The magnitude of transient contributions to runoff responses in this transitioning landscape may depend upon antecedent moisture conditions. Although the overall trend of discharge from the Scotty Creek watershed has been increasing since recording began in 1996, years with lower precipitation amounts have also coincided with lower annual discharge (figure 2). Therefore, the effects of increased connectivity among wetlands on basin discharge are likely dependent upon the storage deficits within these wetlands (Connon et al 2015). In drier years with low precipitation amounts, moisture levels are not sufficient to activate runoff pathways, resulting in storage in most bogs with minimal, if any, connection to the drainage network. Therefore, in order for the newly-connected wetlands to contribute to basin discharge the storage capacity of the wetlands must be exceeded. When antecedent moisture levels are low, precipitation on the landscape will contribute to fulfilling the storage deficit. Runoff from the expanded contributing area resulting from increasingly-connected wetlands to the drainage network will occur when storage deficits have been satisfied.
Conceptual model of landscape transition effects on storage-runoff relationship
A conceptual model of the manner by which increased connectivity among previously-isolated bogs contributes to the hydrograph of the Scotty Creek basin and similar watersheds in the discontinuous permafrost region, transitioning via the formation of permafrost-wetland complexes, may be proposed based on the observed water level trends from 2003–2017 (figure 4). As an isolated bog becomes connected, an initial pulse is contributed to basin runoff over a transient period. Once storage within an individual captured bog declines to the level of the connected channel fen with the loss of the hydraulic gradient, the contribution of that bog to overall basin runoff diminishes (figures 4(a), (b)). As an example, the water levels in both C-Bog 1 and C-Bog 2, which have been connected to the channel fen for decades, continue to decline as their connections broaden and are approaching the water level elevation of the adjacent fen. Each isolated bog becomes connected at different times as localized bodies of permafrost are lost. As such, a cascading effect in runoff contributions would be expected to be observed as numerous individual bogs across the watershed (Quinton et al 2009) become captured, resulting in an additional transient increase in runoff that may last on the order of years to decades. Basin runoff will not return to 'pre-connection' conditions due to the expanded contributing area as each bog is captured. It is likely that the enhancement of the drainage network contributing area will result in a permanent increase in basin runoff, despite the eventual diminishing return of transient wetland storage contributions as bogs drain (figure 4(c)). Although the contribution of primary runoff from the banks of the permafrost plateaus will reach a point beyond which it will decline, the increased contributing area connected to the drainage network in periods of sufficient moisture supply will sustain enhanced runoff levels. The main limitation to this increase is likely moisture availability from precipitation and the activation of secondary runoff pathways between collapse scar bogs and the drainage network (Connon et al 2015). Low moisture availability after 2012 is likely the dominant factor in the apparent return of runoff from Scotty Creek to pre-1996 conditions (figure 2). Limited moisture and the lack of active connections from collapse scar bogs to the drainage network restrict flow to the basin outlet.

Figure 4. Conceptual model for the transition of the permafrost landscape, from (a) the initial condition with wetlands isolated from drainage networks with perched, flashy water tables on permafrost terrain and interannual runoff generation in response to precipitation trends. (b) As permafrost barriers are lost and perched plateau water tables subside, bogs drain as a result of the newly-formed connections to channel fens, with bog and plateau water levels approaching the level of the drainage channel and runoff begins to increase without a corresponding increase in precipitation. (c) Due to the enhanced contributing area partitioning precipitation to runoff, basin runoff is elevated as compared to pre-connected conditions as bog drainage across the basin approaches a diminishing return. Plateau water level responses become increasingly attenuated and follow a similar trend to adjacent wetlands. Vertical dashed lines in water table plots denote annual cycles, while points in precipitation and runoff plots represent annual totals. Changes in the runoff and precipitation trends along the three transitional phases are represented by the incremental addition of data for plots (a) through to (c).
Download figure:
Standard image High-resolution image
Summary and implications
Runoff from the Scotty Creek watershed has been increasing since measurements began in 1996 (figure 2; Connon et al 2014). However, total precipitation has remained virtually unchanged over this period. Accelerated permafrost thaw and landscape change in this basin triggered by an ENSO event in 1997–1998 (Chasmer and Hopkinson 2017) may contribute to further enhancing runoff from Scotty Creek over the period of 1998–2012 beyond that expected from trends in precipitation. Both transient and permanent changes to the landscape as a result of permafrost degradation and loss may account for the disparity between the level of runoff anticipated given current precipitation trends and that which is observed draining the basin over this period. Moisture inputs from thawing permafrost comprise a small contribution to the observed enhanced runoff (∼11%). Significant runoff from effective precipitation directly on the channel and primary runoff from the banks of degrading permafrost plateaus, accounting for nearly 80% of the extra observed runoff from 1998–2012, are considered permanent contributions elevating basin runoff. Elevated runoff from expanding contributing areas connected to the basin drainage network will likely be the result of more efficient conversion of precipitation to runoff over a larger area when moisture supplies are high. Transient contributions will also enhance basin runoff as isolated collapse scar bogs become connected to the drainage network with the loss of intervening permafrost barriers. Drainage of previously-isolated bogs may occur over short timeframes as connections to the drainage network are established. As the connections to the channel fens expand, storage in connected bogs declines as water is routed through the basin more efficiently and directly with the loss of underlying permafrost. The water levels in connected bogs in the Scotty Creek watershed have declined over the measurement period of 2003–2017, yielding approximately 40–53 mm of water directed to basin runoff. The drying of wetlands in the discontinuous permafrost zone may have important consequences on water availability and seasonal hydrological processes in northern ecosystems.
Acknowledgments
We acknowledge the contributions of all those involved in data collection at Scotty Creek. We also wish to thank the Dehcho First Nation for their support and acknowledge that the Scotty Creek Research Station is located on Treaty 11 land. We acknowledge funding support from the Changing Cold Regions Network (CCRN) and a Natural Sciences and Engineering Research Council of Canada (NSERC) Discovery Grant. We thank the anonymous reviewers for their constructive comments.