

Abstract
Anthropogenic climate change is altering ecological and human systems globally, including in United States (US) national parks, which conserve unique biodiversity and resources. Yet, the magnitude and spatial patterns of climate change across all the parks have been unknown. Here, in the first spatial analysis of historical and projected temperature and precipitation across all 417 US national parks, we show that climate change exposes the national park area more than the US as a whole. This occurs because extensive parts of the national park area are in the Arctic, at high elevations, or in the arid southwestern US. Between 1895 and 2010, mean annual temperature of the national park area increased 1.0 °C ± 0.2 °C century−1 (mean ± standard error), double the US rate. Temperature has increased most in Alaska and its extensive national parks. Annual precipitation of the national park area declined significantly on 12% of national park area, compared to 3% of the US. Higher temperatures due to climate change have coincided with low precipitation in the southwestern US, intensifying droughts in the region. Physical and ecological changes have been detected and attributed mainly to anthropogenic climate change in areas of significant temperature increases in US national parks. From 2000 to 2100, under the highest emissions scenario (representative concentration pathway [RCP] 8.5), park temperatures would increase 3 °C–9 °C, with climate velocities outpacing dispersal capabilities of many plant and animal species. Even under the scenario of reduced emissions (RCP2.6), temperature increases could exceed 2 °C for 58% of national park area, compared to 22% of the US. Nevertheless, greenhouse gas emissions reductions could reduce projected temperature increases in national parks by one-half to two-thirds.
Export citation and abstract BibTeX RIS

Original content from this work may be used under the terms of the Creative Commons Attribution 3.0 licence. Any further distribution of this work must maintain attribution to the author(s) and the title of the work, journal citation and DOI.
Introduction
Anthropogenic emissions of greenhouse gases have increased global temperature 0.85° ± 0.2 °C century−1 from 1880 to 2012 (IPCC 2013), causing glacial melt (Vaughan et al 2013), wildfire increases (Abtazoglou and Williams 2016), biome shifts (Gonzalez et al 2010), plant and animal range shifts (Chen et al 2011), and other historical impacts around the world (IPCC 2014). Continued climate change increases future vulnerabilities of ecosystems to plant and animal extinctions (Urban 2015), range losses (Warren et al 2018), invasive species (Early et al 2016), and other disruptions (Settele et al 2014). Conservation of intact ecosystems and protection of endangered species rely considerably on national parks around the world because they form the core of the global protected areas network (UNEP-WCMC and IUCN 2016). The shifts of biomes and species ranges that are occurring due to climate change increase the importance of national parks, which can offer habitat refugia for climate-sensitive species (Johnston et al 2012, Jones et al 2016). Furthermore, national parks provide ecosystem services, including protection of watersheds that provide drinking water for people (Null 2016) and conservation of forests that store carbon, mitigating climate change (Melillo et al 2016).
National parks in the US protect unique ecosystems, biodiversity, and cultural sites in a network of 417 protected areas that cover 4% of the US, including Yellowstone National Park, the first national park in the world. Field research in US national parks has contributed to the detection of 20th century changes to glaciers, wildlife, and vegetation and attribution of the causes of those changes mainly to anthropogenic climate change (Moritz et al 2008, van Mantgem et al 2009, Marzeion et al 2014, Gonzalez 2017). Under continued climate change, analyses project future vulnerabilities of ecosystems in US national parks to glacial melt (Hall and Fagre 2003), increased wildfire (Westerling et al 2011), vegetation shifts (Cole et al 2011, Eigenbrod et al 2015), and wildlife extirpations (Stewart et al 2015, Wu et al 2018).
Effective resource management under climate change will require spatial data of exposure to climate change to analyze future vulnerabilities of species, ecosystems, and resources, since vulnerability is mainly a function of exposure, sensitivity, and adaptive capacity (IPCC 2007, Dawson et al 2011). Spatial analyses that identify vulnerable areas and potential refugia can guide prioritization of locations for habitat conservation, fire management, invasive species control, and other actions under climate change. So, achieving the mission of the US National Park Service to conserve resources unimpaired for future generations benefits from spatial data on climate change trends. Past studies examined climate exposure of 57 (Hansen et al 2014) and 289 large parks (Monahan and Fisichelli 2014), but no research has previously conducted a comprehensive analysis across all US national parks. Consequently, the magnitude of climate change in many parks and in the national park area relative to the entire US have been unknown.
Here, we address these knowledge gaps in the first spatial analysis of historical and projected temperature and precipitation changes across all US national parks. The objectives of this research are to: (1) determine the magnitude and spatial patterns of climate change across all US national parks, (2) characterize the magnitude of climate change in the national park area relative to the entire US, and (3) identify the individual parks most exposed to climate change.
Methods
Research area
The research covered the land area of the 50 US states, the District of Columbia, and four US territories, with analyses of the US as a whole, each of six geographic domains (contiguous 48 states, Alaska, Hawaii, Puerto Rico and Virgin Islands, Guam, American Samoa), the area of all 417 US national parks together (national park area), and each individual park. Analyses use the national boundary vector file from the US Geological Survey (https://nationalmap.gov, April 2014) and the national park boundaries vector file from the US National Park Service (http://irma.nps.gov, October 2017). Corrections of the national park boundaries file to conform with the official National Park Service list of 417 national parks (http://nps.gov/aboutus, January 2017) included removal of areas that were not national parks, corrections to some individual park boundaries, and tracing and addition of boundaries of new national parks not yet in the file, from publicly available information related to park establishment.
Historical climate data and analyses
For historical climate, we analyzed previously published spatial climate data of monthly temperature and precipitation, gridded and interpolated from weather station observations (table S1 is available online at stacks.iop.org/ERL/13/104001/mmedia). Historical trends mainly span the years 1895 to 2010, the period with spatial climate data available for the entire US, with analyses of the period 1895–2016 for the contiguous states. For the contiguous states, the 800 m spatial resolution Parameter-elevation Relationships on Independent Slopes Model (PRISM) time series (Daly et al 2008) was used. For Alaska, Hawaii, Guam, and American Samoa, PRISM-derived 30-year climatologies (Alaska, 771 m; Hawaii, 500 m; Guam, American Samoa, 100 m) were used to downscale by bilinear interpolation the 0.5° (∼50 km) spatial resolution University of East Anglia Climatic Research Unit (CRU) time series (Harris et al 2014). Time series for Alaska were previously downscaled by the University of Alaska, Fairbanks (https://snap.uaf.edu). Differences between an individual month in the coarse-resolution time series and the finer resolution baseline climatology were added to (for temperature) or multiplied by (for precipitation) the baseline value to produce a finer resolution version of each month in the time series. For Puerto Rico and the Virgin Islands, the 0.5° CRU data were not downscaled, but were divided into 18.5 km spatial resolution pixels.
Most original data files were unprojected rasters in the geographic reference system, where the surface area of pixels varied with latitude. We projected all files to equal area projections (Lambert Azimuthal Equal Area, contiguous 48 states; Albers Equal Area Conic, other areas) to produce pixels of the same surface area for the accurate calculation of spatial statistics. Area-weighted averaging of results from the six domains gave results for the national park area and the US as a whole, except for the linear regression trends (described below), which were directly calculated for the US as a whole. Results extracted for each of the 417 national parks cover all pixels that completely contain an individual national park.
We calculated historical trends by linear regression, corrected for temporal autocorrelation, following Intergovernmental Panel on Climate Change (IPCC) methods (IPCC 2013). Linear least squares regression of mean annual temperature and annual precipitation versus time for the US, national park area, each domain, and each national park gave the historical trends, standard errors, and statistical probabilities. Because simple linear least squares regression may overestimate probabilities of temporal trends by omitting temporal (serial) autocorrelation, we used restricted maximum likelihood estimation (Patterson and Thompson 1971, Cooper and Thompson 1977) which, through calculation of the autocorrelation coefficient (Box and Jenkins 1976) and effective sample size (Thiébaux and Zwiers 1984, Zwiers and von Storch 1995), provides more robust estimates of probability. Climate velocity, the speed at which an area of constant temperature moves horizontally under climate change, was calculated using a previously published method (Loarie et al 2009).
Projected climate data and downscaling
For future projections, we conducted bias-corrected statistical downscaling of the coarse-resolution output of all general circulation models (GCMs) available for the most recent IPCC assessment report (IPCC 2013). We downloaded Coupled Model Intercomparison Project Phase 5 (https://esgf-node.llnl.gov/search/cmip5) monthly output for all four IPCC emissions scenarios, the representative concentration pathways (RCPs) (Moss et al 2010), for all GCMs available in October 2012 (table S2).
Using the historical climate spatial datasets as baselines, we used the bias correction and spatial disaggregation (BCSD) method (Wood et al 2004) to statistically downscale the coarse-resolution GCM output for the periods 1971–2000, 2036–2065, and 2071–2100. For each GCM grid cell, a bias correction function was generated by matching the empirical cumulative density function (CDF) of a GCM-modeled 1971–2000 period with the CDF of the actual historical 1971–2000 data for each month for temperature and precipitation. The bias of the modeled historical run (1971–2000) of each GCM was corrected by quantile-quantile mapping, which involved identifying the probability of the uncorrected variable value from the model CDF, then finding the corresponding variable value for that probability on the historical CDF. When correcting the bias of the projected temperature runs of each GCM, the modeled mean temperature change was first subtracted from the uncorrected projected value to get the projected values in the same range as the historical values, then the probability of the residual projected value was identified, the corresponding variable value on the historical CDF was found, and the modeled mean temperature change was added back to the bias-corrected projected temperature value. Residual projected temperature values greater than the maximum historical value were corrected using the correction value of the maximum historical value. For projected precipitation, subtracting the modeled change was not needed before the bias correction (Wood et al 2004).
Differences (for temperature) or ratios (for precipitation) of coarse-resolution GCM values and the fine-resolution historical baseline were calculated and bilinear interpolation was used to downscale the coarse grid cells to the finer historical resolution. After BCSD downscaling, the mean, standard deviation, and, for precipitation, the fraction of models agreeing on the direction of change were calculated for each ensemble. Area-weighted averaging of results from the six domains gave results for the national park area and the US as a whole.
Results
Historical climate changes
Between 1895 and 2010, mean annual temperature of the national park area increased at double the rate of the US as a whole (table 1, S3; figure 1) with significant increases in all six geographic domains. For the contiguous 48 states, the rates of temperature increase from 1895 to 2016 were 0.7 °C ± 0.1 °C century−1 (national park area, P = 0.006) and 0.4 °C ± 0.1 °C century-1 (US, P < 0.0001), greater than for the period 1895–2010. A greater fraction of national park area (63%) experienced significant temperature increases than the US as a whole (42%) (table S3). The highest mean annual temperature increases were in Alaska (figure 2), consistent with analyses of weather station measurements (Bieniek et al 2014), US National Climate Assessment spatial analyses (USGCRP 2017), and IPCC (2013) spatial analyses of the principal global temperature time series (Hansen et al 2010, Morice et al 2012, Vose et al 2012). Historical trends show high spatial variation (figure S1). Seasonally, winter, spring, and summer showed similar rates of increase for the national park area, while the greatest temperature increase for the US occurred in winter (table S4). Climate velocity is generally lower in mountain areas than in flat terrain (Loarie et al 2009, Dobrowski et al 2013), so average climate velocity between 1895 and 2010 was lower in the national park area, which is more mountainous than the US as a whole (table S3, figure S2).
Table 1. Climate changes across the US and US national park area. Historical trends and standard errors from linear regression, after correction for temporal autocorrelation. Historical period for areas outside the contiguous states is 1901–2009, the period of available spatial data. Historical precipitation trends relative to average of entire period. Projected changes and standard deviations for the difference between the periods 1971–2000 and 2071–2100, from ensembles of all general circulation model output available for IPCC (2013).
| 1895–2010 | 2000–2100 | ||||||
|---|---|---|---|---|---|---|---|
| Area | Temperature | Precipitation | Temperature | Precipitation | |||
| RCP2.6 | RCP8.5 | RCP2.6 | RCP8.5 | ||||
| km2 | °C century−1 | % century−1 | °C century−1 | % century−1 | |||
| United States | |||||||
| Contiguous 48 states | 7.8 × 10⁶ | 0.3 ± 0.2 | 7 ± 2 ** | 1.7 ± 0.8 | 5 ± 1.1 | 5 ± 8 | 7 ± 24 |
| Alaska | 1.5 × 10⁶ | 1.2 ± 0.3 *** | −7 ± 3 * | 2.5 ± 1.1 | 6.9 ± 1.6 | 11 ± 7 | 31 ± 11 |
| Hawaii | 1.7 × 10⁴ | 1.6 ± 0.1 *** | −14 ± 6 * | 1.1 ± 0.4 | 3.2 ± 0.8 | 1 ± 200 | 10 ± 56 |
| Puerto Rico, Virgin Is. | 9.3 × 10³ | 1.3 ± 0.1 *** | −8 ± 5 | 1 ± 0.4 | 3 ± 0.6 | 0.1 ± 11 | −23 ± 26 |
| Guam | 5.6 × 10² | 0.2 ± 0.05 *** | −1 ± 5 | 1 ± 0.3 | 3 ± 0.6 | 6 ± 15 | 19 ± 32 |
| American Samoa | 1.6 × 10² | 1.4 ± 0.1 *** | 5 ± 5 | 0.9 ± 0.3 | 2.7 ± 0.6 | −1 ± 17 | 3 ± 25 |
| Total | 9.3 × 10⁶ | 0.4 ± 0.1 ** | 4 ± 2 * | 1.8 ± 0.8 | 5.3 ± 1.2 | 6 ± 8 | 11 ± 22 |
| National Park System | |||||||
| Contiguous 48 states | 1.3 × 10⁵ | 0.6 ± 0.1 *** | 4 ± 2 | 1.6 ± 0.7 | 4.9 ± 1 | 6 ± 8 | 7 ± 17 |
| Alaska | 2.2 × 10⁵ | 1.2 ± 0.3 *** | −7 ± 3 * | 2.5 ± 1.1 | 6.6 ± 1.5 | 11 ± 7 | 30 ± 11 |
| Hawaii | 1.8 × 10³ | 1.3 ± 0.1 *** | −7 ± 6 | 1.1 ± 0.4 | 3.2 ± 0.8 | 1 ± 260 | 12 ± 51 |
| Puerto Rico, Virgin Is. | 39 | 1.4 ± 0.1 *** | −8 ± 5 | 1 ± 0.4 | 2.9 ± 0.6 | −0.1 ± 10 | −22 ± 25 |
| Guam | 5 | 0.2 ± 0.05 *** | −1 ± 5 | 1 ± 0.3 | 3 ± 0.6 | 6 ± 15 | 19 ± 32 |
| American Samoa | 13 | 1.4 ± 0.1 *** | 5 ± 5 | 0.9 ± 0.3 | 2.7 ± 0.6 | −1 ± 17 | 3 ± 24 |
| Total | 3.6 × 10⁵ | 1.0 ± 0.2 *** | −4 ± 2 | 2.2 ± 0.9 | 5.9 ± 1.3 | 9 ± 9 | 21 ± 14 |
Significance: * P ≤ 0.05, ** P ≤ 0.01, *** P ≤ 0.001.
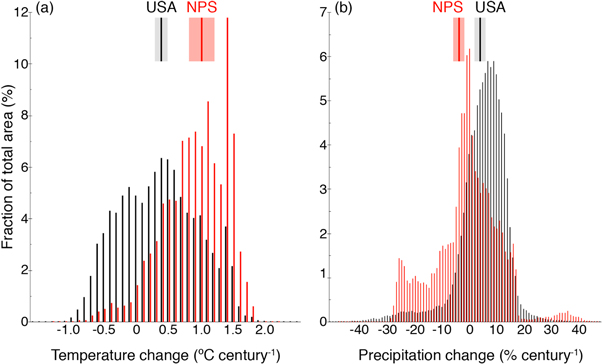
Figure 1. Historical climate change, 1895–2010. Fractions (%) of the US national park area (NPS) and the US (USA) experiencing changes in (a) mean annual temperature (°C century−1) and (b) annual precipitation (% century−1) (relative to 1895–2010 average precipitation). Mean (dark bar) and standard error (shaded rectangle) are indicated for each area as a whole.
Download figure:
Standard image High-resolution image
Figure 2. Historical climate change, 1895–2010. (a) Mean annual temperature change (°C century−1) across the US and US national parks (green polygons). (b) Mean annual temperature (°C) of the national park area, annual values (thin line), five-year running average (thick line), and trend from linear regression (straight line, P < 0.0001) corrected for temporal autocorrelation. (c) Annual precipitation changes (% century−1), relative to the 1895–2010 average. (d) Average annual precipitation (mm yr−1) of the national park area (trend P = 0.21).
Download figure:
Standard image High-resolution imageThe mean annual temperature difference between the periods 1901–1960 and 1986–2016 (table S3), the measure of change used in the US National Climate Assessment (USGCRP 2017), was the same as the 1895–2010 temperature difference derived here from the linear regression trend for the national park area and nearly the same for the US. The 1901–2016 result here for the contiguous states was lower than the result in the US National Climate Assessment but the 1901–2009 results for Alaska were the same.
Because the configuration of the US weather station network stabilized only in the 1950s (Vose et al 2014) and because time series for small areas such as parks can change when local stations change, we also analyzed historical trends in individual parks for the period 1950–2010 (table S5). For that period, nine of the ten national parks with the highest temperature increase were in Alaska, with the highest rate of 4.3 °C ± 1.1 °C century−1 in Denali National Preserve. A cold phase of the Pacific Decadal Oscillation lowered temperatures in Alaska from the late 1940s to the mid-1970s (Bieniek et al 2014), resulting in higher calculated rates of temperature increase for the period starting in 1950 than the period starting in 1901.
Between 1895 and 2010, precipitation declined significantly for 12% of national park area, compared to 3% of the US (table S6). Annual precipitation increased significantly in the US as a whole while annual precipitation of the national park area decreased, although the change was not statistically significant (table 1, figure 1). For the contiguous 48 states, rates of precipitation increase from 1895 to 2016 (7% ± 2% century−1 [US, P = 0.0007], 4% ± 2% century−1 [national park area, P = 0.08]) were nearly the same as rates from 1895 to 2010. For the US, precipitation differences between the periods 1901–1960 and 1986–2016 here (table S6) and in the US National Climate Assessment (USGCRP 2017) were equal to the difference calculated here from linear regression. Precipitation decreased considerably in the southwestern US, Alaska, and Hawaii (figure 2). Patterns were similar to US National Climate Assessment results, except for eastern Alaska, although the decrease there was also found in previous analyses (Harris et al 2014, McAfee et al 2014). For the period 1950–2010, seven of the ten national parks with the most severe precipitation decreases were in Hawaii (table S5), consistent with previous analyses (Frazier and Giambelluca 2017, USGCRP 2017). The largest decline, −85% ± 27% century−1, occurred at Honouliuli National Monument.
Projected climate changes
With continued greenhouse gas emissions, projected rates of 21st century temperature increase under the highest emissions scenario (RCP8.5) would be six times greater than 20th century rates for the national park area and the US (table 1, S7; figure 3). Compared to RCP8.5, reduced emissions would lower the rate of temperature increase by one-half (RCP4.5) to two-thirds (RCP2.6). Under RCP8.5, 100% of national park area would experience a mean annual temperature increase >2 °C from 2000 to 2100. Under the other emissions scenarios, this would decrease to 99% (RCP6.0), 97% (RCP4.5), and 58% (RCP2.6). For the entire US, the fractions are: 100% (RCP8.5), ∼100% (RCP6.0), 99% (RCP4.5), and 22% (RCP2.6). Climate velocities from 2000 to 2100 could increase in the national park area to three to nine times historical velocities (tables S3, S7, figure S2). Under RCP8.5, the fraction of the area with rapid climate velocity (>200 km century−1) could increase three to seven times, to 7% of national park area (table S7). The highest projected temperature increases in the national parks are in Alaska, with rates up to 9 °C century−1 (table S5, figure 3).
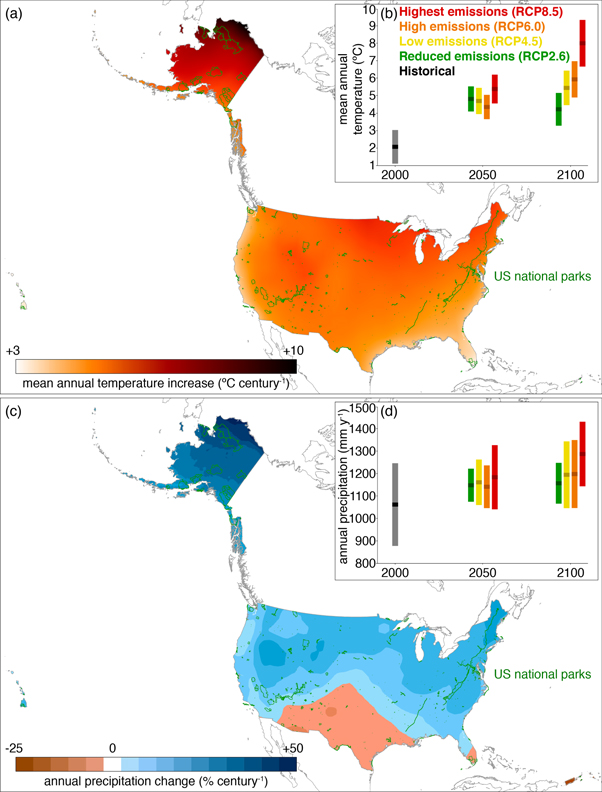
Figure 3. Projected climate change, 1971–2000 to 2071–2100. (a) Projected increase in mean annual temperature (°C century−1) for the highest emissions scenario (RCP8.5). (b) Mean annual temperature (°C) of the national park area for the historical period and two projected periods, dark band = mean, bars = standard deviations of annual values (historical) or GCM ensembles (projections). (c) Projected change in annual precipitation (% century-1), relative to the 1971–2000 average, for RCP8.5. (d) Annual precipitation (mm yr−1) with elements as in (b).
Download figure:
Standard image High-resolution imageWith continued greenhouse gas emissions, GCMs project increased precipitation for the national park area and the US (table 1, S8; figure 3). The ranges (mean ± standard deviation) of almost all the projections of annual precipitation overlap the range of annual precipitation in the historical period, suggesting no significant projections of change at a large scale, with the exception of the national park area under RCP8.5. The large standard deviations indicate low agreement of GCMs on the direction of precipitation change (figure S3). Across the mid-latitudes, GCM ensembles are divided, with some GCMs projecting annual precipitation increases and others decreases, such as in Yosemite National Park (figure S4). The largest projected precipitation decreases in the national parks are in the Virgin Islands, with rates of −28% century−1 (table S5).
Discussion
The magnitude of the historical temperature increase and fraction of the area with significant increases were greater for the national park area than the US as a whole. This disproportionate temperature increase occurs because a large fraction of national park area is in the Arctic or at high elevations, where warming occurs more quickly due to a thinner atmosphere, melting of reflective snow cover, which uncovers darker heat-absorbing surfaces, and other factors (ACIA 2005, Vaughan et al 2013). Sixty-three percent (63%) of national park area is in Alaska, compared to 16% of the US, and 19% of national park area is north of the Arctic Circle, compared to 3% of the US. Much of the national park area is in mountain ranges, including the highest points in North America (Denali, Denali National Park) and the contiguous states (Mt. Whitney, Sequoia National Park). The average elevation of the national park area is ∼980 m above sea level, compared to ∼730 m for the US, and 5% of the national park area is above 2500 m elevation, compared to 2% of the US, from spatial analysis at 1 km spatial resolution of US Geological Survey GTOPO30 data (https://lta.cr.usgs.gov/GTOPO30). In addition, the globally anomalous area of no significant temperature change in the southeastern US (Portmann et al 2009, Mascioli et al 2017) lowered the trend for the US as a whole but affected the park trend less because of the low fraction of the national park area in that region.
Only under a scenario of substantial emissions reductions (RCP2.6) would much of the national park area be located in areas of <2 °C increase by 2100, the upper limit of the Paris Agreement goal (UNFCCC 2016). Under RCP2.6, the fraction of the national park area located in areas of >2 °C increase would be double the fraction for the US as a whole, indicating a disproportionate exposure of national park area. A majority of the national park area and most individual national parks would be located in areas of >2 °C increase under all four emissions scenarios (figure 4).

Figure 4. Projected future scenarios, 1971–2000 to 2071–2100, US national park area. Projected changes in mean annual temperature (°C century-1) and annual precipitation (% century-1) for the four IPCC (2013) emissions scenarios, relative to the historical (1971–2000) average, for the US national park area as a whole (large dot = mean, bars = standard deviations of GCM ensembles, all area-weighted) and each of the 417 national parks (small dots, surface areas from 80 m2 (Thaddeus Kosciuszko National Memorial) to 34 000 km2 (Wrangell-St. Elias National Park)).
Download figure:
Standard image High-resolution image
These projections of temperature increases under all scenarios indicate a need for adaptation of resource management in national parks (Baron et al 2009). One adaptation measure under implementation is conservation of potential climate refugia in desert ecosystems in Joshua Tree National Park, identified through a spatial analysis of vulnerability (Barrows and Murphy-Mariscal 2012). Other adaptation measures under consideration for parks include conservation of climate refugia in mountain ecosystems (Johnston et al 2012, Morelli et al 2016), conservation of thermal refugia for cold water fish (Briggs et al 2018), protection of corridors for species migrations (Baron et al 2009), and prescribed burning in conifer forests to remove excessive understory vegetation and increase survival of older trees in drought (van Mantgem et al 2016).
The lower climate velocities in the national park area seem to show lower exposure relative to the US. This is a result of calculation of climate velocity as horizontal displacement (Loarie et al 2009) and the extensive area of national parks in mountainous terrain, where topographic relief creates high thermal gradients over short horizontal distances. Climate velocity can underestimate exposure in mountainous terrain, where upslope distances for species to track suitable climate are greater than horizontal distances (Dobrowski and Parks 2016). Moreover, climate velocity does not account for potential disappearance of suitable climate from mountain tops or other isolated high elevation points (Hamann et al 2015). Therefore, calculated climate velocities may underestimate exposure in mountainous areas of the national parks.
The fraction of national park area experiencing significant historical precipitation decreases was much greater than the fraction of the US as a whole, indicating a disproportionate exposure of the national park area to increased aridity. While annual precipitation increased in the US as a whole, it did not increase for the national park area because of the extensive area of national parks in the arid southwestern US, which has experienced the sharpest declines in precipitation in the contiguous 48 states (figure 2) and severe droughts that have been intensified by anthropogenic climate change, in California (Williams et al 2015, Berg and Hall 2017) and the upper Colorado River basin (Crouch et al 2017, Udall and Overpeck 2017). In these areas of high inter-annual variability of precipitation, higher temperatures have coincided with low precipitation years.
Projected temperature increases overlap with projected precipitation decreases across much of the southwestern US (figure 3), indicating increased probabilities of drought (Cook et al 2015) and aridification (Jones and Gutzler 2016). Even in areas of increased precipitation, projected higher temperatures would reduce the fraction falling as snow (Lute et al 2015) and potentially increase aridity through increased evapotranspiration (Hostetler and Alder 2016). The fraction of national park and US area with projected declines in precipitation increases with greenhouse gas emissions (table S8). The low agreement of GCMs on the direction of projected precipitation changes in the mid-latitudes (figures S3, S4) suggests a scenario planning approach when applying the projections to conservation planning (Peterson et al 2003).
PRISM data for the contiguous 48 states are derived from measurements at over 10 000 weather stations (Daly et al 2008), but a limitation of our methods is that PRISM does not completely control for weather station changes (Oyler et al 2015, Walton and Hall 2018) and it may be less accurate in mountainous terrain (Strachan and Daly 2017), overestimating warming at higher elevations in the western US (Oyler et al 2015). The TopoWx dataset (Oyler et al 2015), which covers the contiguous 48 states starting in 1948, has corrected for station changes over time, but it was not available at the time of this research. PRISM has demonstrated accuracy in comparisons with weather station measurements (Bishop and Beier 2013, Behnke et al 2016, Walton and Hall 2018). Comparison of maximum temperatures from PRISM and 3855 Global Historical Climatology Network weather stations across the US found a high correlation (r > 0.95) (Behnke et al 2016). Comparison of temperature trends from PRISM and 51 weather stations in the northeastern US found an average error for maximum temperature of 0.1 °C century−1 (Bishop and Beier 2013), within the standard error of historical temperature trends in our results. PRISM has also shown accuracy compared with ground-truth measurements in a watershed where PRISM came within 5% of rain gauge totals (Daly et al 2017).
In addition, analyses that used PRISM in parallel with other gridded climate datasets for California (Williams et al 2015) and the northwestern US (Abatzoglou et al 2014) found that the PRISM time series closely tracked the key gridded climate datasets for the world (University of East Anglia Climate Research Unit (CRU) 50 km spatial resolution dataset (Harris et al 2014), used in IPCC 2013) and the US (National Oceanic and Atmospheric Administration 5 km spatial resolution dataset (Vose et al 2014) used in the US National Climate Assessment (USGCRP 2017)). Inter-comparisons of up to eight gridded climate datasets for the contiguous states found that PRISM was in the middle of the range of the datasets (Guentchev et al 2010, Behnke et al 2016, Walton and Hall 2018). Furthermore, numerous research efforts have used PRISM time series data to analyze multi-decadal trends, including trends in climate (Abatzoglou et al 2014, Williams et al 2015), hydrology (Small et al 2006, Pederson et al 2013, Velpuri and Senay 2013, Hostetler and Alder 2016), and ecology (Diaz and Eischeid 2007, van Mantgem et al 2009, Williams et al 2010, Bartomeus et al 2011, Crimmins et al 2011, Breed et al 2013, Dennison et al 2014, Hansen et al 2014).
It is only for the contiguous states that we use the PRISM climate time series. For Alaska, Hawaii, Guam, and American Samoa, we used historical datasets (table S1) based on the CRU climate time series (Harris et al 2014), which was designed for long-term trend analysis, while a PRISM-derived climate average was used only to downscale those time series by bilinear interpolation.
Another possible limitation is that the BCSD method (Wood et al 2004) may not completely capture changes in the shape of climate probability distributions between the historical and projected periods. The method may underestimate extreme variable changes if tails of the variable distributions expand beyond historical bounds. Extreme tail values might not be represented in the existing observational record.
This research has not sought to analyze climate extremes. We focused on mean temperature and total precipitation, to which extreme event frequencies, global patterns of biomes, and many species ranges are highly related.
Numerous physical and ecological changes detected in national parks and attributed in previous research mainly to anthropogenic climate change have occurred in areas of significant temperature increases reported here. In Glacier Bay National Park, Muir Glacier has melted and thinned 640 m in its lower reaches from 1948 to 2000 (Larsen et al 2007, IPCC 2013) in an area where temperature increased 2.8 °C century−1 (1950–2009, this research). In Yosemite National Park, subalpine forest shifted upslope into subalpine meadow from 1880 to 2002 (Millar et al 2004) and the ranges of small mammals moved upslope from 1914 to 2006 (Moritz et al 2008) in areas where temperature increased as much as 0.9 °C century−1 (1895–2016, this research; figure S1). In Noatak National Preserve, boreal conifer forest shifted northward 80–100 m onto tundra from the late 1700s to the late 1900s (Suarez et al 1999) in an area where temperature increased 1.2 °C century−1 (1901–2009, this research). In Yellowstone National Park and the surrounding ecosystem, bark beetle outbreaks due to climate change have caused mortality of half of the area of whitebark pine (Pinus albicaulis) (Macfarlane et al 2013, Raffa et al 2013) in areas where temperature increased as much as 1.9 °C century−1 (1950–2010, this research).
Numerous future vulnerabilities in national parks are also located in areas of projected high exposure found here. In Yellowstone National Park (5.3 °C century−1, RCP8.5, this research), climate change could increase area burned by wildfire three to ten times from 1990 to 2100 (Westerling et al 2011), far above natural levels. In Joshua Tree National Park (4.6 °C century−1, RCP8.5, this research), climate change could cause extensive mortality of Joshua trees (Yucca brevifolia) by 2100 (Cole et al 2011) and loss of up to 90% of areas with suitable climate (Barrows and Murphy-Mariscal 2012). In Lassen Volcanic National Park (4.6 °C century−1, RCP8.5, this research), American pika (Ochotona princeps), a small alpine mammal, is vulnerable to extirpation (Stewart et al 2015).
Projected climate velocities could exceed maximum natural dispersal capabilities of many trees (∼180 km century−1), small mammals (∼230 km century−1), and herbaceous plants (∼240 km century−1) (Settele et al 2014), challenging the abilities of species such as Joshua tree and American pika to remain in suitable climate in national parks (Cole et al 2011, Stewart et al 2015). The possibility of future climate states in North America with no current analog, particularly in the Arctic and the southeastern and southwestern US (Mahony et al 2017), exacerbates the vulnerability of restricted-range endemic species to extinction.
Conclusion
Through spatial analyses of historical and projected temperature and precipitation, we have revealed a previously unreported disproportionate magnitude of climate change in the US national parks, including hotter and drier historical trends and a greater fraction of the area with projected temperature increases >2 °C, the upper limit of the Paris Agreement goal. National parks in Alaska are most exposed to temperature increases while Hawaii, the Virgin Islands, and the southwestern US are most exposed to precipitation decreases.
US national parks protect some of the most irreplaceable ecosystems and cultural sites in the world. The climate spatial data presented here can enable national parks and other US protected areas to analyze vulnerabilities of numerous endangered species and resources whose vulnerability is currently unknown. Projected changes suggest considerable future vulnerabilities and the need for adaptation under all scenarios. Nevertheless, greenhouse gas emissions reductions could substantially reduce the magnitude of anthropogenic climate change, offering hope for the future of the US national parks and the resources they protect for future generations.
Acknowledgments
We thank M Allison Stegner, University of Wisconsin, Madison, for a detailed review of the draft and colleagues in the University of California, Berkeley, Institute for Parks, People, and Biodiversity for helpful discussions. For the Coupled Model Intercomparison Project Phase 5 (CMIP5) data, we acknowledge the climate modeling groups (table S2), the World Climate Research Programme Working Group on Coupled Modelling, and the US Department of Energy Program for Climate Model Diagnosis and Intercomparison. We also acknowledge postdoctoral research funding to Fuyao Wang from the US National Park Service. This publication represents the views of the authors and does not necessarily represent the views of the US Government.