

Abstract
Sydney is Australia's largest city and is growing rapidly. Although Sydney's air quality is relatively good compared to the major cities in many industrialised countries, particulate matter (PM) and ozone (O3) occasionally exceed the national health standards and are the cause of premature mortalities and hospital admissions. Numerous studies from overseas (e.g. North America and continental Europe) suggest that climate change may impact air quality to the detriment of human health. There is limited knowledge about how climate change may impact air quality in Sydney. This study reviews the available literature on the impacts of climate change on air quality related health impacts in Sydney to identify knowledge and research gaps. Where no studies are available for Sydney, it draws on relevant studies from other Australian cities and overseas. Our findings summarise what is known about how climate change may impact air quality in Sydney and where research gaps exist. This approach can facilitate research agendas, policies and planning strategies that mitigate public health impacts and tackle climate change and air pollution in a coordinated way.
Export citation and abstract BibTeX RIS

Original content from this work may be used under the terms of the Creative Commons Attribution 3.0 licence.
Any further distribution of this work must maintain attribution to the author(s) and the title of the work, journal citation and DOI.
1. Introduction
Warming of the climate system is unequivocal and the primary cause of this warming is greenhouse gas emissions from burning fossil fuels—coal, oil and gas (IPCC 2014, p 40). Burning fossil fuels not only affects the climate, but also has a significant impact on human health. In Australia, air pollution—primarily from burning fossil fuels—already causes about 3000 premature deaths per year (Begg et al 2007). Climate change will directly affect air pollution by modifying the meteorological variables of temperature, precipitation, wind speed and wind direction. These variables influence the development, chemical transformation, transport, dispersion and deposition of air pollutants (Ebi and McGregor 2008, Kinney 2008a). Ozone (O3) and particulate matter (PM) will be particularly influenced by climate change, especially particulate matter with a diameter of 2.5 microns or less (PM2.5) (Jacob and Winner 2009, Kinney 2008b). Climate change may also indirectly increase natural sources of PM by increasing fire weather, dust storms and affecting the production and dispersion of aeroallergens such as pollens and moulds. Simultaneous exposure to air pollution and high temperature may also have synergistic detrimental impacts on health. As many sources of air pollution are also important sources of greenhouse gas emissions, mitigating climate change by reducing greenhouse gas emissions can have important health co-benefits (Bell et al 2008, Chang et al 2017, West et al 2013). In Australia, however, there is very limited knowledge about how climate change may impact air quality and associated health impacts.
Many context-specific factors influence how climate change may influence air quality, and how human health may be affected as a consequence. Because of this, we decided to focus on a specific geographical region in this review. Sydney was chosen as the location for the review for a number of reasons. Firstly, Sydney, Australia's largest city with over five million people, is also rapidly growing (ABS 2017). Secondly, Sydney's geography—a basin bounded to the east by the Pacific Ocean and to the south, west and north by elevated terrain, occasionally delays air pollutants from dispersing. This, along with other factors, can cause ground level O3 and PM to exceed the national standards on occasion. The current concentration of PM2.5 in Sydney is responsible for 2.1% of deaths per year and 1.8% of total years of life lost (Broome et al 2015). Ozone is responsible for an additional 0.8% of total deaths per year in Sydney (Broome et al 2015). Air quality related health impacts are likely to increase in the future as a result of climate change, population growth and ageing and urbanisation.
A review is warranted to systemically assess what is known about how climate change will impact air pollution in Sydney, Australia and where research gaps exist. This approach can facilitate research agendas, policies and actions to mitigate future health impacts. This review focuses on how climate change will impact outdoor air quality and associated health impacts.
1.1. Background: impacts of climate change on air quality
1.1.1. Impacts of climate change on ozone
Ground level O3 is produced through a photochemical reaction between sunlight and precursor pollutants such as oxides of nitrogen (NOx), methane (CH4), volatile organic compounds (VOCs) and carbon monoxide (CO) (US EPA 2017). Ozone forms on still, cloudless days, and the rate of formation is dependent on temperature as well as precursor emissions. Heatwaves are highly conducive to O3 formation (Dear et al 2005). Therefore, understanding what is likely to happen to temperature, cloud cover and precursor emissions is important for making projections about the future health risks of changes in O3. Studies reviewed by Jacob and Winner (2009) find that modelled climate change will cause summertime O3 levels to increase by between 1 ppb and 10 ppb over the 21st Century across North America, Europe and Asia, with effects being strongest in more highly polluted regions. Even at low levels, exposure to O3 increases the risk of mortality, with each 10 ppb increase being associated with an increase in mortality of 0.3% (95% CI: 0.15%–0.45%) (Bell et al 2006). The extent of the projected increase in O3 depends on various factors such as the model used, the region, the climate and emission scenario and the time period (Jacob and Winner 2009). In some areas where cloudiness is projected to increase and where emissions of precursor pollutants are low O3 may decrease in the future, as clouds reduce ultraviolet radiation thereby reducing O3 formation (e.g. Scandinavia in Langner et al 2005 and the Midwest United States in Tagaris et al 2007).
1.1.2. Impacts of climate change on particulate matter
In many locations around the world the relationship between climate change and PM is more complex than the relationship between climate change and O3, as the various components of PM are influenced by changes in meteorological variables in different ways. The main components of PM are sulphate aerosols, nitrate aerosols, carbonaceous aerosols (organic carbon and elemental/black carbon), sea salt and soil dust. Some of these are released directly from a source and others are formed through chemical reactions in the air. The former are called primary particulates or aerosols and the latter are called secondary aerosols or particulates. Studies suggest that the main meteorological variables likely to impact PM are precipitation frequency and mixing depth. Particulate matter may decrease in regions projected to experience more frequent precipitation, as precipitation is the main PM scavenger, with frequency of precipitation being more important than rate (Jacob and Winner 2009). Mixing depth is the section of the atmosphere where convection and turbulence cause air pollutants to mix and disperse. In regions where mixing depth is projected to increase, air pollution is likely to decrease. Projections for both precipitation and mixing depth vary by region and are often unreliable (Jacob and Winner 2009). Some components of PM are affected by temperature. Studies have found a positive association between temperature and sulphate aerosols (see Liao et al 2006, Pye et al 2009, Racherla and Adams 2006, Unger et al 2006) and increasing VOCs (Heald et al 2008). On the other hand, a negative association has been found between temperature and nitrate aerosols, with higher temperatures causing nitrate aerosols to transition from the particle to the gas phase (Pye et al 2009). This means that increasing temperatures may cause PM to decrease in regions where NOx emissions are high (Pye et al 2009). Secondary organic aerosols can be strongly influenced by cloud processes. For example, the liquid water content of clouds has been found to have a strong linear correlation with the spatial distribution of organic aerosols, particularly over forest regions (He et al 2013). This is another pathway through which climate change may potentially affect PM.
1.1.3. Indirect impacts of climate change on particulate matter—wildfires and dust storms
Climate change will also indirectly influence PM levels by increasing the frequency and severity of wildfires and dust storms in regions that are projected to be hotter and drier (Kinney 2008a, Takaro et al 2013). Studies for the western United States show that climate change will cause PM concentrations to increase significantly as a result of wildfires. For example, Spracklen et al (2009) project that summertime surface carbonaceous particles will increase by 5 µg m−3 in the western United States in 2050 compared to 2000, where 70% of this increase is due to an increase in climate-driven wildfires (Spracklen et al 2009). Similarly, Liu et al (2016) use a fire prediction model coupled with a global chemical transport model to project wildfire specific PM2.5 levels under a changing climate in 561 western counties for the present-day (2004−2009) and the future (2046−2051). They find that in the current climate (2004−2009) PM2.5 from wildfires contributes an average of 71.3% to total PM2.5 on days when PM2.5 exceeds the national guidelines. They also find that climate change will cause wildfire-specific PM2.5 levels to increase by an average of 160% and a maximum of 400% by 2046−2051, exposing 82 million people to a 57% increase in the frequency of smoke waves (defined as two or more days with high PM2.5 due to wildfires) and a 31% increase in the intensity of smoke waves (Liu et al 2016). A study by Pu and Ginoux (2017) modelled how climate change will affect dust storms in the southwestern and central United States towards the end of the 21st Century under an RCP8.5 scenario. They found that reduced precipitation, increased soil bareness and increased surface wind speed would lead to an increase in dust activity from spring to autumn across the southern Great Plains (western Texas and eastern New Mexico). On the other hand, the northern Great Plains is projected to experience a decrease in dusty days during spring due to increased precipitation and decreased soil bareness (Pu and Ginoux 2017).
1.1.4. Impacts of climate change on aeroallergens
Climate change may also impact air quality by modifying aeroallergens such as pollens and moulds. Higher temperatures and higher CO2 levels may increase pollen production in a range of allergenic plants. For instance, Albertine et al (2014) suggest that increased CO2 may cause airborne grass pollen concentrations to increase by approximately 200% in the future as a result of climate change (see also Hamaoui-Laguel et al 2015, Rogers et al 2006, Wayne et al 2002, Ziska and Beggs 2012). Climate change may also cause earlier springs and warmer summers, resulting in an extension of the pollen season. For example, in North America, rising temperatures between 1995 and 2009 have resulted in an extension of the ragweed pollen season by 27 days (Ziska et al 2011). Other potential influences of climate change on pollen production include changes in the type of species present and the growth range of species (Bradley et al 2010). Increased CO2 and drought stress may also affect the antigen production of some allergenic pollen and fungi (see for example Kelish et al 2014, Singer et al 2005, and Wolf et al 2010). Ground level O3 generally has a repressive influence on both growth and antigen production (Albertine et al 2014), but has been shown to worsen the allergenicity of some pollens such as birch pollen in Munich, Germany (Beck et al 2013). Increased risk of extreme weather events such as thunderstorms may result in more asthma epidemics in the future (Beggs and Bennett 2011). Upon contact with moisture, rye grass pollen grains can rupture releasing starchy granules that easily lodge in the respiratory tract. The cold downdraught of air associated with thunderstorms can collect pollen and concentrate it in a low and narrow band of air at ground level, causing many people to be exposed to high concentrations of pollen (Marks et al 2001). Marks et al (2001) examined the correlation between thunderstorms and asthma epidemics in six towns in south eastern Australia and found that thunderstorms were associated with 33% of days where asthma epidemics occurred, and on just 3% of control days.
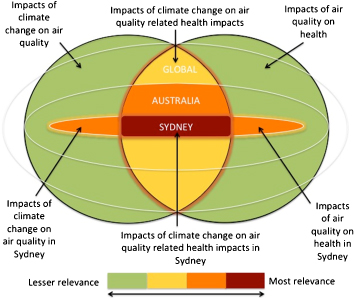
Figure 1. Diagram illustrating inclusion criteria for literature and level of relevance.
Download figure:
Standard image High-resolution image
1.2. Climate change projections for Sydney
As meteorological variables influence air quality it is useful to understand how meteorological variables will be impacted by climate change in Sydney in the future. This summary of climate change projections considers the highest scenario for greenhouse gas concentrations described by the IPCC (RCP8.5) and only the meteorological variables that are most likely to impact air quality. Unless otherwise stipulated, all projections are expressed relative to a baseline of the average between 1986−2005. Average annual temperatures are projected to increase by 2.9 °C to 4.6 °C by 2090, with increases occurring across all seasons. Temperature extremes are also projected to increase, with the number of days over 35 °C projected to increase from 3.1 days (average between 1981 and 2001) to between 8.2 and 15 per year by 2090. Annual average rainfall is more likely than not to decline by about 3%; however, the range for these projections is very broad, spanning from a decline of 20% to an increase of 16% by 2090. Precipitation is expected to decline in spring, autumn and winter but to increase in summer. In most locations (including Sydney) intense rainfall is projected to increase. Average annual wind speed is more likely to decline than to increase, with a projected annual change ranging from a 6.9% decline to a 4.2% increase by 2090. Annual average absolute relative humidity is more likely than not to decline by about 1.5% (−3.8 to +1.3%) by 2090. Whilst these temperature projections are of high confidence in relation to precipitation, wind speed and humidity are much less certain, which is reflected in the broad range of possible modelled outcomes (Webb and Hennessy 2015).
2. Method
Literature was collected from the PubMed database using the search terms: ((air pollution OR air quality) AND (climate change OR global warming OR precipitation OR temperature OR meteor⁎ OR climat⁎) AND (health or co-benefit) AND (Australia OR Sydney)). Search terms were entered for all fields and all peer-reviewed articles published between 2007 and 2017 and available as full text. The search revealed 152 articles, which were sorted into tiers based on their relevance.
Literature was sorted using the following inclusion and exclusion criteria. Original quantitative studies examining the crossover of all three topics of climate change, outdoor air pollution or air quality and health impacts in Sydney were considered most relevant for inclusion (the red area in figure 1). Studies examining the crossover of two of the three topics (i.e. outdoor air quality and health impacts or climate change and outdoor air quality) in Sydney or studies examining the crossover of the three areas of climate change, outdoor air quality and health impacts for other Australian cities or Australia as a whole were considered highly relevant for inclusion (the orange area in figure 1). Where studies for these areas were limited or non-existent, we resorted to literature exploring the crossover of the three areas of climate change, outdoor air quality and health impacts from overseas (primarily from North America and continental Europe) (the yellow area in figure 1). Specifically, abstracts were examined and if the abstract referred to climate change and outdoor air quality or air pollution and health impacts in Sydney or anywhere in Australia, the article was included for review. If Australia was not referred to in the abstract, but was discussed in the full text, the article was also included. Articles examining the crossover of all three areas of climate change, outdoor air quality and health impacts from overseas or global studies were also included for background and discussion purposes. Finally, any articles examining the relationship between meteorological variables and air pollution in Sydney, or the interactive effects of temperature and air pollution in Australia were included. In this way, the search terms captured articles that may not explicitly mention climate change, but did capture useful information on exposure-response relationships. Studies that examined health impacts on non-human animals were excluded, as were studies on indoor air quality.4 Although original articles were prioritised, review articles were also included for background information and discussion. Journal articles referred to us by experts in the field were included. The bibliographies of all studies were crosschecked for other relevant studies, which were also included in the review. A substantial proportion of studies reviewed here were collected via the latter method. So-called 'grey literature' was not included in this review to narrow included articles to original studies where available and to ensure the rigour of the articles reviewed.
3. Findings
The findings section is divided into five main sub-sections: relationship between meteorological variables and air quality in Sydney; health impacts of air quality in Sydney; synergistic impacts of temperature and air pollution on health; projected impacts of climate change on air quality related health impacts in Sydney and Australia; and, health and economic co-benefits of greenhouse gas mitigation. A discussion section that synthesises the implications of findings, their relationship to overseas studies, and the key research gaps for Sydney follows.
3.1. Relationship between meteorological variables and air quality in Sydney
There are three main approaches to estimating the effects of climate change on air quality (Jacob and Winner 2009). The first is to use observed correlations between air quality and meteorological variables in the current climate and look at how these meteorological variables may change in the future. The second is perturbation of meteorological variables using chemical transport models (CTMs), and the third is CTM simulations of 21st Century climate change driven by general or regional circulation models (CTM-GCM or CTM-RCM models). To our knowledge, there is only one study (Physick et al 2014) that uses CTM-GCM models combined with an exposure-response function for Sydney (discussed later in this review). Observed correlation studies are the most common for Sydney out of the three types mentioned above.
A number of studies have identified synoptic and mesoscale (local meterological) processes that are correlated with good or bad air quality in Sydney. For instance, Hart et al (2007) developed a synoptic climatology of pollen concentrations in Sydney from statistical analysis of surface and upper air meteorological data for the six warmest months (October–March) over a ten year period. They identified eleven synoptic categories that occur over the six warmest months, and found that two of these categories (7 and 9) are associated with the highest average total pollen counts and the highest counts of tree pollen from the olive family (Oleaceae). Synoptic category 7 is also associated with high counts of pollen from grasses (Poaceae). A third synoptic category (5) is associated with the highest loads of tree pollen from the Cypress family (Cupressaceae). Although associated with the highest pollen counts, synoptic category 9 occurs infrequently on just 1% of days over the six warmest months. Categories 5 and 7 are more common, especially during the months from October to December. During these months, weather conditions that are conducive to high pollen concentrations coincide with the pollination period of several grass and tree species. The common feature associated with the three high pollen synoptic categories is a low-pressure system to the south of the continent generating strong, hot and dry westerly gradient winds which would have passed pollen producing crops, pastures, native forests and woodlands to the west of Sydney. Other common features between the three high pollen synoptic categories are dry air masses and a very small thermal gradient across the Sydney basin. Temperature appears to be a less important variable, with temperatures ranging from cool (22.2 °C) to very hot (32.4 °C) across the three high pollen synoptic categories. This is despite the fact that pollination of various species is driven by temperature as well as moisture and day length. As the present study focused only on the warmest months of the year, the effect of temperature on pollen may have been disguised. Studies from overseas have found a positive correlation between temperature and pollen concentrations (particles/m3). The dry air mass associated with high pollen concentrations in Hart et al (2007) is consistent with a previous study for Sydney by Stennet and Beggs (2004), which found a negative correlation between pollen concentrations and rainfall and relative humidity and a negative correlation between pollen concentrations and mean sea level pressure (Stennett and Beggs 2004).
Hart et al (2009) conducted a similar study to investigate the meteorological conditions most conducive to O3 formation in Sydney. Surface and upper air meteorological data for the warm months (October to March) between the years 1992–2001 were statistically analysed to identify meteorologically homogenous synoptic categories. Eleven synoptic categories were identified, which were then related to O3 concentrations. One synoptic category was associated with high O3 concentrations, with 48% of days within this category exceeding the NSW 1 hour O3 goal of 80 ppb and 32% of days experiencing O3 concentrations of 60−80 ppb. This synoptic category is characterised by a high-pressure system located in the Tasman Sea generating light northwesterly gradient winds with high temperatures and afternoon sea breezes and shallow mixing depth with warming aloft. The study further examined two days within this synoptic category with very different O3 concentrations, concluding that mesoscale processes influencing wind direction are critical to understanding and predicting O3 formation in Sydney.
Leighton and Spark (1997) found that the most important situations leading to moderate and high pollution levels in Sydney are: a weak to moderate north westerly airstream over eastern and coastal New South Wales; an anticyclone centred close to Sydney but not resulting in a northwest gradient wind (anticyclones associated with high immobility can result in significant pollution events); a ridge or col region located across New South Wales. The ridge may extend to New South Wales from an anticyclone in the Tasman Sea or the Bight or may be an extended ridge lying across New South Wales linking anticyclone centres across the Bight or South Australia and the Tasman Sea. Resulting calm weather in Sydney could lead to a significant pollution event; a weak surface pressure gradient covering coastal New South Wales; or, in summer an easterly trough lying over south eastern Australia. The gradient wind in these situations tends to be light and surface conditions tend to be calm.
Jiang et al (2017) found that because Sydney is a subtropical basin environment, small changes in synoptic systems modulate local meteorological processes such as sea breezes and drainage flows, thereby impacting the spatial variability of air pollution in Sydney. High pollution levels are associated with two synoptic types which are characterised by a high-pressure cell over the Tasman Sea with a ridge extending northwest across New South Wales or southern Queensland. These synoptic types correspond at the local scale with high temperature and solar radiation, high inland-to-coast temperature gradients, and prevailing north easterly sea breezes. These conditions are associated with elevated pollution levels, a higher chance for exceedance days of O3 and PM10 and lower visibility. Synoptic types associated with low O3 and PM10 are characterised by a high-pressure belt extending from the Tasman Sea to the Great Australian Bight. These conditions are locally related to low solar radiation, high mean rainfall, low temperature gradients between the coast and inland areas and prevailing south westerly or south easterly winds. Furthermore, Jiang et al (2017) showed that bushfire emissions have a significant impact on the synoptic modulation to local visibility and PM10 levels, but do not appear to significantly impact the likelihood of O3 exceedance days or mean O3 levels (this contrasts with studies from overseas that show bushfire emissions can significantly elevate O3 levels). Overall, the results show that Sydney's subtropical coastal basin environment is not only influenced by synoptic processes (e.g. high pressure systems associated with high pollution levels). Rather, Sydney's air quality is influenced by the interaction of synoptic scale and mesoscale processes. Significant increases in pollution can occur at different areas in the Sydney basin depending on the interaction between mesoscale and synoptic scale circulation patterns.
3.2. Health impacts of air pollution in Sydney
3.2.1. Health impacts of urban air pollution
Several studies have investigated the health impacts of urban air pollution in Sydney. Epidemiological time series studies by Morgan et al (1998a) and Morgan et al (1998b) have shown that ambient outdoor air pollution in Sydney is associated with increased mortality and hospital admissions for chronic obstructive pulmonary disease (COPD), childhood asthma and heart disease amongst those 65 years old and above. Consistent with studies conducted in other cities, children and the elderly have been found to be the most vulnerable groups to the impacts of air pollution in Sydney. Barnett et al (2006) found a significant positive association between exposure to NO2, CO and PM from common sources such as vehicle exhaust and hospital admissions for five categories of cardiovascular disease amongst those 65 years old and above in Sydney and other cities across Australia and New Zealand, even at levels well below national health guidelines. Jalaludin et al (2008) found a significant association between ambient air pollution in Sydney and emergency department visits for asthma in children, at levels well below national health guidelines. The effects of PM, NO2 and O3 on asthma were found to be highest in the warm months (Jalaludin et al 2008). A study conducted in Sydney also found evidence that exposure to air pollution during pregnancy can have a statistically significant adverse impact on birth weight (Mannes et al 2005). Using a multivariate linear regression model, they find that an increase in mean CO levels of 1 ppm is associated with a reduction in birth weight of between 7 grams (95% CI: 19–29) and 29 grams (95% CI: 7–51). Similarly, an increase in mean NO2 levels of 1 ppb is associated with a reduction in birth weight of between 1 gram (95% CI: 0–2) and 34 grams (95% CI: 24–43). Exposure to PM10 during the second trimester also has a small adverse statistically significant impact on birth weight. An increase in mean PM10 levels of 1 microgram per cubic meter is associated with a reduction in birth weight of 4 grams (95% CI: 3–6) (Mannes et al 2005).
Overall, the health burden of ambient urban air pollution in Sydney is significant. Broome et al (2015) estimate that 5800 years of life lost and 430 premature deaths were attributable to PM2.5 in 2007, representing approximately 2.1% of total deaths in Sydney that year and 1.8% of total years of life lost. Anthropogenic PM2.5 levels were also found to be responsible for 20 cardiovascular hospital admissions and 150 respiratory hospital admissions amongst those 65 and above. Ozone was found to be responsible for 160 premature deaths (0.8% in that year) and 760 respiratory hospital admissions. They further found that reducing PM2.5 below 2007 levels by just 10% would result in 700 fewer cardiorespiratory hospital admissions, about 650 fewer premature deaths and a gain of about 3,500 years of life over a ten year period (Broome et al 2015).
3.2.2. Health impacts of bushfire smoke
Aside from the common causes of outdoor air pollution, bushfires and dust storms are of particular concern as they are the main cause of extreme pollution events in Sydney (Johnston et al 2011). Bushfire smoke contains PM, respiratory irritants and carcinogens such as formaldehyde and benzene (Bernstein and Rice 2013). As smoke can travel for thousands of kilometres, large populations can be exposed to its impacts. Smoke events have been associated with a 5% increase in all-cause mortality in Sydney (with a lag of one day) (Johnston et al 2011). Smoke events have also been associated with a 6% increase in same-day hospital admissions for respiratory diseases and a 13% and 12% increase in same day hospital admissions specifically for COPD (13%) and asthma (12%) (Martin et al 2013). Bushfire smoke has also been associated with a large increase in emergency department admissions for all non-trauma related conditions, and for respiratory diseases, with respiratory conditions persisting days after a smoke event (Johnston et al 2014). Connections between smoke events and cardiovascular disease are less consistent. Martin et al (2013) recorded no statistically significant increase in cardiovascular admissions, but Johnston et al (2014) found an increase in ischaemic heart disease and heart failure in the 15−65 years age group two days after smoke events (Johnston et al 2014). In May 2016, smoke from hazard reduction burns across New South Wales designed to reduce bushfire risk caused air pollution levels in Sydney to increase to dangerous levels for a number of days. A rapid impact assessment of the health burden of these controlled burns estimated that they were responsible for as many as 14 premature deaths, 58 respiratory hospitalisations and 29 cardiovascular hospitalisations (Broome et al 2016). As this study was a rapid impact assessment over just a few days, caution should be taken when interpreting these results.
3.2.3. Health impacts of dust storms
The highest recorded PM levels in Sydney occurred from a dust storm that swept across the east coast of Australia in 2009. During the dust storm, daily average concentrations of PM10 and PM2.5 peaked at 11 000 μg m−3 and 1600 μg m−3 respectively. Merrifield et al (2013) found that this dust storm was responsible for a statistically significant increase in asthma emergency department visits (relative risk 1.23, 95% CI: 1.10−1.38, p < 0.01), respiratory emergency department visits (relative risk 1.20, 95% CI: 1.15−1.26, p < 0.01) and all emergency department visits (relative risk 1.04, 95% CI: 1.03–1.06, p < 0.01). Cardiovascular emergency department visits were not found to be statistically significant. Age-specific analysis showed that people five years and younger and 65 years or older were more affected than other age groups.
3.2.4. Health impacts of aeroallergens
Australia's prevalence of asthma is one of the highest in the world. Currently, wheeze affects more than 20% of children in Australian and allergic rhinitis (hay fever) affects more than 7.5% of children. Allergic asthma and hay fever are closely linked, and pollen (a significant aeroallergen) is recognised as a major trigger for both. Although studies have not been conducted for Sydney, daily pollen counts have been associated with increased risk of adult asthma hospitalisations in London with a lag of 2−5 days. The relative risk of asthma hospitalisation during days classified by the MET office as having 'very high' versus 'low' pollen was calculated to be 1.46 (95% CI: 1.20−1.78), occurring at a lag of three days (Osborne et al 2017). Atmospheric grass pollen concentrations for six major urban centres in Australia including Sydney have been examined by Beggs et al (2015), but the association between pollen counts and health impacts was not studied. They found considerable spatial and temporal variability in the grass pollen seasons across Australia. For Sydney, they analysed the grass pollen season and peak pollen period from 2007 to 2011. They found that for three of the five years studied the peak pollen period occurred in late October or the start of November. For the other two years, the peak pollen period occurred in mid December, indicating significant temporal variability of the peak pollen period in Sydney. In Sydney, a methodological study was conducted on the temporal relationship between daily pollen counts and hay fever symptoms amongst 23 patients with a history of pollen allergy (six of whom were asthmatics). The study developed a model for studying the relationship between pollen time series and short term and long term fluctuations in allergic nasal and eye symptoms (Byth et al 2006).
3.2.5. Health impacts of air pollution in other Australian cities
Although this literature review is focused on Sydney, similar associations between outdoor air pollution and hospital admissions have been found for other Australian cities such as Perth (Hinwood et al 2006), Brisbane (Petroeschevsky et al 2001, Chen et al 2007) and Adelaide (Chen et al 2016). A study conducted in Brisbane found mixed evidence that exposure to ambient air pollution amongst pregnant women increases the risk of birth defects in newborn babies (Hansen et al 2009). Exposure to a 5 ppb increase in O3 was found to be associated with an increased risk of pulmonary artery and valve defects, and SO2 exposure was associated with an increased risk of aortic artery and valve defects and cleft lip with or without cleft palate (Hansen et al 2009). Barnett et al (2012) conducted a study in Brisbane of the health impacts from the same 2009 dust storm studied by Merrifield et al (2013) and found that it was associated with a 39% increase in hospital emergency department admissions; however, no changes were found in the characteristics of emergency department admissions, i.e. respiratory admissions did not specifically increase, and the impacts subsided after just one day. In Melbourne, the 'thunderstorm asthma' event in November 2016 led to thousands of hospitalisations and at least nine deaths. Melbourne is particularly susceptible to these events given the combination of rye grasses surrounding Melbourne, frequent thunderstorms in November and a large population. Seven such events have occurred in Melbourne since 1984.
3.3. Synergistic impacts of temperature and air pollution on mortality in Sydney
Heatwaves and air pollution may also act synergistically to increase adverse health effects. Vaneckova et al (2008) analysed the relationship between temperature and mortality during the six warmest months of the year in Sydney between 1993 and 2004 and found that a 10 °C increase in daily maximum temperature causes mortality to increase by 4.5%−12.1%. In their study Vaneckova et al (2008) also investigated the interaction between temperature and air pollution (PM10 and O3) on mortality in Sydney. They found that air pollution independently accounted for deaths during the warmer months, but that no significant association existed in the interaction between temperature and air pollution on mortality. Nevertheless, they acknowledged that the relationship between O3 and temperature might be too complex to be adequately explained in their study, and that other air pollutants not considered in the study may have contributed to the mortality effect as well. Hu et al (2008) examined the effect of temperature and air pollution (SO2) on total mortality in summers in Sydney using daily weather, mortality and air pollution data for Sydney from 1994−2004. They found that the average increase in daily mortality was 0.9% (95% CI: 0.6–1.3) for each 1 °C increase in daily maximum temperature in Sydney. They further found an average increase in total daily mortality of 22% (95% CI: 6.4–40.5) for each 1 part per hundred million (pphm) increase in daily average concentrations of SO2. There was a 7.3% increase in daily average mortality when maximum temperature was over 32 °C and a 12.1% increase in daily average mortality when SO2 exceeded 0.315 pphm. Maximum temperature and SO2 seemingly had significant interactive effects on total mortality.
In Brisbane interactions between PM10 and temperature have been found. Ren and Tong (2006) examined the cardiorespiratory mortality and morbidity effect of interactions between PM10 and temperature in Brisbane and found that the adverse health effects of PM10 are stronger on warm days than cold days, and that the effects of temperature on health are also worse on days when PM10 is higher. This synergistic impact of ambient PM and temperature is additional to the independent combined health impacts of each variable. Synergistic effects between temperature and O3 have also been found in studies conducted overseas. For instance, Dear et al (2005) used a distributed lag model to estimate the fraction of deaths attributable to three variables (maximum temperature, minimum temperature and O3) and the interactions between these three variables during the 2003 heatwave across 12 cities in France. They found that a substantial and statistically significant mortality effect exists in the interaction between minimum temperature and maximum temperature, and between minimum temperature and peak O3. The acute effect of minimum temperature varied depending on peak O3 level, but interestingly, the relationship was non-linear. Mortality with a lag of 1 day increased by 2.5% for every 1 °C increase in minimum temperature when peak O3 was 80 g m−3, but declined to 1% when the peak O3 level rose to 110 g m−3 and was close to zero when the peak O3 level rose again to 170 g m−3.
Heatwave-related mortality will increase in the future as climate change causes heatwaves to become more frequent and intense, and to last longer. For instance, Gosling et al (2009) found that the increasing frequency, intensity and duration of heatwaves due to climate change in the future is projected to cause a 300% increase in heat-related deaths in Sydney by 2100, assuming an A2 scenario with no adaptation measures.
3.4. Projected impacts of climate change on air quality related health impacts in Sydney and Australia
Studies investigating the impacts of climate change on air quality related morbidity and mortality typically use global or regional climate models coupled with atmospheric chemistry models to project the impacts of climate change on air pollution using future scenarios for emissions, pollutants and population. Concentration-response functions from epidemiological time series studies are then applied to estimate the number of mortalities associated with projected changes in air pollution. There is one study that has explored this topic for Sydney and a number of global studies that have included Australia as one of the regions studied (Selin et al 2009, Fang et al 2013, West et al 2007 and Silva et al 2016).
3.4.1. Impacts of climate change on ozone-related health effects in Sydney
Physick et al (2014) estimate the independent impact of climate change on O3-related mortality using downscaled modelling for suburbs in Sydney. They model O3 concentrations for the decade 2051−2060 compared to a baseline decade of 1996−2005 using an A2 emissions scenario and three different threshold values for O3: 0 ppb, 25 ppb and 40 ppb (Physick et al 2014). To isolate the impact of climate change on O3-related health effects, precursor emissions for 2051−2060 were kept constant at 1996−2005 levels. Their results show that daily maximum 1 hour O3 concentrations are projected to increase across the whole of Sydney by 2051−2060 compared to 1996−2005, except for the coastal areas. The population-weighted increase in daily 1 hour maximum O3 concentrations between the baseline and future scenarios is 0.89 ppb for a 40 ppb threshold, 1.05 ppb for a 25 ppb threshold and 1.01 ppb for a 0 ppb threshold. The largest increase in O3 is projected to occur in northwest Sydney, bringing southwest Sydney and northwest Sydney to similar maximum O3 concentrations by 2051−2060 (as southwest Sydney has higher O3 levels in the baseline period). The main factors responsible for the increase in O3 across Sydney are a projected decrease in NOx emissions, an increase in VOCs and an increase in the number of hot days, with the most influential factor being the increased number of hot days (Physick et al 2014). The increase in deaths due to O3 exposure between 1996−2005 and 2051−2060 differs depending on the threshold values adopted. For a 40 ppb threshold, the increase in annual deaths averaged over the decade 1996−2005 compared to 2051−2060 is 55. Using a 25 ppb threshold, the average increase in annual deaths is estimated to be 65 and for a 0 ppb threshold, the average increase in annual deaths is estimated to be 60. In sum, they found that the influence of climate change alone (assuming constant precursor emissions) would cause an additional 55−65 deaths in Sydney in the decade 2051−2060 under an A2 emissions scenario compared to a baseline of 1996–2005, depending on the threshold value adopted (Physick et al 2014).
3.4.2. Impacts of climate change on ozone-related health effects in Australia
Other global studies on climate change impacts on O3 related mortality have included Australia as one of the regions studied and have mixed findings about how climate change will impact O3 related mortality (see Fang et al 2013, Jacobson 2008, Selin et al 2009, Silva et al 2016 and West et al 2007). West et al (2007) use the LMDz-INCA chemistry–climate model to simulate O3 concentrations for ten world regions including Australia and Japan (counted as one region) and the globe for four scenarios: a reference scenario for 2000 and three scenarios for 2030. The first scenario is the A2 emissions scenario, which assumes emissions and air pollution increase rapidly. The second scenario models the future impacts of current legislation to reduce emissions (CLE), and the third scenario assumes maximum feasible emissions reductions (MFR) are adopted using currently available technology. Ozone is measured as the population weighted annual average 8 h daily maximum. The effect of changes in O3 on premature mortality for each of the scenarios is estimated using a mortality coefficient derived from Bell et al (2004) and a 25 ppb threshold for O3, below which O3 is assumed to have no effect on mortality (West et al 2007). The results of this study show a substantial increase in O3 under the A2 scenario compared to the 2000 simulation for all world regions, including the region of Australia and Japan. For the region of Australia and Japan, the study finds that O3 would increase by 5.9 ppb under an A2 emissions scenario to reach 48.3 ppb compared to the reference scenario of 42.4 ppb. The CLE scenario also shows that O3 would increase in 2030, but by a smaller amount (1.1 ppb). On the other hand, if a strategy of maximum feasible emissions reductions were adopted, O3 would decrease by 5.8 ppb in 2030 compared to 2000 levels (West et al 2007, supplementary material). West et al (2007) estimate that 2,400 mortalities would be avoided in 2030 in the region of Australia and Japan by following the CLE scenario instead of the A2 emissions scenario, 1,500 of which would be cardiovascular or respiratory mortalities. Implementing MFR in the region of Australia and Japan would avoid 5,600 mortalities in 2030 compared to the A2 scenario, 3,500 of which would be cardiovascular or respiratory mortalities. The CLE scenario is perhaps the most likely scenario, as it models the future impact of current legislation. Adopting the maximum feasible reductions scenario instead of the CLE scenario would prevent 3,300 mortalities, 2,000 of which would be cardiovascular or respiratory mortalities (West et al 2007).
By contrast, other global studies by Fang et al (2013), Selin et al (2009) and Silva et al (2016) find no increase in O3 related mortalities for Australia. Selin et al (2009) use a moderate emissions scenario (A1B) to project the impacts of climate change on O3 and associated mortalities in 2050 in sixteen world regions including Australia and New Zealand (counted as one region). They find that O3 will decrease by 0.9 ppb in 2050 compared to 2000 levels in the Australia-New Zealand region, mostly due to a projected decrease in precursor emissions. They conclude that climate change will have no impact on O3 related mortalities in the Australia-New Zealand region. Similarly, Fang et al (2013) find that climate change will not cause an increase in premature respiratory mortalities from chronic O3 exposure over the 21st Century (Fang et al 2013, supplementary material). Silva et al (2016) find no increase in premature O3 related respiratory mortality in Australia in 2030 relative to 2000 for three representative concentration pathway (RCP) scenarios (RCP2.6, 4.5 and 6.0) but find an increase of 20 deaths per year under RCP8.5 in 2030, 250 deaths per year in 2050 and 790 deaths per year in 2100. RCP8.5 is a business-as-usual scenario that assumes emissions continue to grow throughout the 21st century.
3.4.3. Impacts of climate change on particulate matter-related health effects in Australia
To our knowledge, no original quantitative studies have investigated the impacts of climate change on PM related health effects in Sydney. Bushfires are currently the main source of peak pollution events in Sydney and there is strong evidence that fire risk will increase across south eastern Australia as a result of climate change (Johnston et al 2011). A warmer and drier future climate will increase the flammability of fuel and increase the rate of fire spread (Matthews et al 2012). This will lead to an increase in the number of days with fire danger as measured by the Forest Fire Danger Index (FFDI) (CSIRO and Bureau of Meterology 2015). In a business-as-usual scenario, the number of days with severe fire danger (FFDI = 50−74) will increase by 160%−190% by 2090 (CSIRO and Bureau of Meterology 2015). In south eastern Australia, the number of days with 'very high' (FFDI = 25−49) or 'extreme' (FFDI = 75−99) fire danger are projected to increase by 5%−23% and 10%–50% respectively by 2050 in a low warming scenario (0.7°C) and by 20%−100% and 100%−300% respectively by 2050 in a high warming scenario (2.9° C). As global average temperature has already increased by 0.8°C, the high warming scenario is much more likely to eventuate. In addition, the number of days that exceed the uppermost values of the FFDI will increase (Lucas et al 2007). In summary, across south eastern Australia the fire season will start earlier and end later and become more intense (Clarke 2015). In Metropolitan Sydney the number of days of severe fire weather (FFDI = 50−74) are projected to increase by an average of 0.6 days per year by 2070. Severe fire weather will increase during summer (the peak fire risk season) and spring (the prescribed burning season) (NSW DEH 2015). Despite being mobile and potentially coming from far away, smoke from bushfires will potentially be a significant source of increased PM for Sydney, but to the best of our knowledge no modelling studies have been undertaken to quantify the projected increase in bushfire specific PM in the Sydney region or its associated health effects.
Several of the studies discussed above considered the impacts of climate change on PM-related mortalities (e.g. Fang et al 2013 and Silva et al 2016), with mixed findings. Fang et al (2013) project that PM2.5 will increase in Australia over the 21st century, mainly due to increases in sulphate aerosols and fine dust particles (with a dry radius less than 0.1 µg) (Fang et al 2013, supplementary material). They estimate that this will cause annual premature all-cause mortalities to increase by 5% in Australia over the 21st century, causing an additional 100 mortalities per year. They also estimate that 6000 years of life will be lost annually due to climate change effects on PM2.5—an increase of 5.2% over the 21st century. On the other hand, Silva et al (2016) find no increase in PM-related mortalities as a consequence climate change.
3.4.4. Health co-benefits of mitigation policies
3.4.4.1. Studies for Greater Metropolitan Sydney (and studies for other Australian cities)
As many of the sources of greenhouse gas emissions are also the main sources of air pollution, a range of health co-benefits would result from greenhouse gas mitigation strategies. Reducing the combustion of fossil fuels would result in improved air quality and a probable decrease in cardiorespiratory diseases (Kjellstrom and Weaver 2009). In addition, reducing the number of vehicles on the road by improving public transport would likely increase the fitness of the population and reduce obesity, with associated health benefits (Kjellstrom and Weaver 2009). Rissel (2009) outlines some of the active transport initiatives that exist in New South Wales and Giles-Corti et al (2010) discuss the health co-benefits that may arise from investing in policy initiatives that promote active transport options in New South Wales. However, as far as we are aware, no quantitative peer-reviewed articles on health co-benefits arising from mitigation policies exist for Sydney. A quantitative assessment of health co-benefits of mitigation in the transport sector has been conducted in Adelaide, Australia by Xia et al (2015). They assess five alternative transport scenarios for 2030, ranging from a reduction of 5% in vehicle kilometres travelled to a reduction of 40% and quantify the various environmental and health benefits arising from each scenario. Results indicate that reducing the number of vehicle kilometres travelled by 40% would result in a reduction in PM2.5 of 0.4 μg m−3. This improvement in air quality would prevent 13 deaths and 118 life years lost to disability, ill health or premature death (referred to as disability adjusted life years—DALY) per year. Additionally, 508 deaths per year and 6,569 DALYs per year would be prevented in Adelaide by the increased physical fitness associated with other forms of transport such as walking and using bicycles and public transport. A further 21 deaths per year and 960 DALYs per year would be prevented due to avoided traffic injuries. In sum, significant health benefits would be gained by reducing the number of vehicle kilometres travelled.
3.4. Summary and discussion of findings
This review has summarised relevant literature on how climate change may impact air quality related health impacts in Sydney, Australia. In doing so, it has identified a number of significant gaps in knowledge. As well as summarising the key findings, this section outlines some of the key gaps in knowledge that need to be addressed in order to inform evidence-based policies and planning strategies.
Outdoor air pollution in Sydney is already associated with increased mortality and hospital admissions for COPD, childhood asthma and heart disease, especially amongst those 65 years old and above. The association between urban air pollutants such as NO2, CO and PM occurs at levels below the national guidelines. Exposure to urban air pollution in Sydney is also associated with increased admissions for asthma in children, particularly in the warmer months. Exposure to urban air pollution during pregnancy is associated with low birth weight babies. An estimated 2.1% of total deaths in 2007 in Sydney were attributed to urban air pollution, and 1.8% of years of life lost. Smoke events have been associated with a 5% increase in all-cause mortality in Sydney (with a lag of one day) and a 12% increase in same-day hospital admissions. Studies investigating how human health is affected by air quality in Sydney show that the impacts of air pollution on health are similar to other Australian cities.
Both synoptic scale and mesoscale processes affect air quality in Sydney. High pollen concentrations generally occur between October and December. Synoptic categories associated with high pollen counts are characterised by a low-pressure system to the south of Australia generating strong, hot, dry westerly gradient winds, with a small coastal-inland thermal gradient. Synoptic categories associated with high O3 concentrations are characterised by a high-pressure system located in the Tasman Sea generating light north westerly gradient winds with high temperatures, afternoon sea breezes, shallow mixing depth and warming aloft. High-pressure systems over the Tasman sea generating north easterly sea breezes, with high temperatures and high solar radiation are generally correlated with high concentrations of O3 and PM10.
Climate change is likely to exacerbate the health impacts from air pollution in Sydney. The influence of climate change alone (assuming constant precursor emissions) would cause an additional 55−65 deaths per year in Sydney in the decade 2051−2060 under an A2 emissions scenario compared to a baseline of 1996−2005, depending on the threshold value adopted (Physick et al 2014). The figures for total mortality in this study are likely an underestimate. If future projections for precursor emissions were taken into account, the figure would likely be much higher. Global modelling studies that have included Australia as one of the regions studied have had mixed findings, depending on the time periods and scenarios modelled. West et al (2007) find that O3 increases in an A2 scenario. Selin et al and Fang et al model an A1B scenario, which assumes moderate warming, and find that O3 will not increase. Silva et al (2016) find that O3 will increase under an RCP8.5 scenario, which is a scenario that assumes emissions continue to grow on a business as usual trajectory.
The study by Physick et al (2014) described above broadly corroborates findings from regional studies in North America about how climate change will impact O3 levels (see for instance Bell et al 2007, Cheng et al 2008, Fann et al 2015, Jackson et al 2010, Knowlton et al 2004, 2008, Post et al 2012, Sheffield et al 2011 and Tagaris et al 2007, 2009, 2010). All of these studies find, to varying degrees, that O3 levels will increase in North America, with associated adverse health effects. For example, Bell et al (2007) find that climate change will cause O3 to increase across 50 cities in the eastern United States by an average of 4.8 ppb, with the highest increase being 9.6 ppb. This would result in an increase in associated mortality of between 0.11%−0.27% in the 2050s compared to the 2000s. Regional studies focused on continental Europe or the United Kingdom generally find that O3 related mortality is projected to increase in southern Europe and to decrease in northern Europe (see for instance Casimiro et al 2006, Doherty et al 2009, Geels et al 2015, Orru et al 2013 and Tainio et al 2013). As many of Australia's cities (e.g. Perth and Adelaide) have a Mediterranean style climate with hot, dry summers and mild to wet winters these results may have implications for future air quality in parts of Australia.
3.6. Priority research gaps
Whilst there are a number of studies that have investigated the relationship between meteorological processes and air quality in the current climate, there are no studies to our knowledge that use observed correlations, perturbation analysis or coupled CTM-GCM models (except Physick et al 2014) to investigate how projected changes in meteorological variables may impact air quality in Sydney in the future under different climate change scenarios. This is a crucial area for future research as such a study could underpin further research to investigate the health impacts arising from these changes.
As pointed out in the findings, there are no studies that investigate the impacts of climate change on PM-related health impacts in Sydney. This is also an under-researched area in studies from overseas, with the vast majority focusing on O3 instead of particulate matter. Exceptions are Tagaris et al (2009), Geels et al (2015) and Tainio et al (2013).
Research on how climate change will impact PM and associated health impacts should be a priority for Sydney-based air quality modelling. Although more difficult to model, the health impacts of PM are likely to be much larger than the health impacts of O3, mainly because there is no known safe threshold for PM and cumulative exposure worsens health impacts. According to Physick et al (2014) the methodology developed in their investigation of O3 related health impacts in Sydney could be applied to investigate the impacts of climate change on PM and associated health impacts. As demonstrated by Jiang et al (2017) and others, understanding mesoscale meteorological processes is crucial for understanding the interaction between meteorology and air quality in Sydney. The downscaled modelling developed by Physick et al (2014) is particularly useful for exploring spatial variability of air quality projections for Sydney.
As climate change is projected to cause an increase in fire weather in Australia, research quantifying the implications of this for air quality and health would be beneficial to include in a study that models the impacts of climate change on PM. There are no studies for Sydney that have projected the increase in PM attributable to climate-driven wildfires as done by Liu et al (2016) or Spracklen et al (2009) in the western United States.
There is also a lack of research on how climate change will specifically impact aeroallergens and resultant health impacts in Sydney or in other cities and regions of Australia. Indeed, building blocks for such a study are lacking, including quantitative studies on the association between aeroallergens and health impacts such as allergic asthma hospital admissions in Sydney. Given the importance of local climate, micro geography and allergenic pollen vegetation in influencing allergic asthma and rhinitis, studies should be conducted to map allergenic pollen vegetation and investigate health impacts, both for Sydney and other cities and rural areas in Australia.
Studies from overseas suggest that increased ambient concentrations of allergenic pollen in the future climate will result in more severe symptoms of asthma and allergic rhinitis amongst those with pre-existing conditions, or may be the actual driver of asthma initiation (Beggs and Bennett 2011, Cecchi et al 2010). For example, a study modelling the impacts of climate change on aeroallergens and asthma emergency hospital admissions in the United States found that a high end scenario of future greenhouse gas concentrations (RCP8.5) could result in a significant increase in the length of the oak pollen season in the United States, leading to an increase in asthma emergency department visits in all regions studied and in all future scenarios costing the healthcare system millions of dollars (Anenberg et al 2017). Given that asthma is already so prevalent in Australia, it is important to investigate if and to what extent climate change may increase the risk of asthma.
Quantitative analysis on the health co-benefits from improved air quality resulting from potential mitigation scenarios in Sydney and Australia is also needed. To our knowledge, with the exception of Xia et al (2015) no quantitative studies on health co-benefits exist within Australia. Yet, given that the health costs of air pollution in the Sydney Greater Metropolitan Region are estimated to be between $700 million and $6 billion annually, reducing air pollution would likely result in substantial savings to the health system. This is a conservative estimate, using a threshold value of 7.5 µg m−3, below which air pollution is assumed to cost the health system nothing (NSW DEC 2005). Between $105 million and $990 million is attributable to motor vehicle emissions alone (NSW DEC 2005). Studies from overseas indicate that substantial ancillary economic and health benefits are often associated with mitigation of greenhouse gases. Methods and results of studies on health co-benefits from mitigation in the United States and Europe vary widely, but almost all studies find some degree of economic, environmental and/or health co-benefits related to greenhouse gas (GHG) mitigation scenarios (see for instance Burtraw et al 2003, Van Harmelen et al 2002, Cifuentes et al 2001, West et al 2013). The quantification of impacts and potential benefits of action for Sydney and other cities in Australia should be the subject of future studies in this area.
Air pollution in Sydney already has an adverse impact on cardiorespiratory mortality and morbidity. Studies from Sydney, Australia and from overseas show that climate change may make this problem worse by increasing levels of O3 and PM and associated health effects. Though detailed extrapolations should not be made based on projected changes to meteorological variables alone, it is clear that both on their own and combined, the projected changes to meteorological variables in Sydney have the potential to lead to worse air quality in the future. Temperature is positively correlated with O3 formation; so increased projected temperatures in Sydney (both average and extreme) may lead to more O3 formation in areas with high precursor pollutants. Precipitation is the main PM scavenger, so a decline in rainfall may contribute to worse air quality, though projections associated with rainfall are uncertain. The projected decline in humidity may also contribute to worse air quality, as conditions with lower humidity have been correlated with higher pollen counts in Sydney. Wind tends to have the effect of dispersing air pollutants resulting in better air quality (although sometimes winds can just transport air pollution from one area to another, or can increase air pollution from natural sources such as dust). The projected decline in wind for Sydney (though uncertain) will potentially contribute to worsening air quality in the future. Modelling is needed to assess the interrelationships between future changes in multiple meteorological variables and air quality so these risks can be mitigated.
The 'climate penalty' on air pollution may mean that stronger air quality guidelines will need to be adopted in order to reach current air quality goals over the 21st century. Moreover, literature on co-benefits shows that adopting more stringent air quality guidelines would likely result in mitigation co-benefits and likewise that adopting more stringent mitigation targets could result in significant health and economic co-benefits. Future research on health impacts of air pollution in Sydney would be made more relevant by considering synergistic interactions between air pollution and temperature, and the interactions between future urbanisation and population growth and climate change. This would give a more accurate picture of the actual air quality conditions, compared to trying to isolate the effect of one influence (as many studies have done). Such approaches are crucial for devising appropriate strategies to mitigate future health risks arising from climate change impacts on air quality.
Footnotes
- 4
This is not to suggest that outdoor air quality is more important than indoor air quality. Indeed a recent study by McDonald et al (2018) shows that volatile chemical products mostly from indoor sources are now competing with the traditional major anthropogenic sources of volatile organic compounds from transportation and other outdoor sources in the United States.