

Abstract
Understanding how continuing increases in global mean temperature will exacerbate societal exposure to extreme weather events is a question of profound importance. However, determining population exposure to the impacts of heat extremes at 1.5 °C and 2 °C of global mean warming requires not only (1) a robust understanding of the physical climate system response, but also consideration of (2) projected changes to overall population size, as well as (3) changes to where people will live in the future. This analysis introduces a new framework, adapted from studies of probabilistic event attribution, to disentangle the relative importance of regional climate emergence and changing population dynamics in the exposure to future heat extremes across multiple densely populated regions in Southern Asia and Eastern Africa (SAEA). Our results reveal that, when population is kept at 2015 levels, exposure to heat considered severe in the present decade across SAEA will increase by a factor of 4.1 (2.4–9.6) and 15.8 (5.0–135) under a 1.5°- and 2.0°-warmer world, respectively. Furthermore, projected population changes by the end of the century under an SSP1 and SSP2 scenario can further exacerbate these changes by a factor of 1.2 (1.0–1.3) and 1.5 (1.3–1.7), respectively. However, a large fraction of this additional risk increase is not related to absolute increases in population, but instead attributed to changes in which regions exhibit continued population growth into the future. Further, this added impact of population redistribution will be twice as significant after 2.0 °C of warming, relative to stabilisation at 1.5 °C, due to the non-linearity of increases in heat exposure. Irrespective of the population scenario considered, continued African population expansion will place more people in locations where emergent changes to future heat extremes are exceptionally severe.
Export citation and abstract BibTeX RIS

Original content from this work may be used under the terms of the Creative Commons Attribution 3.0 licence.
Any further distribution of this work must maintain attribution to the author(s) and the title of the work, journal citation and DOI.
1. Introduction
There is significant societal interest in understanding how changes to climate extremes will proliferate in a warming climate (Seneviratne et al 2016, Stott 2016, Stott et al 2016). Following the successful signing of the Paris Agreement in December 2015 (Schleussner et al 2016b, Rogelj and Knutti 2016), a targeted focus has emerged within the scientific community to better understand how changes to the global climate system will evolve in response to specific thresholds of future global mean warming, such as 1.5 °C or 2 °C above 'pre-industrial levels' (Mitchell et al 2016b, Hawkins et al 2017, King et al 2017, Kraaijenbrink et al 2017).
Multiple recent studies have evaluated the changes to climate extremes expected to occur in response to limiting global mean warming to 1.5 °C and 2 °C, with several different modelling frameworks and complementary methodologies being used to provide these estimates (Fischer and Knutti 2015, Schleussner et al 2016a, Ciavarella et al 2017, Sanderson et al 2017, Schleussner et al 2017, Lewis et al 2017, Henley and King 2017, Mitchell et al 2017, King et al 2017, King and Karoly 2017, Perkins-Kirkpatrick and Gibson 2017, Russo et al 2017). This variety in analytical approaches is particularly important, recognising estimates of future risk may differ depending on potentially subjective framing choices (James et al 2017). These include, but are not limited to: (1) the treatment of 'pre-industrial' baseline periods (Hawkins et al 2017, Schurer et al 2017); (2) what timescales are used to measure 1.5 °C and 2 °C (Henley and King 2017, Rogelj et al 2017); (3) whether or not temporary exceedances in a given temperature target are permitted before stabilisation (Knutti et al 2016, Rogelj and Knutti 2016, Schleussner et al 2016b); and (4) the specific combination of forcing pathways selected, recognising that different combinations of greenhouse gas and aerosol emissions, for example, can produce stabilisation at the same level of global mean warming (Millar et al 2017, Wang et al 2017). The analysis presented here only utilises a modelling framework specifically designed to understand changes to high-impact extreme weather events under 1.5 °C and 2 °C of warming (Mitchell et al 2016b, 2017), so should therefore be interpreted in the context of other studies using different but complementary methods of analysis.
Recognising that more-frequent and more-intense climate extremes will often lead to substantially higher impacts when they occur in highly populated areas, recent research has focused on the implications of future changes to heat extremes for specific regions of interest (Im et al 2017, Mishra et al 2017, Russo et al 2017, Liu et al 2017, Jones et al 2015, Pal and Eltahir 2016). However, multiple lines of evidence also demonstrate that different regions of the world can experience substantially different rates of emergent climate change given the same amount of global mean warming (Mahlstein et al 2011, Diffenbaugh and Scherer 2011, Hawkins and Sutton 2012, Harrington et al 2016, Diffenbaugh and Charland 2016, Davis and Diffenbaugh 2016, Herold et al 2017, Frame et al 2017, Harrington et al 2017, Mora et al 2017). Therefore, consideration must be given as to how changes to where people live, as well as changes to overall population size, will influence collective exposure to future heat extremes. By combining very large ensembles of high-resolution climate model simulations with spatially explicit projections of future population change (Jones and O'Neill 2016), this study will quantify the relative contributions of (1) emergent temperature change, (2) projected changes in total population size and (3) changes to where people live in exacerbating exposure to future heat extremes.
2. Data and methods
2.1. Model framework
This analysis employs atmosphere-only model simulations using an experimental framework developed under the 'Half a degree Additional warming, Prognosis and Projected Impacts' (HAPPI) project (Mitchell et al 2016b). The HAPPI model framework prescribes sea surface temperatures and other boundary conditions (sea ice, greenhouse gases, aerosols) that would be consistent with the current climate, as well as for future worlds under 1.5 °C and 2 °C of global mean warming (see Mitchell et al (2017) for further details of the experimental setup). We apply these boundary conditions, via the Weather@Home (W@H) distributed computing framework, to produce thousands of atmosphere-only regional climate model simulations over a spatial domain encompassing a large region of Asia, the Middle East and Eastern Africa (hereafter SAEA region, figure 1). The W@H project utilises the spare computing power of volunteers to run thousands of simulations of the global atmosphere-only model HadAM3P (horizontal resolution of 1.875° × 1.25°), with a nested regional model (HadRM3P) operating over SAEA at a horizontal resolution of approximately 50 kilometres (see Guillod et al (2017) for further details of the W@H modelling framework). This combination of very large model ensembles (between 1500 and 2500 model years per experiment, see table S1) with high-resolution climate data provides a unique opportunity to accurately characterise population exposure to exceptionally severe heat events under future warming.
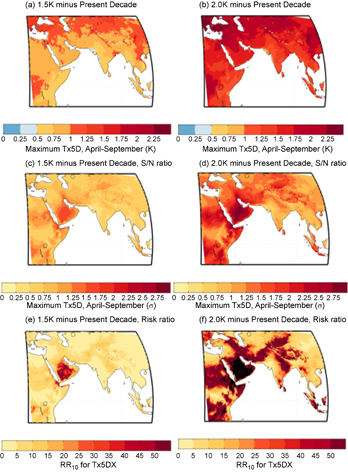
Figure 1. Ensemble-mean projected increase in maximum five-daily maximum temperatures (Tx5DX), for the (a) 1.5 °C and (b) 2.0 °C HAPPI simulations, relative to the 'present-decade' simulations. Calculations for each model year have been made for the period April to September and results are presented for the full SAEA domain (14°S–47°N, 20°E–114°E). Panels (c) and (d) are the same as for (a) and (b), but this time in units of σ, where σ is calculated for each grid point as the standard deviation of all Tx5DX estimates in the 'present-decade' ensemble. Bottom panels show RR10 estimates for the (e) 1.5 °C- and (f) 2.0 °C-warmer worlds. Black regions denote regions where a one-in-ten year event under a 2.0 °C-warmer world is unprecedented in the 'present-decade' ensemble.
Download figure:
Standard image High-resolution image2.2. Quantifying changes to extreme heat after 1.5 °C and 2.0 °C of warming
To quantify changes in extreme heat across the SAEA region under future warming scenarios, we first calculate five-day running mean values of daily maximum temperatures at each grid point in the region, and then extract the maximum value found across the period spanning April to September for each model year (hereafter Tx5DX). This yields 2692, 1785 and 1863 estimates of Tx5DX at each grid point for model simulations of the present-decade climate, 1.5 °C and 2 °C worlds, respectively (see supplementary table S1 available at stacks.iop.org/ERL/13/034011/mmedia). The choice of a five-day window is subjective, but is intended to reflect the approximate length of heat events for which severe impacts manifest themselves across the regions of interest.
The threshold of Tx5DX which occurs for one-in-ten model years under each of the future scenarios is then identified for each grid cell, and we then quantify the probability of this same threshold being exceeded in the present-decade runs. We then calculate the ratio of the probability of occurrence in the future (one in ten, by definition) relative to the probability of occurrence today, and denote this term the risk ratio (or RR10). Hence, this metric represents the increase in frequency of future extreme heat, relative to the present-day climate.
While previous studies provide confidence in the capability of HadAM3P to faithfully simulate high-temperature extremes (Uhe et al 2016, Guillod et al 2017), the decision to present changes between warming levels in a relative framework (rather than in terms of absolute temperatures) ensures raw model output can be used directly, and avoids the need to make subjective decisions about what bias correction techniques might be most appropriate (Sippel et al 2016).
Finally, while the risk ratio metric applied here remains consistent with the approach employed by many previous studies (Stott et al 2016, NAS 2016), it is noted that our method differs by defining an event threshold with respect to the future world, rather than the present-day world. This choice was made to ensure that estimates of very small probabilities will be calculated with the experiment which has the largest ensemble size. Further, it is noted that the choice of a one-in-ten year event in the future is an arbitrary threshold, but enables consideration of the most severe heat extremes which could occur in the future.
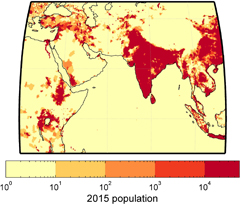
Figure 2. Observed population count over the SAEA region for the year 2015. Data is presented at 0.25° × 0.25° horizontal resolution, and provided by the Gridded Population of the World version 4 (GPWv4) dataset, administered by the NASA Socioeconomic Data and Applications Center (SEDAC) and hosted by the Center for International Earth System Information Network (CIESIN, doi: https://dx.doi.org/10.7927/H4X63JVC).
Download figure:
Standard image High-resolution image2.3. Patterns of extreme heat under a 1.5°- and 2°-warmer world
Figures 1(a) and (b) present ensemble-mean increases in Tx5DX across the SAEA region under the 1.5 °C and 2 °C experiments, relative to the present-decade experiment. Both results show regions of faster-than-average warming in higher latitudes and in continental interiors, while less rapid signals are found in coastal regions and at lower latitudes—such patterns are consistent with expected changes to absolute temperature under future warming (Joshi et al 2008, Collins et al 2013).
To interpret the relative significance of these future changes in extreme heat, figures 1 (c) and (d) show the same results as for panels a and b, but this time normalised by the variability in Tx5DX experienced in the current climate (taken as the standard deviation across all 'present-decade' model runs, calculated separately for each individual grid box). When warming is kept to 1.5 °C, changes remain relatively modest across the full region, with most places experiencing changes in Tx5DX of less than 1σ (with the exception of parts of the Middle East). But after 2.0 °C of warming, changes exceeding 2 standard deviations can be found across large regions of equatorial Africa, as well as large sections of Indonesia, the Middle East and Iran. Such changes are all the more striking when ensemble-mean estimates of RR10 are considered (figures 1(e) and (f)): while under 1.5 °C of warming, most regions experience risk ratios less than ten, increases in the frequency of severe local Tx5DX escalate to well beyond 50 f old for many regions in the 2.0 °C-warmer world. In fact, the regions in black denote those locations for which the threshold of temperature seen every ten years in the future was never seen to occur across more than 2600 model years in the present-day climate. Such results corroborate previous studies, which found significant changes to the frequency of heat extremes are possible after only 2.0 °C of warming, though such dramatic increases could be minimised if global mean warming is kept to 1.5 °C (Perkins-Kirkpatrick and Gibson 2017, Russo et al 2017, Lewis et al 2017).
2.4. Quantifying probabilistic changes to heat exposure
Previous research has shown that the signal of changes to extreme heat emerges first when assessed as an average over large spatial scales (Angélil et al 2014), while higher variability at smaller scales may suppress any detectable signal of change (King et al 2015). However, multiple studies have also demonstrated how robust changes in extremes can in fact be found at small spatial scales when the results of many individual locations are aggregated together (Fischer et al 2013, Westra et al 2013, Fischer et al 2014, Schleussner et al 2017). An adapted version of this framework is applied here to quantify levels of population exposure to future changes in extreme heat, as found in figure 1, using gridded population data for the year 2015 (figure 2, CIESIN 2016).
Following equation (1), the average heat exposure for a given region is calculated across all ensemble members, N, by summing the risk ratio (RR10) estimates across all grid cells (spanning latitudes ϕ1 and ϕ2, and longitudes λ1 and λ2) with a weighting proportional to the fraction of people living in that grid cell, P/PTOT. More generally, this approach produces a probability distribution which characterises population exposure to different risk ratios after 1.5 °C and 2 °C of warming. This framework therefore emphasises the importance of changing extremes where people live (Frame et al 2017), and will take into account not only future changes to distributions of temperature, but also changes to the number of people living in various locations.
2.5. Population changes consistent with a 1.5°- and 2°-warmer world
Of course, when considering changes in population exposure to heat extremes under warming targets consistent with the Paris Agreement, a key determinant concerns the range of population scenarios which would be consistent with such a future. The Shared Socioeconomic Pathways (SSPs) provide a range of plausible future pathways of population and socioeconomic changes, and encompass the full spread of corresponding climate change scenarios from the Representative Concentration Pathway (RCP) database (KC and Lutz 2017, O'Neill et al 2016, Jones and O'Neill 2016). In addition to present-day population observations, this study also examines population projections for the year 2090 under an SSP1 and SSP2 scenario: these two were selected as 'baseline' scenarios most closely aligned, respectively, with the RCP2.6 and RCP4.5 climate scenario (O'Neill et al 2016). Since linear combinations of model simulations from both these RCPs were also used to produce the 1.5 °C and 2.0 °C HAPPI experiments (Mitchell et al 2017), we hereafter consider both SSP scenarios as feasible to occur in a future world where temperatures stabilise at 1.5 °C.
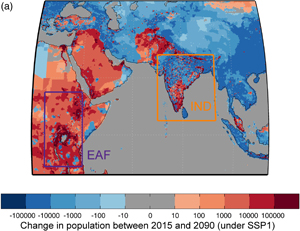
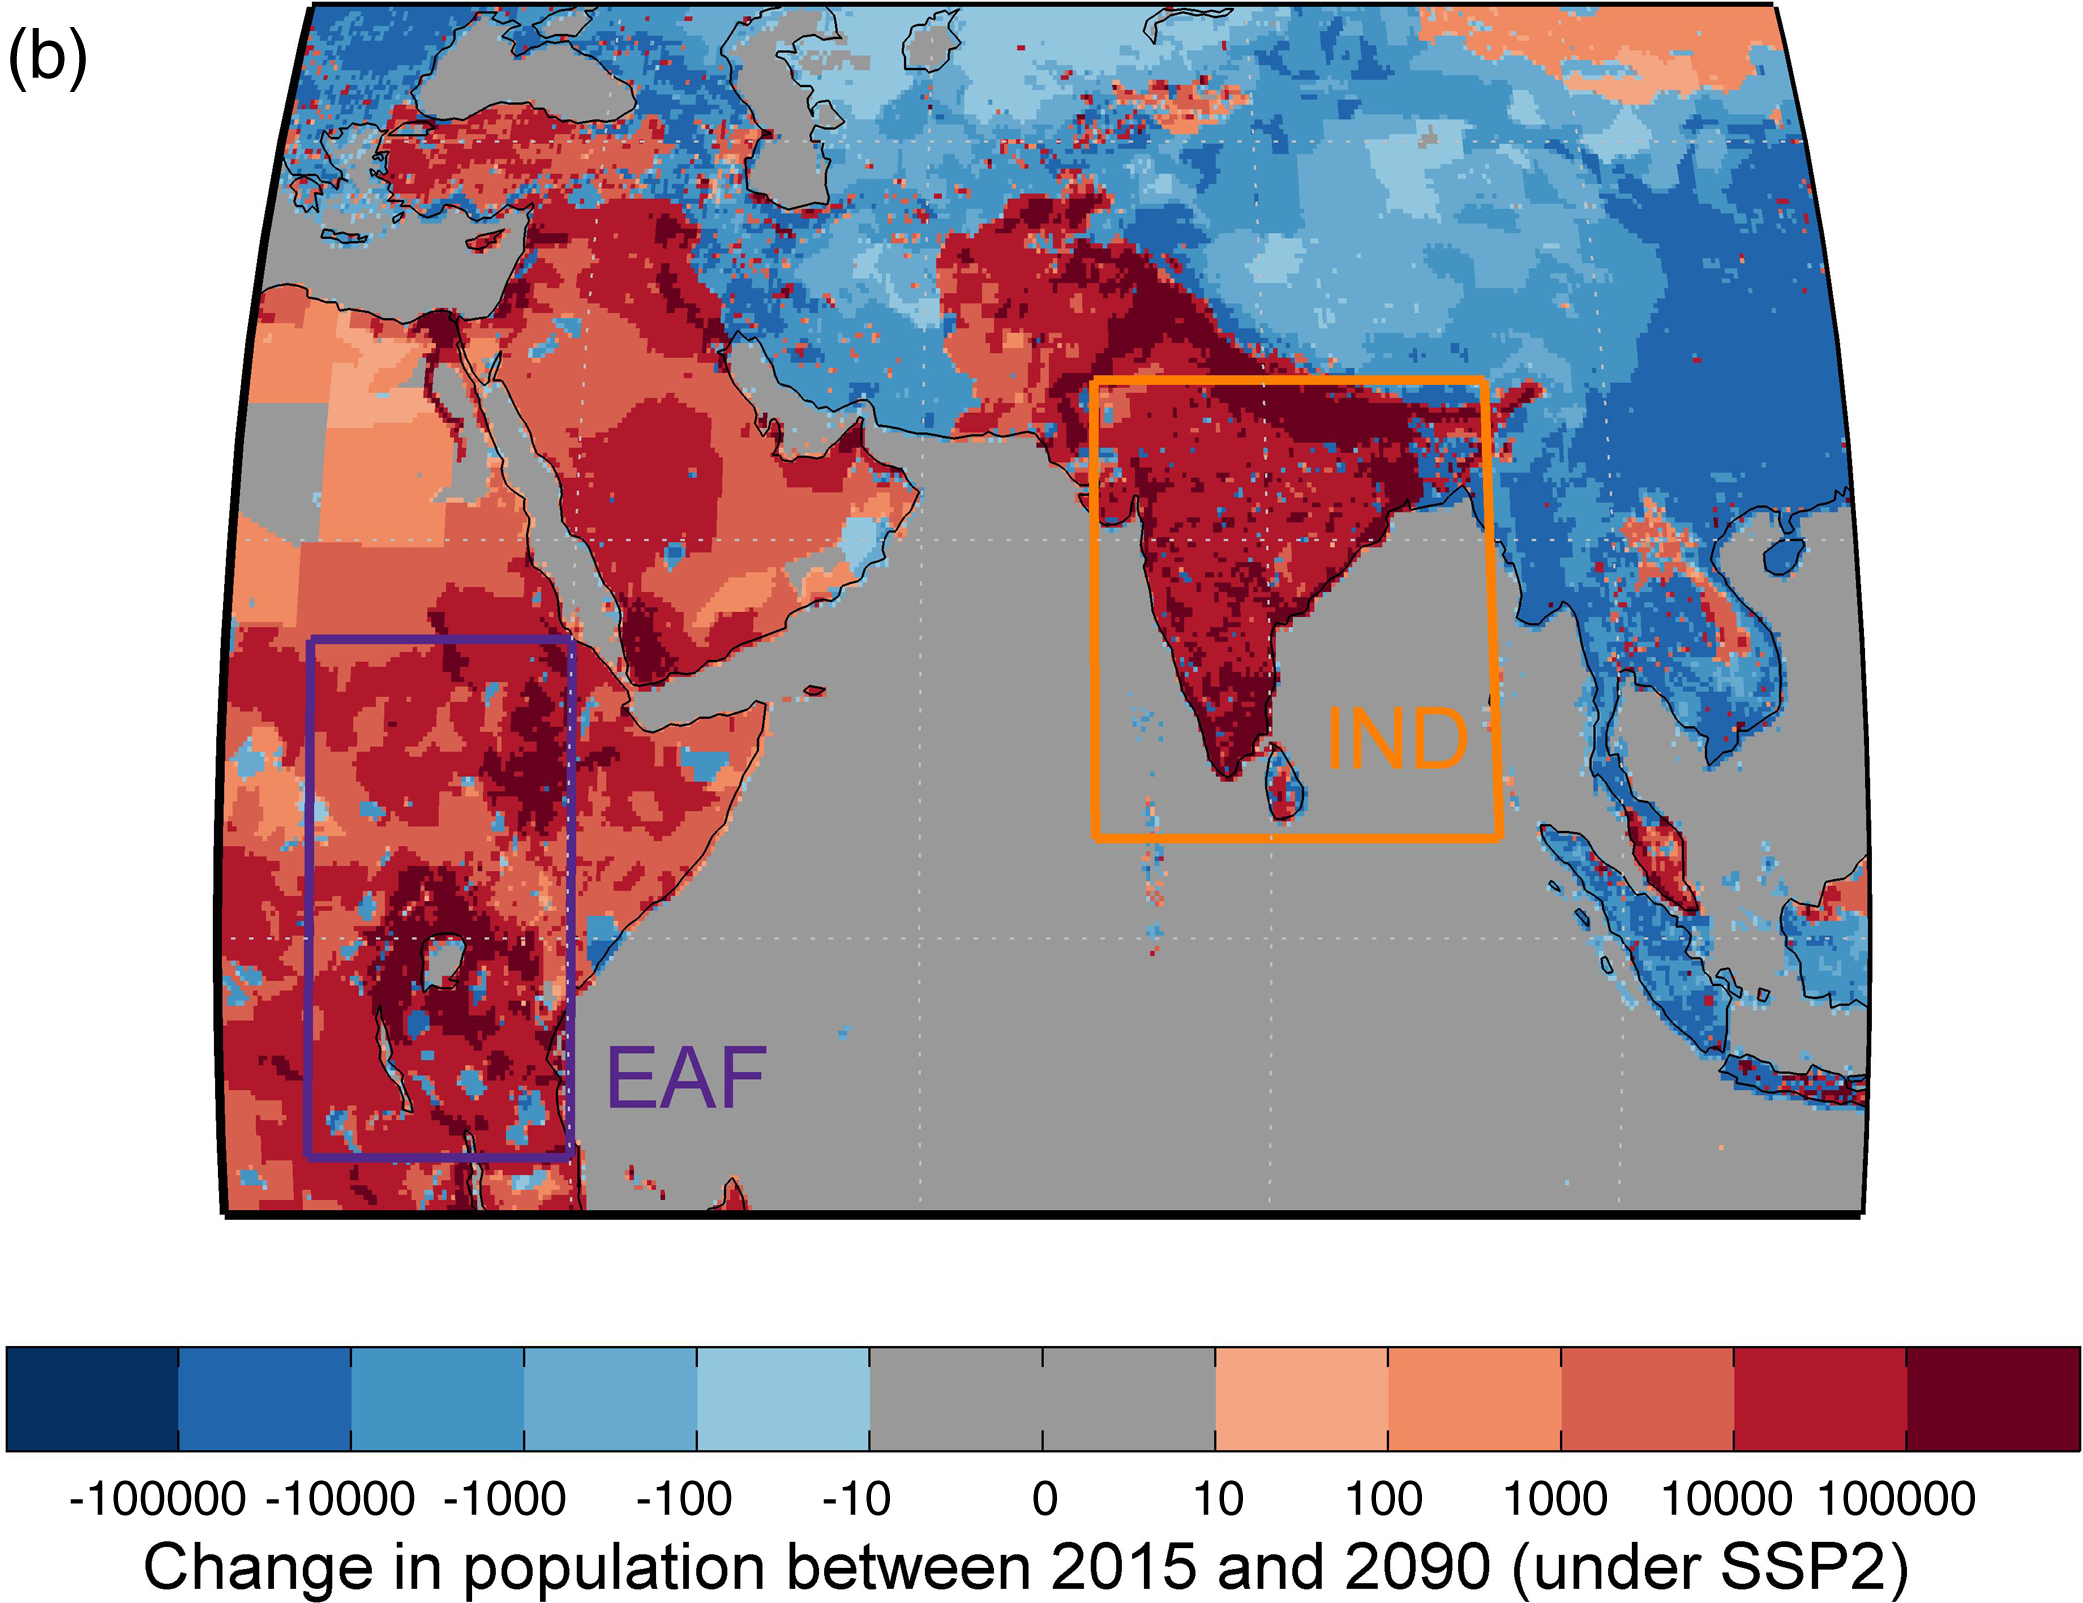
Figure 3 shows changes in absolute population between 2015 and 2090 under the two SSP scenarios considered. Both population data sets were first interpolated to a common 0.25° × 0.25° resolution before calculations were made. Under both scenarios, there are two large-scale patterns of population change which emerge: (1) widespread decreases in population over many mid-latitude regions, including Central Asia and China, as well as large regions of South-east Asia; and (2) robust increases in population over the Middle East, parts of Pakistan and Afghanistan, and most notably over widespread areas of Eastern Africa, including already densely-populated regions in Ethiopia, Kenya, Tanzania and Uganda. Whilst more obvious under SSP2, smaller but more concentrated patterns of growth also exist under SSP1 over parts of East Africa, Turkey and even India—a feature likely indicative of continued urban intensification (Jiang and O'Neill 2017). Interestingly, population projections across India are more divergent than other regions: negligible changes in total population between 2015 and 2090 are found under an SSP1 scenario, while at least another 400 million people will inhabit the region under an SSP2 scenario (KC and Lutz 2017). Such large variations in trajectories between the scenarios for different regions can be primarily linked to (a) differences in present-day population age structures, and (b) the differing prospects of changing education rates for younger adult females (aged 20–39, KC and Lutz 2017).
Download figure:
Standard image High-resolution image
Figure 3. Projected population changes for the year 2090 under an (a) SSP1 and (b) SSP2 scenario, relative to observations for the year 2015. Both SSP scenarios and observations have been regridded to a common 0.25° × 0.25° horizontal resolution before the calculations have been performed. The full spatial domain corresponds to the SAEA domain; the smaller purple and orange rectangles correspond, respectively, to the EAF (11°S–15°N, 25°E–40°E) and IND (5°N–28°N, 70°E–93°E) sub-regions selected for further analysis.
Download figure:
Standard image High-resolution image
To better understand how the SAEA-wide changes in exposure to extreme heat will translate down to smaller spatial scales with differing projections of future population, two sub-regions have been selected for further analysis: one encompassing the East African (11°S–15°N, 25°E–40°E; hereafter 'EAF') domain exhibiting strong growth irrespective of SSP; the other encompassing an area over India, Bangladesh and Sri Lanka (5°N–28°N, 70°E–93°E; hereafter 'IND') which displays scenario-dependent population growth characteristics.
3. Results
Table 1 presents results of population exposure to RR10 for the three regions of interest, under the multiple combinations of population and climate scenarios of relevance in this study. To represent the variability in exposure implicit in looking over a large population grouping, we hereafter quantify the ensemble-median level of exposure to RR10, as well as the RR10 which will be very likely and very unlikely (90% and 10% likelihood) exceeded by a given person across the SAEA, EAF and IND regions.
3.1. Aggregate changes to future heat exposure
For the full SAEA region, median exposure to severe Tx5DX increases by a factor of 4.1 (2.4–9.6) under 1.5 °C of warming and when population is kept fixed to 2015 levels, while this number rises to 15.8 (5.0–135) after 2.0 °C of warming. When population changes are also accounted for, SAEA-wide exposure increases by a further 50% under the SSP2 population scenario, while increases are also seen, though less significant, in the lower-population SSP1 scenario. Interestingly, median RR10 increases by a factor of four (2.1–25) if temperatures reach 2.0 °C of warming, instead of stabilising at 1.5 °C, irrespective of the population data set chosen. Such results are even more dramatic than previous-reported estimates of a doubling in extreme heat between 1.5 °C and 2.0 °C—however, those results were found using coarser-resolution models and with respect to the entire globe (Fischer and Knutti 2015).
Results for the sub-region encompassing India, Bangladesh and Sri Lanka (IND) qualitatively follow the same patterns of absolute exposure as for the wider SAEA region—such an outcome is unsurprising, given about one-third of the population across the entire SAEA domain is concentrated within the smaller IND region (table s2).
Across the East African (EAF) sub-region, increases in extreme heat are found to become 5.7 (2.1–12.2) times more likely after 1.5 °C warming if population remains fixed at 2015 levels, while risk ratios reach 9.4 (4.1–22.2) and 13.0 (5.7–30.7) if future population changes follow an SSP1 or SSP2 scenario respectively. Interestingly, there is a robust change in the frequency of extremes between the lower- and higher-warming scenarios: an estimated 5.2 fold (2.5–22) increase in extremes is expected between the 1.5- and 2 degree worlds irrespective of population scenario. These larger increases in RR overall for EAF (relative to the entire SAEA region) are indicative of the faster emergence in extreme temperatures found in figure 1, and also agree with many other studies focusing on the relative rapidity of changes in heat extremes across the African continent (Mahlstein et al 2011, Russo et al 2016, Harrington et al 2016).
3.2. Quantifying the relative impact of changes in climate versus population dynamics
While absolute changes in the frequency of heat extremes are highly informative for regional stakeholders, the methods chosen in this study enable us to further interrogate the changes in population exposure to RR10, by quantifying the relative importance of three factors: (1) changes attributable to increases in global mean temperatures (RRCLIM); (2) changes attributable to differences in total population size (RR∆POPN); and (3) changes attributable to the spatial reorganisation of the population exposed (RRREDISTRIBUTION). Combined, we find

where RRCLIM is found by keeping population levels fixed at 2015 observations (first column of table 1) and RR∆POPN simply equals the percentage increase in total population for the region of interest under the different SSP scenarios considered (relative to 2015 observations). To calculate RRREDISTRIBUTION, we repeat the process of spatially aggregating risk ratios weighted according to where people live, but first normalise the maps of population for all three scenarios, so individual grid cells contain information about what percentage of the region's people live there, rather than what is the total number of people living there. By removing the effect of changes in total population size, the fractional difference in risk ratio between these results using 2015 populations, and those using SSP scenarios, will equal the percentage increase in risk of extreme heat attributable to changes in where people live (and thus RRREDISTRIBUTION).
Table 1. Projected changes in population exposure to extreme Tx5DX for three regions under a range of future climate scenarios and population scenarios. Main answers denote the risk ratio which the median (50th percentile) person would experience; the answers in brackets respectively denote the risk ratios experienced by at least 90% and 10% of the relevant population grouping.
| (a) SAEA | 2015 population | SSP1–2090 | SSP2–2090 |
|---|---|---|---|
| RR10 at 1.5 °C | 4.1 (2.4/9.6) | 4.4 (2.3/10.6) | 5.9 (3.0/13.8) |
| RR10 at 2.0 °C | 15.8 (5.0/135) | 18.9 (4.9/264) | 26.6 (6.5/346) |
| RR2.0/RR1.5 | 3.9 (2.1/14) | 4.3 (2.1/25) | 4.5 (2.2/25) |
| (b) EAF | |||
| RR10 at 1.5 °C | 5.7 (2.3/12.2) | 9.4 (4.1/22.2) | 13.0 (5.7/30.7) |
| RR10 at 2.0 °C | 29.9 (5.9/269) | 48.8 (10.0/488) | 67.5 (13.8/675) |
| RR2.0/RR1.5 | 5.2 (2.5/22) | 5.2 (2.4/22) | 5.2 (2.4/22) |
| (c) IND | |||
| RR10 at 1.5 °C | 4.3 (2.0/10.0) | 4.3 (2.0/9.9) | 5.7 (2.6/13.1) |
| RR10 at 2.0 °C | 17.9 (4.1/269) | 17.9 (4.0/268) | 25.3 (5.4/354) |
| RR2.0/RR1.5 | 4.1 (2.0/27) | 4.1 (2.0/27) | 4.4 (2.0/27) |
Table 2 presents the range of estimates of RRREDISTRIBUTION and RR∆POPN for the various regions of interest. Results reveal that statistically significant increases in exposure to heat extremes occurs for the SAEA region as a whole, with best-guess (ensemble median) estimates of RRREDISTRIBUTION of 1.09 (1.03–1.12) after 1.5 °C of warming, and best-guess estimates exceeding 1.2 for a 2.0 °C-warmer world. This result can be explained by the fact that those locations where future population growth (decline) is most significant (figure 3) also preferentially align with the regions of substantially higher (lower) risk ratios in the future (figures 1(e)–(f)). Estimates of RRREDISTRIBUTION are also robust irrespective of whether an SSP1 or SSP2 scenario is considered—a result which is surprising given some of the large regional differences in population change. The approximate doubling in RRREDISTRIBUTION after 2.0 °C of warming relative to the 1.5 °C experiment reflects the non-linear changes in heat extremes which occur at the higher warming level—this acceleration of risk ratios in fast-emerging locations will further exacerbate the relative impact of a higher population fraction living there in the future.
Table 2. Same as for table 1, but instead of showing absolute risk ratios, answers have been separated to show the increase in risk of extreme heat attributable to changes in where people live (RRREDISTRIBUTION) and to changes in the overall size of the relevant population grouping (RR∆POPN). See main text for details of the relevant methodology.
| SSP1–2090 | SSP2–2090 | |||
|---|---|---|---|---|
| (a) SAEA | RRREDISTRIBUTION | RR∆POPN | RRREDISTRIBUTION | RR∆POPN |
| 1.5 °C world | 1.08 (1.03/1.11) | 0.981 | 1.10 (1.04/1.12) | 1.283 |
| 2.0 °C world | 1.20 (1.06/1.30) | 1.25 (1.12/1.34) | ||
| (b) EAF | ||||
| 1.5 °C world | 0.92 (0.87/0.96) | 1.814 | 0.92 (0.89/0.94) | 2.509 |
| 2.0 °C world | 0.83 (0.75/0.96) | 0.83 (0.75/0.93) | ||
| (c) IND | ||||
| 1.5 °C world | 1.00 (0.98/1.02) | 0.995 | 1.01 (1.00/1.03) | 1.313 |
| 2.0 °C world | 1.00 (1.00/1.06) | 1.06 (1.00/1.10) | ||
When considering the smaller sub-regions, we find negligible changes in risk ratios over India associated with the redistribution of where people live—this is unsurprising however, since population density is extremely high across the entirety of the region. Instead, the added increases in risk ratio in table 1 under SSP2 are the direct result of increases in total population size (RR∆POPN). By contrast, there is actually a robust decrease in population exposure to heat extremes associated with changes to where people live for the EAF region, with best-guess estimates of an 8% and 17% reduction in heat exposure after 1.5 °C and 2.0 °C of warming, respectively. This effect therefore helps to mitigate some of the impact of 80% and 150% population increases expected for the region under SSP1 and SSP2 scenarios (respectively). However, as table 1 reveals, the net effect is still that of exposure to higher-than-average risk ratios being observed for the EAF region.
4. Discussion and limitations
While certainly not the only manifestation of climate change under a 1.5 °C and 2.0 °C scenario (Schleussner et al 2016a), heat extremes are the events where we see the strongest impact of climate change, are the key determinant in changing rates of heat stress incidence (Pal and Eltahir 2016, Mora et al 2017, Li et al 2018), and the only extreme where climate change is making previously rare events more likely by orders of magnitude (Christidis and Stott 2013, King and Karoly 2017, King et al 2017, Lewis et al 2017). Though the patterns of change to heat extremes are not the same worldwide, all regions do show the same first-order response, with monotonic increases in both frequency and severity occurring everywhere under future warming scenarios (figure 1). However, future population changes can be dramatically different depending on the location considered (figure 3): for the densely populated SAEA region, there are widespread decreases in population predicted over China, South-east and Central Asia, while regions across Eastern Africa continue to witness as much as a doubling in population over the same period. These regional patterns of population decrease and increase happen to align, respectively, with regions which experience slower-than-average and faster-than-average changes in the emergence of heat extremes.
As a direct consequence of this redistribution effect, population exposure to worsening heat extremes can increase by as much as 30% under 2.0 °C of global-mean warming, with non-trivial impacts also detectable for smaller sub-regions. The effect of changing population dynamics further compounds the already-significant increases in extreme heat exposure expected due to warming only. Therefore, while restricting global-mean warming to 1.5 °C instead of 2.0 °C can reduce the exposure by a factor of five over some of the most vulnerable regions, regional decision makers would further benefit from policies to ensure future population changes are compatible with an SSP1 scenario. Further research is also needed to understand how these patterns of heat exposure are compounded by the anticipated increases in urbanisation rates worldwide (Jiang and O'Neill 2017), particularly in terms of urban heat island impacts.
This analysis uses a very large ensemble of atmosphere-only model simulations, thereby enabling a more complete characterisation of internal climate variability and hence more accurate estimates of temperature distribution tails. However, there are limitations implicit with employing only a single type of climate model, and the uncertainty bounds presented in this analysis may therefore underestimate the 'true' range of uncertainty (Bellprat and Doblas-Reyes 2016). It is worth noting though that the spatial aggregation techniques applied in this study should render such discrepancies to be less relevant to the overall results, particularly when compared to studies on specific regions. Further, compared to other large-ensemble GCM simulations, HadAM3P exhibits a climate response to warming that is on the lower end of the spectrum (e.g. Philip et al 2017, van Oldenborgh et al 2018) so estimates given here are likely conservative. Nevertheless, future work will benefit from replicating these results using super-ensembles of multiple other high-resolution regional climate models.
5. Summary
Stakeholders and policy makers require information on changing risks today and in the future. Understanding changes in the severity of extreme heat in response to 1.5 °C and 2.0 °C of warming is an important part of future risk assessments, both for global and regional decision makers—however, the hazard is only one of three drivers of risk (Pachauri et al 2014). Exposure, and thus the role of future changes to population, often remains overlooked or assessed independently of the hazard on different scales, preventing risk estimation on the scales that decisions are made on.
The results presented in this analysis disaggregates large-scale patterns of change in the climate system from changes in patterns of population growth. This study also improves upon previous methods of quantifying population exposure to future heat (Jones et al 2015, Liu et al 2017), by combining techniques previously developed to (1) quantify probabilistic changes to climatic extremes (Stott et al 2004, Otto 2016, Stott 2016) and (2) better characterise localised changes across multiple regions, through the use of spatial aggregation (Fischer et al 2013). The combination of changes in the hazard (extreme heat) with changes in exposure allow for a more comprehensive assessment of future risks. By understanding what differences in heat exposure may emerge in a 1.5 °C or 2.0 °C world, and the influence of different population scenarios compatible with the Paris Agreement targets, decision makers can begin to resolve the minimum adaptation measures which will be necessary even in the case of successful mitigation policies.
While local adaptation planners might be primarily be interested in how the patterns of heat extremes align with changes in population over their immediate community, it is equally important for decision makers to recognise the broader implications of heat exposure increases driven by future changes in where people live. Such patterns may lead to higher-than-anticipated impacts from extreme heat, including greater food insecurity for vulnerable countries (Lobell et al 2011, Liu et al 2016, Asseng et al 2015, Zhao et al 2017, Lobell and Asseng 2017), increases in excess-heat mortality rates (Mitchell et al 2016a, Gasparrini et al 2015, 2017, Mora et al 2017, Watts et al 2017a, 2017b), and the potential for higher rates of emigration from the most severely-affected regions (Reuveny 2007, Black et al 2011b, 2011a, Gemenne et al 2014, Lister 2014, Watts et al 2017a, 2017b).
Acknowledgments
We would like to thank our colleagues at the Oxford eResearch Centre: A Bowery, S Li, M Rashid, S Sparrow and D Wallom for their technical expertise. We would like to thank the Met Office Hadley Centre PRECIS team for their technical and scientific support for the development and application of Weather@Home. Finally, we would like to thank all of the volunteers who have donated their computing time to climateprediction.net and Weather@Home.