


Abstract
Woodfuels constitute nearly 80% of Haiti's primary energy supply. Forests are severely degraded and the nation has long been considered an archetypal case of woodfuel-driven deforestation. However, there is little empirical evidence that woodfuel demand directly contributes to deforestation, but may contribute to degradation. We use MoFuSS (Modeling Fuelwood Sustainability Scenarios), a dynamic landscape model, to assess whether current woodfuel demand is as impactful as it is often depicted by simulating changes in land cover that would result if current demand continues unabated. We also simulate several near-term interventions focused on woodfuel demand reduction to analyze the land cover impacts of different energy trajectories. We find that current demand may contribute to moderate levels of degradation, but it is not as severe as is typically portrayed. Under a business-as-usual scenario, the simulated regenerative capacity of woody biomass is insufficient to meet Haiti's increasing demand for wood energy and, as a result, between 2017 and 2027 stocks of above-ground (woody) biomass could decline by 4% ± 1%. This is an annual loss of 302 ± 29 kton of wood and would emit 555 ± 54 kton CO2 yr−1. Aggressive interventions to reduce woodfuel demand could slow or even reverse woodfuel-driven degradation, allowing woody biomass to recover in some regions. We discuss the policy implications and propose steps to reduce uncertainty and validate the model.
Export citation and abstract BibTeX RIS

Original content from this work may be used under the terms of the Creative Commons Attribution 3.0 licence.
Any further distribution of this work must maintain attribution to the author(s) and the title of the work, journal citation and DOI.
1. Introduction
This study examines woodfuel supply-demand dynamics in Haiti and explores the implications of several near-term household energy pathways for the small island nation. Fuelwood and charcoal represent nearly 80% of the country's primary energy supply [1]. Haiti has long been considered an archetypal case of woodfuel-driven deforestation [2, 3] and popular environmental media have perpetuated this narrative [4–7]. Official reports of forest cover in the country reinforce the notion that Haiti's tree cover is under extreme stress, and that the country has very little forest remaining [8–10]. However, more recent analyses have raised questions about the accuracy of these assessments. For example, by examining higher resolution images that better capture the patchiness of Haiti's existing tree cover, Churches and colleagues find that forest cover in Haiti could exceed 30% [11], and other analyses support these findings [12, 13]. Recent analyses also indicate that the woody biomass utilized as feedstock for charcoal originates from coppice-based agroforestry systems rather than unmanaged woodlands [14, 15]. These systems are fairly resilient and may represent a sustainable approach to woodfuel provision [16].
While these recent findings encourage us to rethink popular narratives of Haiti's forest cover and the oft-repeated link between Haiti's charcoal industry and deforestation, analysts still stress that Haiti's forests have been, and remain, severely degraded [11, 14]. Moreover, in the absence of interventions, demand for woodfuels will likely increase, driven by rapid urbanization, which is often accompanied by a shift in residential energy use from fuelwood to charcoal, and a lack of investment in alternative sources of energy [17]. The impacts of increasing demand remain uncertain, and may extend beyond Haiti's borders. For example, numerous sources note that large volumes of Haiti's charcoal originate from the Dominican Republic (DR) [18, 19], which has recently experienced high rates of forest loss [20].
Thus, although the condition of Haiti's forest cover may not be as dire as some analyses have portrayed, there is reason for concern as Haitians attempt to meet their growing demand for energy while avoiding additional forest degradation within their own borders and beyond. Interventions reducing woodfuel demand have been shown to support regeneration in degraded landscapes elsewhere [21]. A set of detailed simulations could indicate where impacts of additional woodfuel demand are likely to be felt, and whether interventions are likely to reduce future impacts. Here we present the results of a study, commissioned by the Global Alliance for Clean Cookstoves (GACC), with financial support from Global Affairs Canada. The analysis contributes to the literature on land use change in Haiti and informs environmental decision-making in the island nation. There are two main objectives:
- 1.Develop a spatial database to quantify the fraction of non-renewable biomass (fNRB) harvesting attributable to woodfuel demand and identify 'high risk areas' where the current or future sustainability of biomass resource exploitation would be particularly at risk.
- 2.Develop a series of scenarios examining the potential impacts of Haiti's future charcoal demand. The scenarios simulate how different interventions focused on demand reduction could affect woody biomass and influence fraction of non-renewable biomass (fNRB) throughout the country.
2. Background on charcoal and deforestation in Haiti
Land cover change in Haiti can be traced to the colonial era. Through the 17th and 18th centuries, the French established a slave-based plantation economy that dramatically modified the landscape [22–24]. Hardwood forests were cleared from Haiti's lowland alluvial plains and nearby mountains. Some wood was exported to France and the rest used to meet Haiti's needs for timber and fuel, particularly in the sugar refineries that drove the island's early economy [25]. In the 19th century, a negotiated war indemnity with France was funded through vast timber concessions and settlements across the countryside [15, 26]. In the early 20th century, US Marines occupied Haiti (1919–1934), and expanded bridges and roads into previously isolated parts of the country [14, 27]. Not long after, the US State Department noted there were virtually no commercially valuable timber species left in Haiti [28].
It was around that time that references to charcoal in Haiti begin to appear, after much of Haiti's original forest was cleared [15]. Charcoal demand grew through the 20th century, in tandem with the country's urban population, which was facilitated by the US-built infrastructure [29]. Charcoal for Port-au-Prince was initially produced from dry forests or arboreal fallows around the city. However, over time, fallow periods were shortened or eliminated altogether [30]. Over time, traditional woodlot systems surrounding Port-au-Prince were over-exploited, and production shifted toward the island of La Gonâve, then the northwestern peninsula, and later to the southern peninsula and central plateau [3, 12, 31, 32]. One assessment suggests that by 1980, only 5% of charcoal consumed in Port-au-Prince came from nearby the capital, while the rest came from central Haiti, La Gônave, and the northwestern and southern peninsulas [3]. During that time, many analyses concluded that woodfuel-dependent countries were in 'crisis' [33, 34], including Haiti. One analysis predicted wood supplies would eventually face environmental 'apocalypse' [3]. However, the envisioned 'apocalypse' hasn't occurred and Haitians continue to meet their wood and charcoal demand.
Today, Haiti's charcoal is produced primarily in woodlot systems that are common throughout the countryside. The woodlots contain small, young trees, or coppice from larger tree stumps, with densities ranging from open stands to impenetrable thickets. They are managed on 3–7 year rotations with a combination of active and passive measures. Evidence suggests that this type of coppice system can support a consistent yield for many rotations [15, 16]. Nevertheless, these systems may be degraded if they are harvested at a rate that exceeds their regenerative capacity.
It is important to distinguish between deforestation, which is 'the long-term or permanent loss of forest cover and implies transformation into another land use' and degradation, which is 'the long-term reduction of the overall potential supply of benefits from the forest,' [35, pp 8 and 10]. When deforestation occurs, land cover and land use change from forest to non-forest. This can be visibly detected by remote sensing, but is rarely driven by woodfuel demand [36, 37]. In contrast, forest or landscape degradation is not associated with easily observed land use/land cover change. This analysis simulates degradation by modeling losses in above-ground (woody) biomass or AGB.
3. Methods
3.1. Modeling
Our methodological approach applies spatiotemporal analysis and modeling techniques to publically available data for the entire country utilizing a platform called Modeling Fuelwood Savings Scenarios (MoFuSS—v1.0). The model is an open access platform that is designed to be used by any interested researchers. It consists of several freely available software packages bundled together. Appendix A consists of detailed instructions for downloading, installing and running MoFuSS for any test area within the country of Haiti, with parameters that are tunable through a user-friendly interface; default values correspond to those used in the present study. Beyond reproducing results presented in this study, third party users can open, edit and save all scripts. The model's basic architecture and parameterization are described in a previous publication [38]; hence, we do not provide a detailed description here. However, the model was adapted to accommodate Haiti's specific circumstances, which we discuss below. Table S1 in the supplementary material available at stacks.iop.org/ERL/13/035007/mmedia lists all inputs used in this analysis.
3.2. Definitions of model's key output parameters
We assume changes in AGB during a given time period are a function of four factors: stock remaining after the previous iteration, the maximum growth rate (rmax: the first derivative of a logistic 'S-type' growth curve), maximum biomass density or 'carrying capacity' (K), and consumption during that time period C(t) [38]. Equation (1) describes this relationship:
AGB(t)i and AGB(t+1)i are above ground woody biomass suitable for fuelwood in pixel 'i', at time 't' and 't + 1' respectively. The term ' ' defines the annual increment of woody biomass; this is always positive, but asymptotically approaches zero as AGB approaches K. C(t)i is woodfuel harvesting that occurs in pixel 'i' during time-step 't'. Note AGB may increase or decrease from one time-step to the next depending on the relative magnitudes of C(t)i and
  .
.
The factors rmax and K vary with land use/land cover (LULC) categories. In reality they depend on biophysical parameters such as soil, hydrology, insolation, and altitude. Detailed data for these growth parameters is rarely available, particularly in data-poor locations such as Haiti. Lacking empirical data, we define K and rmax based on LULC classifications, matched with empirical data from other locations. These are listed for each LULC class in table S2 of the supplementary material.
Non-renewable biomass (NRB) is the amount of harvested wood that exceeds natural re-growth over a given time period. In this approach, NRB is defined only in the pixels where AGB declines over time. The ratio of NRB to total woodfuel consumption indicates the fNRB, which indicates the unsustainable proportion of harvested wood.
The model iterates a series of time steps (t) with n-steps per simulation. In this study, t = 1 year and n = 24 years. There are three primary outputs at each time step: (a) AGBt, (b) NRBt (equation 2), and (c) fNRBt, also defined in pixels where decreases in AGB have occurred. For each pixel at time t:
where NRB(t) is the amount of fuelwood in tons of dry matter (tDM) which, when harvested, results in a net decrease in AGB between time t = 0 and t.
To accommodate uncertainty, the analysis consists of multiple Monte Carlo (MC) simulations (see supplementary material for details). Each MC run generates a different value of NRB(t = n) by repeating equation 2. NRB(t = n) is calculated at the pixel-level; it does not account for any increment of AGB occurring in areas where AGB(t = n) ≥ AGB(t = 0). In other words, NRB(t = n) is defined by AGB loss in pixels where losses occur and are attributable to woodfuel demand. fNRB is calculated as:
where C is total residential fuelwood consumption in tDM in time step 't'. C is input at each iteration so in order to simulate spatio-temporal changes in fuelwood use, which may linked to population growth, demographic change, or energy transitions like the adoption of efficient stoves or alternative fuels.
3.3. Demand
Haiti's residential woodfuel demand was simulated by assigning fractions of different types of cooking fuels utilized in Haitian households based on 2003 census data [39] to a 2003 gridded map of population distribution [40]. Figure S2 shows gridded distribution of population using different types of household fuels, either alone or in combination. Census data indicate the prevalence of woodfuels, but not the quantity used, which is essential to model demand. Per capita charcoal and fuelwood consumption was assumed to be 0.46 and 1.50 kg person day−1 respectively based on a 2007 World Bank report citing older data [19 citing, 41 and 42]. These were used to create a gridded map of combined fuelwood and charcoal demand in 2003 (figure S3 shows a map of aggregate demand in 2003).
Charcoal demand was then converted to dry wood equivalent, assuming an average dry mass yield of 20% (5 tons of dry wood to produce 1 ton of charcoal). This is a typical yield from traditional earthen kilns in many locations around the world [43].
The 2003 census indicates that about 20% of the population used a combination of fuels rather than a single type of fuel—e.g. charcoal with fuelwood or fuelwood with LPG [39]. For these households, we assumed consumption of either charcoal or fuelwood was half that of households using those fuels alone5.
3.4. Supply
Wood supply is a function of the quantity and accessibility of woody AGB [38]. Sustainability of the harvest depends on wood productivity. For this assessment, the productivity of woody biomass was based on the most recently available LULC data for Haiti, which provided spatially explicit land cover categories. Each category was then assigned a value for K and rmax as described above. Figure S4 shows the LULC categories used in the analyses. In addition, based on observations in other woodfuel-dependent regions [45], we assume trees outside forests (TOF) provide a sizable fraction of supply, particularly for self-gathered demand, This includes trees on farmland, household compounds, and roadside commons. This wood is accessed by pruning live trees and/or collecting dead/downed branches and is assumed to provide a fixed increment of sustainable supply (up to the value of K defined in table S2). In each locality, the model first utilizes these sources to meet demand, but turns to other sources if demand exceeds the quantity that TOF can supply (see [38] for a full description).
Finally, because a large fraction of harvested wood is utilized for charcoal, the spatial model will be more accurate if it is 'tuned' to make production more likely in today's charcoal producing regions. To do this, the authors carried out a literature review and expert consultation to identify known areas where production is concentrated (see the discussion and figures S5(a)–(b) and S6 in supplemental materials).
3.5. Integration of supply and demand
In order to relate woodfuel consumption at specific points in space and time to supply sites, we project fuelwood and charcoal harvest events based on geographic accessibility, which is a function of proximity to populated areas, transport infrastructure (including transport by boat)6, land cover, and elevation (see [38] for a full description). All locations, whether harvested or not, can accumulate woody biomass (as described in equation 1). If AGB stocks in one location are excessively diminished in one time-step, that location is less likely to be harvested in subsequent time steps until stocks recover. We selected 2003 as the base year of the simulation to align with available demographic data. AGB stocks for 2003, based on LULC categories and forest cover data, are mapped in figure S7. Integrating potential woodfuel supply and demand results in a mapping of harvest pressure for both commercial and self-gathered demand (discussed in more detail in supplemental materials and mapped in figures S8 and S9).
3.6. Scenarios
Scenarios were developed in collaboration with the GACC Haiti team and divided into primarily urban and rural interventions. Scenarios 1–3 project the impacts of large fractions of the urban population shifting away from cooking with solid fuels in traditional devices to either LPG or continuing to use solid fuels, but adopting more efficient stoves (urb_1–3). Scenarios 5–9 focus on rural populations (rur_1–5). Scenarios rur_1–4 mirror the urban transition LPG and ICS. Scenario rur_5 follows a similar pattern but involves a change to non-woody biomass like pellets or briquettes. A final scenario maintains the 'BAU' fuel mix, but examines the impacts of widespread use of efficient charcoal kilns (kiln). The transitions are summarized in table 1 below.
Table 1. Scenario characteristics describing potential transitions.
| Name | Description—between 2017 and 2027... | Woodfuel users adopting LPG | Woodfuel users adopting ICS | Woodfuel users adopting briquettes or pellets | % of charcoal produced in improved kilns | No change |
|---|---|---|---|---|---|---|
| urb_1 | A fraction of urban woodfuel users shift to LPG and improved charcoal stoves | 70% | 20% | 0% | 0% | 10% |
| urb_2 | 50% | 20% | 0% | 0% | 30% | |
| urb_3 | 25% | 50% | 0% | 0% | 25% | |
| rur_1 | Same as s_1a, but in rural areas | 70% | 20% | 0% | 0% | 10% |
| rur_2 | A fraction of rural woodfuel users shift to LPG and improved wood and charcoal stoves | 30% | 40% | 0% | 0% | 30% |
| rur_3 | 10% | 60% | 0% | 0% | 30% | |
| rur_4 | 30% of rural woodfuel users adopt LPG and 40% briquettes or pellet fuels | 30% | 0% | 40% | 0% | 30% |
| rur_5 | 10% of rural fuelwood users adopt LPG and 60% adopt improved woodstoves; no change in charcoal use | 10% | 60% | 0% | 0% | 30% |
| kiln | No change in household fuel but 50% penetration of improved charcoal kilns | 0% | 0% | 0% | 50% | 50% |
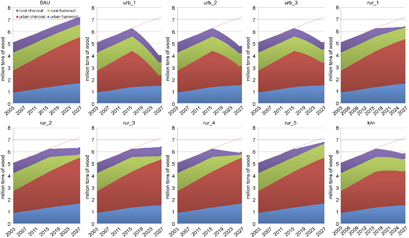
Figure 1. Wood demand under each scenario (codes and assumptions are given in table 1).
Download figure:
Standard image High-resolution image
Figure 2. AGB, NRB, fNRB and total fuelwood use between BAU (a), urb_1 (b), and rur_1 (c). Note: red lines were generated using the average of each key input parameters described in supplemental materials. Light grey lines were generated in 50 MC iterations with input parameters varying according to probability distributions (also described in supplemental materials).
Download figure:
Standard image High-resolution imageWe make the following assumptions for each scenario:
- The scenarios cover 2003–2027 and are presented as gridded data disaggregated across Haiti's 570 communes.
- Population growth is the same under all scenarios and defined by UN population projections (table S3).
- Interventions achieve their targets by growing linearly between from 2017 and 2026 and are applied in proportion to population in all locations.
- The improved charcoal stove reduces fuel demand by roughly 53% when using lump charcoal and 47% when using briquettes or pellets based on different calorific values of the two fuels.
- Briquettes and pellets are derived entirely from agricultural waste and has no impact on land cover.
- Improved charcoal kilns result improve conversion efficiency by 100% (we assume traditional earth-mound kilns are ∼20% efficient and improved retort kilns introduced are 40% efficient)7.
The scenarios result in wood demand reductions ranging from 4% (rur_5) to 60% (urb_1). Demand trajectories disaggregated by location and fuel type are shown in figure 1. Urban-focused scenarios have a larger impact on wood demand than rural scenarios because urban interventions reach larger populations and affect higher proportions of charcoal users.
Several scenarios show an uptick in wood demand between 2026 and 2027 because the interventions are implemented over a 10 year period from 2017–2026. Thus, while technologies remain in use, the adoption of new technology ceases to grow in the final year of the simulation and increases in demand due to population growth are no longer offset. This leads to a small increase in demand in that final year, which would continue if we extended the scenarios further into the future with no new interventions.
4. Results
Figure 2 compares results from the BAU, urb_1 and rur_1 simulations. Bold red lines show how AGB, NRB, fNRB, and fuelwood demand evolve when mean values for key parameters are used; light gray lines show results for iterations of the 50 Monte Carlo simulations. This discussion focuses mainly on urb_1 because it represents the most extreme reduction in woodfuel demand (figure 1). Results of other scenarios are shown in table S4 and figure S10. The initial high value and steep drop in NRB and fNRB between 2003 and 2005 are artifacts of the model parameterization and do not reflect actual conditions.
Our results indicate that under BAU conditions, woodfuel demand leads to the cumulative harvest of 13–19 million tons of NRB over the simulation period, leading to a loss of 3%–20% of AGB, which is apparent by the downward trend in AGB shown in figure 2(a) (top left). Overall demand for woodfuel during the simulation varies from 130–150 million tons, resulting in fNRB of 12% ± 2% (mean ± standard deviation). Under scenario urb_1, annual woodfuel demand drops to 44% of BAU by 2027. This leads to a 6%–11% decrease in cumulative wood harvest over the entire simulation period, 41% reduction in cumulative NRB extraction, and a reversal in the loss of AGB, which is evident in the upward trend in AGB in the latter years of the simulation (figure 2(b)). Scenario rur_1, which is similar to scenario urb_1, but implemented in rural areas, has less dramatic results. Figures 3 and 4 show maps of AGB, NRB and fNRB for BAU and urb_1 respectively.
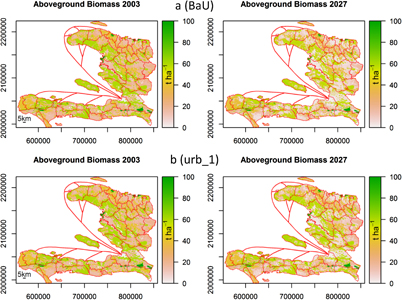
Figure 3. Changes in spatial distributions of AGB between 2003 and 2027 in the BAU and urb_1 scenarios. Lines show probable routes by which charcoal is brought to Port-au-Prince by boat8. Like urb_1, scenarios urb_2 and urb_3 also focus on urban areas, but involve more modest interventions and are result in lower reductions of NRB harvest. Scenarios rur_1–4 focus on demand in rural areas, where fuelwood use is more prevalent than charcoal. These also result in smaller improvements relative to urb_1, because rural demand is smaller and more dispersed than in urban regions. Scenario 'kiln' focuses equally on rural and urban regions by making charcoal conversion more efficient and reducing overall demand for wood extraction.
Download figure:
Standard image High-resolution imageThe spatial approach is useful because it allows us to identify areas that are likely to feel the greatest impact from future woodfuel demand (maps are shown in figures S11 and S12). The largest NRB extraction is likely to occur in the arrondissements immediately adjacent to Port-au-Prince (Croix-Des-Bouquets and Arcahaie to the north and rural parts of Port-au-Prince to the south). There are also concentrations of NRB extraction in arrondissements further afield, such as Gonaives, Dessaline, and Saint-Marc to the north, as well as the Miragoane and Aquin in the southern peninsula. With urb_1, NRB is still extracted from these regions, but volumes are reduced substantially relative to BAU.
Net impacts of each intervention can be visualized by mapping differences in conditions between the BAU and each scenario in the final year of the intervention. Figures 5 and 6 show the differences in standing AGB and harvested NRB between BAU and urb_1 respectively. Naturally, the largest changes are concentrated in those areas most impacted in the BAU scenario. Figure S13 shows the difference in NRB off take for all scenarios. Reductions in the amount of NRB harvested result in downward shift of fNRB from 9%–6% by 2027. Figure 7 illustrates the spatial distribution of changes in fNRB between BAU and urb_1.
5. Discussion and conclusions
Our simulations show that under a reasonable set of assumptions about woody biomass growth and harvest, Haiti will likely experience levels of fNRB that are much lower than other assessments report [50]. These results support recent analyses that argue for a less alarmist view of the relationship between deforestation and woodfuel demand in Haiti. Nevertheless, we do find that under a business-as-usual (BAU) scenario, the estimated regenerative capacity of existing woody biomass resources is insufficient to fully satisfy Haiti's increasing demand for wood energy without additional degradation of standing biomass. This will result in the annual loss of 302 ± 29 kton of AGB (mean ± 95% confidence interval) and emit 555 ± 54 kton of CO2 yr−1 over the next decade. These impacts would be lessened if interventions to reduce woodfuel demand were successfully implemented. Interventions result in different levels of mitigation depending on the intensity of effort. Generally, scenarios focused on urban consumers are more effective than scenarios focused on rural consumers, with the exception of rur_4, which simulates the impact of rural households undergoing a large-scale shift away from both wood and charcoal. Under the most aggressive scenarios (urb_1–3 and rur_4), degradation could actually be reversed, allowing AGB stocks to recover slightly by the end of the simulation. Scenarios targeting rural households result in smaller changes and may lead to little or no improvement at a national scale (e.g. scenarios rur_1–3 and 5 shown in figure S11).
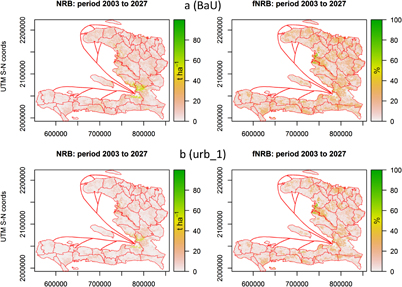
Figure 4. Cumulative NRB extraction (left) and overall fNRB (right) in BAU (top) and urb_1 (bottom).
Download figure:
Standard image High-resolution image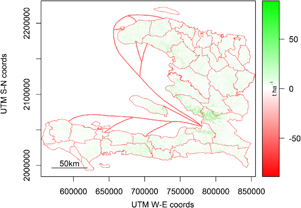
Figure 5. Difference in AGB remaining in 2027 between BAU and urb_1 (first MC realization only).
Download figure:
Standard image High-resolution image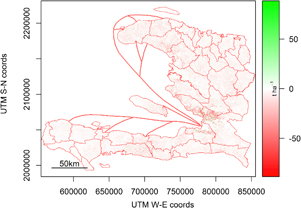
Figure 6. Difference in total NRB harvested between BAU and urb_1 during the simulation period (first MC realization only).
Download figure:
Standard image High-resolution image
Figure 7. Relative changes in fNRB between BAU and urb_1 scenarios at the end of the simulation period (first MC realization only).
Download figure:
Standard image High-resolution image
Of course, the input parameters utilized in this preliminary exploration carry large uncertainties. Some of the uncertainty, like biomass stock and growth, are explicitly included via the MC simulations and are explicit in the range of uncertainty shown in our results (table S4 and figure S13). However, other sources of uncertainty are omitted from the analysis because data is simply not available. For example, anecdotal evidence indicates that there is some flow of charcoal between Haiti and neighboring DR. If sufficiently large, this flow would affect the results of this analysis by transferring pressure on woody biomass across the border. If data were available, this trade could easily be modeled; however, it was omitted because there is simply no credible estimate of the magnitude or exact destination of charcoal coming from DR to Haiti. Other sources of uncertainty include commercial and industrial demand for woodfuels. If demand from these sectors is sufficiently large and growing at a similar rate as residential demand, it would increase pressure on Haiti's woody biomass and lessen the impact of interventions limited to the residential sector. In addition, other factors like extreme weather events, which are difficult to model, can play an important role in land cover change and woody biomass supply. For example, Hurricane Matthew devastated Haiti's southern peninsula in 2016. That year, tree cover loss on the peninsula was 1200% higher than the annual average over the previous decade [20]. While it hasn't been studied in detail, anecdotal evidence indicates that trees felled by the storm were used for charcoal [51].
Last, it is important to recognize the role that charcoal plays in the Haitian economy. Data is limited, but one source notes that charcoal was responsible for 16% of rural income in the 1990s [19]. Any policies designed to reduce demand for charcoal should also implement measured to avoid negative impacts on rural livelihoods that such policies could have.
6. Future research
The authors are currently securing funding to implement a more in-depth study, including fieldwork intended to reduce the uncertainties in key inputs described above. For example, to reduce uncertainty in supply parameters, we intend to improve our characterization of the coppice-based agroforestry systems that are thought to contribute much of the country's charcoal feedstock through field-based assessments of on-farm tree growth and management practices. Better understanding of current production would open the possibility of first simulating and later designing policies promoting supply enhancement through intensive agro-forestry or silvicultural interventions.
Future plans also include developing new, supervised land cover classification in order to improve assessments of Haiti's current and future supply of woody biomass. In addition, to further refine the model's supply parameters, we intend to investigate the magnitude of Haiti's cross-border charcoal trade with DR and work with other researchers to obtain updated sector-specific woodfuel consumption data.
Finally, when modeling policy interventions, it is common practice to test the validity of models by running simulations that begin in the past and end in the near future. This allows for comparison of mid-point results of the simulations to current data. However, simulations may predict small changes in land cover that are not discernable from low- to medium-resolution satellite imagery. Thus, either field work or access to very high resolution images are needed for validation ([19], citing the results of a 1995 survey). In the next phase of research, the authors will use remote sensing techniques to quantify forest degradation in 'hotspots' forecast by the model (i.e. places where the model predicts significant degradation from woodfuel harvesting).
Acknowledgments
This work was supported by the Global Alliance for Clean Cookstoves (grant no. PR-16–40691), with funds originating from Global Affairs Canada. The authors declare no conflicts of interest.
Footnotes
- 5
The 2003 census lacked data on households using charcoal in combination with LPG; however, we assumed that it was ∼6% of the population which matched a later dataset [e.g. 44].
- 6
Historical sources note that transport of firewood and charcoal to Port au Prince was common [46]. While these refer to past observations, one author (AT) notes that this method of transport is still common at the time of writing.
- 7
- 8
Boat routes are based on previous maps of sea routes for charcoal arriving in Port au Prince [43].