

Abstract
To meet the growing demand for food, land is being managed to be more productive using agricultural intensification practices, such as the use of irrigation. Understanding the specific environmental impacts of irrigation is a critical part of using it as a sustainable way to provide food security. However, our knowledge of irrigation effects on climate is still limited to daytime effects. This is a critical issue to define the effects of irrigation on warming related to greenhouse gases (GHGs). This study shows that irrigation led to an increasing temperature (0.002 °C year−1) by enhancing nighttime warming (0.009 °C year−1) more than daytime cooling (−0.007 °C year−1) during the dry season from 1961–2004 over the North China Plain (NCP), which is one of largest irrigated areas in the world. By implementing irrigation processes in regional climate model simulations, the consistent warming effect of irrigation on nighttime temperatures over the NCP was shown to match observations. The intensive nocturnal warming is attributed to energy storage in the wetter soil during the daytime, which contributed to the nighttime surface warming. Our results suggest that irrigation could locally amplify the warming related to GHGs, and this effect should be taken into account in future climate change projections.
Export citation and abstract BibTeX RIS

Original content from this work may be used under the terms of the Creative Commons Attribution 3.0 licence.
Any further distribution of this work must maintain attribution to the author(s) and the title of the work, journal citation and DOI.
1. Introduction
Global food demand will continue to increase because of growth in population and consumption [1]. Food security is being threatened by greater competition for land, water, climate, and energy [1]. Although cropland areas have increased by only 2.4%, global crop production grew 28% between 1985 and 2005 [2]. The increase in production has occurred because land is being managed to be more productive using agricultural intensification practices such as irrigation, fertilizers, and double cropping [2−4]. Irrigation plays an essential role in global food security as irrigated agriculture provides approximately 40% of world food production [5]. Without irrigation, global cereal production would decrease by approximately 20% [3]. The area of irrigated cropland has nearly doubled during the past 50 years [2]. We gain benefits from this type of agricultural intensification. However, irrigation has also caused water degradation, increased energy use, and climatic impacts [2, 5−8]. We are facing the challenge of meeting a growing food demand while reducing the environmental impact of agriculture [2].

Figure 1. Summary of the observational studies focusing on the irrigation impact on temperature. The area equipped for irrigation around the year 2005 expressed as a percentage of total area (irrigation fraction) [20] is shown in the map. The boxes indicate the research regions of previous observational studies. References and results are summarized in this map.
Download figure:
Standard image High-resolution image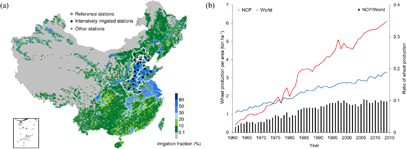
Figure 2. Irrigation fractions, meteorological stations, and wheat productivity over the NCP. (a) Map of the area equipped for irrigation around the year 2005 expressed as a percentage of the total area. Locations of the meteorological stations over the NCP are shown in this map. (b) Wheat production per area of the NCP and the world, and the ratio of wheat production over the NCP to the world total from 1961–2014.
Download figure:
Standard image High-resolution imageA well-known climatic impact of irrigation is the change in surface energy partitioning [9, 10]. This impact is accompanied by a decrease in surface air temperatures, which typically affects the diurnal maximum [10]. Observational and modeling studies have demonstrated the cooling effects of irrigation [8, 10−12], which are consistent reductions in daily and extreme maximum temperatures [5, 10, 13], even though the magnitude of irrigation cooling was different between studies. Occasionally, individual studies have hypothesized that this irrigation cooling effect could mask regional effects of global warming due to greenhouse gas (GHG) emissions [9, 10]. However, the effect of irrigation on minimum (nighttime) temperatures is still highly uncertain [5, 14−19] (figure 1). Although the cooling effect of irrigation could reduce warming, this negative impact of irrigation primarily occurs in daytime. Regardless, GHGs tend to increase nighttime temperatures by trapping and reradiating energy from the Earth's surface. Therefore, to ensure that irrigation is a sustainable way to enhance food productivity and mitigate warming related to GHGs, we should have a comprehensive assessment of irrigation effects on temperature over the course of a day.
China feeds 22% of the world's population using only 7% of the world's available arable land [21]. China has one of the largest irrigated areas across the globe [22] (figures 1 and 2(a)). In particular, the North China Plain (NCP) is a large irrigated area, where irrigation is an indispensable water supplement that maintains crop growth and improves the product [23]. Partly because of the irrigation, the productivity of the NCP is almost twice that of the world average (figure 2(b)). Moreover, the NCP produces approximately 10% of the total global wheat output (figure 2(b)) and feeds 22% of China's population [4]. Consequently, agricultural activity over the NCP has strong implications for global food security. In contrast to the food production benefits, irrigation practices have led to noticeable environmental problems such as a decrease in terrestrial water storage over the NCP [6, 23, 24] (online supplementary figure S1 available at stacks.iop.org/ERL/13/024005/mmedia). Additionally, recent climate records show a significant increase in temperatures over the NCP during the dry season [25]. Thus, changes in the surface energy balance induced by irrigation could either manifest as a decrease or increase in regional warming related to GHGs. This study aims to investigate whether irrigation can mask GHG warming over the NCP using observation and a climate model, with a particular focus on the effect of irrigation on nighttime temperatures.
Here, the NCP region is defined as including three provinces (Hebei, Henan, and Shandong) and two municipalities (Beijing and Tianjin). We first examined the time-series of observed daily maximum, minimum, and mean temperatures for the NCP's dry season (i.e. September to May, which is the winter wheat growing season) during the period from 1961–2004. Following the method of Bonfils and Lobell [5], and according to the Global Map of Irrigation Areas [20] (figures 1 and 2(a)), we separated the meteorological stations over the NCP (figure 2(a)) into two groups (intensively irrigated stations with an irrigation fraction >50% and reference stations with an irrigation fraction <10%) and analyzed the temperature differences (ΔT) between the two groups to detect the irrigation impact. Next, we analyzed the relationships between the 43-year trends in the observed daily maximum, minimum, and mean temperatures and the irrigation fractions to find the dependence of the detected irrigation impact on irrigation intensity. Finally, we investigated the mechanism of the irrigation impact on temperatures by performing two runs of the Weather Research and Forecasting (WRF) model with and without irrigation processes, i.e. the control (CNTL) run had no irrigation and the irrigation (IRR) run had irrigation over the NCP.
2. Methods
To evaluate the impact of irrigation on temperature, we used the homogenized observed 2 m air temperature data acquired from the China Meteorological Administration. This data set is based on daily levels and includes the daily maximum, minimum, and mean temperatures, and it was adjusted on the discontinuities which were caused by non-climate changes (such as the changing of observation site, instrumentation and observation environments) [26]. There are 66 meteorological stations over the study area (Beijing, Tianjin, Hebei, Henan, and Shandong; figure 2(a)). However, 13 stations have extended periods of missing data during the study period (1961–2004). In this study, we analyzed the 43-year (1961−2004) observations from 53 stations. According to the Global Map of Irrigation Areas [20], which shows the size of the area equipped for irrigation around the year 2005 expressed as a percentage of the total area (hereafter irrigation fraction (figure 2(a)); with a 5 min resolution, we selected 34 of 53 stations and divided them into two groups as follows. If the station in a grid cell had an irrigation fraction greater than 50%, this station was defined as an intensively irrigated station. If the station in a grid cell had an irrigation fraction less than 10%, it was defined as a reference station. Following this rule, there were 17 intensively irrigated stations and 17 reference stations. In this Global Map of Irrigation Areas, there is an additional map layer that shows the percentage of the area equipped for irrigation that was actually used for irrigation. We checked this additional map, found that this percentage of the area equipped for irrigation that was actually used for irrigation showed little difference between different provinces. For example, the factor for Hebei is about 0.92, for Shandong is about 0.84, and for Henan is about 0.78. The application of these factors will have no significant effect on our results, and for comparison with other studies (previous studies also use the area equipped for irrigation [5, 13]), we do not use this additional map. We analyzed the 43-year change of temperature differences in the daily maximum, minimum, and mean temperatures between the intensively irrigated and reference stations to detect the irrigation effects. Then, we calculated the 43-year daily maximum, minimum, and mean temperatures linear trends for each station, and analyzed the relationships between the trends and the irrigation fractions of each station to find the dependence of the detected irrigation effects on the irrigation intensity.
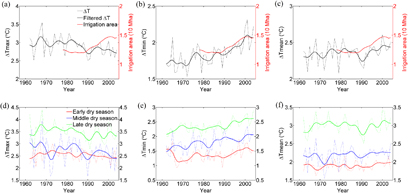
Figure 3. Observed time-series of temperature differences between intensively irrigated and reference stations, and the irrigation area over the NCP. (a)−(c) Temperature differences in daily maximum temperature (a), minimum temperature (b), and mean temperature (c) during the dry season (September−May). (d)−(f) Same as (a)−(c), but for the early dry season (September−November, red color), middle dry season (December−February, blue color), and late dry season (March−May, green color). For a dry season, such as September 1961–May 1962, defined as the dry season of 1962, etc. Unfiltered (dotted lines) and nine-point binomial filtered averages (solid lines) are shown. The irrigation area of the NCP is shown in (a)−(c).
Download figure:
Standard image High-resolution imageTo find the relationship of the 43-year change in temperature differences and the change in irrigation area, we collected the irrigation area data from the National Bureau of Statistics of China. The irrigation area data are at the annual and province level and were available from 1978. We used the total irrigated area of Beijing, Tianjin, Hebei, Henan, and Shandong from 1978–2004.
To show the importance of the NCP to global food security, we collected wheat production and area harvested data from the National Bureau of Statistics of China and the Food and Agriculture Organization of the United Nations. The wheat production and area data for China were at the province level, and we used the total wheat production and area of Beijing, Tianjin, Hebei, Henan, and Shandong.
To show the decrease in terrestrial water storage over the study area, which is related to the groundwater-fed irrigation, we used the Gravity Recovery and Climate Experiment Tellus monthly land water mass grids NetCDF release 5.0 [27] to analyze the seasonal land water storage change over the NCP (31°−39° N, 113°−120° E) from 2003–2014.
The Advanced Research WRF model version 3.8.1 was used to investigate the mechanism of the impact of irrigation on temperatures over the NCP. Two WRF simulations were performed with and without irrigation for the years 2000–2004 using the same initial and lateral boundary conditions from the National Centers for Environmental Prediction operational global final (FNL) analysis data [28]. Owing to the limit of the boundary data (FNL data changed the soil layers in 2005), we performed a five-year simulation, and we think the results would be the same if a longer simulation was performed. Moreover, to avoid the effect of freezing and thawing on temperature, we performed the five-year simulation year by year (each year's simulation is from January to the next February). Our purpose for the model simulation was to observe the mechanisms of irrigation-induced temperature change in the course of a day. We only analyzed the difference of mean pattern between simulations. The model domain was two-way nested with a horizontal resolution of 30 km and 10 km and 30 vertical layers from the surface to 50 hPa. The nested domain covered the NCP. The land use categories were from the 21 class moderate resolution imaging spectroradiometer (MODIS) land use data.
To simulate the irrigation, we implemented an irrigation scheme into the unified Noah land-surface model in the WRF model following Yang et al [29] and Qian et al [30] with certain modifications. This irrigation scheme was already used to investigate the irrigation effects over the Huang-Huai-Hai Plain in China [29] and the southern Great Plains of the USA [30]. The irrigation scheme in this study is briefly described as follows.
- 1.A global map of the area equipped for irrigation [20] around the year 2005 expressed as a percentage of the total area was used. If a grid cell had an irrigation fraction greater than 50% and a MODIS land use type equal to 12 (meaning cropland), this grid cell had the potential to be applied for irrigation under the following conditions.
- 2.At the local time of 6 am on each day, if the mean 0−10 cm soil temperature during the previous 24 h was greater than 5 °C and the relative soil moisture (RSM) in the root zone (root depth was set as 100 cm) was less than 50%, the irrigation would be triggered by changing the current soil water content to the soil field capacity. The relative soil moisture is defined as
where SM is the current soil moisture, SMwilting is the wilting point, and SMcapacity is the soil field capacity.
In this study, we focused on the sensitivity test to analyze the mechanism of the irrigation effects. The irrigation amount can be adjusted by changing the thresholds (for example, the irrigation fraction and relative soil moisture thresholds). After adjustment, in this analyzed simulation, the irrigation amount was closed to the observed amount collected from the Water Resource Bulletin for each province (figure S2). Different irrigation methods (i.e. drip, sprinkler, and flood irrigation) and water source (i.e. surface water and groundwater) may have an effect on simulated results, however Leng et al [31] found that it can only affect the runoff and water table depth, and have no effect on evapotranspiration. Therefore, this study did not consider the different irrigation methods and water source.

Figure 4. Observed temperature trends against the irrigation fractions. The 43-year trends in the daily maximum temperature (a), minimum temperature (b), and mean temperature (c) during the dry season (September−May) against the irrigation fractions of each station and their linear trends.
Download figure:
Standard image High-resolution image3. Results
Time-series of the temperature differences (ΔT) in the observed daily maximum temperature (Tmax) showed that the Tmax of the intensively irrigated stations was cooler compared with the reference stations (p < 0.001 for these differences; figure 3(a)). The change in the dry season ΔTmax was correlated with the irrigation area change (r = −0.36, p = 0.066; figure 3(a)). This cooling effect of irrigation was approximately −0.07 °C (p < 0.05) per decade in the dry season Tmax and was different in the three stages of the dry season: −0.04 °C (p = 0.24) per decade for the early dry season (figure 3(d)), −0.09 °C (p = 0.15) per decade for the middle dry season (figure 3(d)), and −0.08 °C (p < 0.05) per decade for the late dry season (figure 3(d)). The cooling effect of irrigation on Tmax was demonstrated in observational studies. However, most of the studies focused on the summer or growing season [5, 8, 11, 13]. In this study, the observations showed that irrigation could influence the entire dry season over the NCP. And if we adjust the rule to separate the stations, there will be some differences (figures S3 and S4), however it does not affect the signs of trends in ΔT.
In contrast to the changes in Tmax, the observations showed that the daily minimum temperature (Tmin) at the intensively irrigated stations was dramatically warmer compared to that at the reference stations (p < 0.001 for these differences; figure 3(b)). The warming effect of irrigation on the Tmin was approximately 0.09 °C (p < 0.001) per decade for the dry season, 0.06 °C (p < 0.05) per decade for the early dry season (figure 3(e)), 0.11 °C (p < 0.001) per decade for the middle dry season (figure 3(e)), and 0.11 °C (p < 0.001) per decade for the late dry season (figure 3(e)). Additionally, the warming trend in the dry season ΔTmin was significantly correlated with the irrigation area change (r = 0.68, p < 0.001; figure 3(b)). This is clearly the opposite sign of the relationships between the irrigation area change and Tmax.
Because the warming effect of irrigation on Tmin is stronger than the cooling effect on Tmax, the Tmean of the intensively irrigated stations showed a warming trend compared to the reference stations (p < 0.001 for these differences; figure 3(c)). Moreover, the warming trend in the dry season ΔTmean was also correlated with the change in irrigation area (r = 0.30, p = 0.13; figure 3(c)). The warming effect of irrigation on Tmean was approximately 0.02 °C (p = 0.16) per decade for the entire dry season, 0.02 °C (p = 0.26) per decade for the early dry season (figure 3(f)), 0.04 °C (p = 0.21) per decade for the middle dry season (figure 3(f)), and 0.01 °C (p = 0.70) per decade for the late dry season (figure 3(f)).
The observed changes in ΔT between the two groups could also have resulted from the effects of other factors, e.g. urbanization, geography, and aerosols. However, these climate forcings are unlikely to have had a spatial pattern identical to the irrigation fraction [32]. When we removed the climatology of the observed temperature, the temperature differences in the anomalies between the two groups also showed the same irrigation effects (figure S5). Next, we analyzed the dependence of the temperature trends on the irrigation fraction to distinguish the effects of irrigation. The trends in Tmax were that it decreased as the irrigation fraction increased for the entire dry season (p < 0.05; figure 4(a)) and its different stages (figure S6), which indicates that irrigation reduced the warming trend of Tmax. Moreover, the warming trends of Tmax in the entire dry season and its different stages were expected to decrease by 0.011, 0.006, 0.014, and 0.011 °C per decade with a 10% increase in the irrigation fraction. If we only focused on the Tmax, it is true that the irrigation cooling effect could partly mask the warming trends at the intensively irrigated stations. This finding is consistent with those in previous studies on the irrigation cooling impact [5, 8−11, 13]. However, the trends in Tmin were that it increased as the irrigation fraction increased for the entire dry season (p = 0.098; figure 4(b)) and its different stages (figure S6). Irrigation contributed to the warming trend of Tmin at the intensively irrigated stations, and the warming trends of Tmin in the entire dry season and its different stages were expected to increase by 0.015, 0.011, 0.019, and 0.019 °C per decade with a 10% increase in the irrigation fraction. The magnitude of the irrigation warming effect on Tmin was larger than the cooling effect on Tmax, which led to the trends in Tmean also being slightly increased as the irrigation fraction increased for the entire dry season (p = 0.34; figure 4(c)) and its different stages (figure S6). Thus, if we focus on the Tmean, we do not find that the warming trends were masked at the intensively irrigated stations, instead there is an enhancing effect.

Figure 5. Differences in the simulated air temperature (T), surface skin temperature (Tskin), sensible heat flux (Hs), latent heat flux (LE), and ground heat flux (G) between the IRR and CNTL simulations over the NCP averaged over the grids with a warming effect on Tmin larger than 0.4 °C for the dry season (September−May). Error bars indicate the standard deviations.
Download figure:
Standard image High-resolution image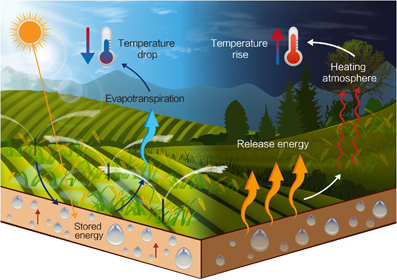
Figure 6. Schematics of the mechanisms of the irrigation-induced temperature change.
Download figure:
Standard image High-resolution image
The mechanism of the irrigation cooling effect on Tmax or daytime temperatures is well known [9, 10]. However, the mechanism of irrigation on Tmin or nighttime temperatures is still uncertain. To clarify the effects of irrigation on temperature from observations (figures 3 and 4) and understand the mechanisms of irrigation-induced temperature changes, we performed climate model simulations with (IRR) and without irrigation (CNTL). The IRR simulation showed a −0.34 °C cooling effect on the daily Tmax and a 0.60 °C warming effect on the daily Tmin compared to the CNTL simulation (figure 5), which was averaged over the grids with a warming effect on Tmin that was larger than 0.4 °C for the dry season from 2000–2004 (figure S7). The shift in surface energy partitioning (a latent heat flux increase and a sensible heat flux decrease; figures 5 and S7) effectively lowered the Tmax. Differences in the simulated ground heat flux and surface skin temperatures between the IRR and CNTL (figures 5 and S7) showed that more energy goes into the ground during the daytime, and more energy is released from the ground during nighttime, which leads to the 1.53 °C increase in daily minimum surface skin temperatures. Our model results suggest that irrigation increases the soil heat capacity [14, 15] and the thermal conductivity [16], which provide a daytime storage of energy in the wet soil that keeps the surface warm during the night (figure 6). Previous studies either ignored the irrigation effect on Tmin or thought it was not significant. Modeling studies [16, 17] performed using the Regional Spectral Model also obtained a warming effect of irrigation on Tmin at the station observations [14] in California's Central Valley. However, there is controversy regarding the contribution of the irrigation effect to observed nighttime warming in the Central Valley [5, 14, 17] because of the lack of consistency in Tmin warming trends and irrigation fractions [5]. In this study, however, the trends in Tmin demonstrated an increase as the irrigation fraction increased (figure 4(b)), and the model simulation clearly indicates that irrigation contributes to nighttime warming over the NCP.
4. Discussion and conclusions
The present study has revealed significant implications for climate and environmental change over the NCP as well as the globe. Firstly, although our simulation focused on the sensitivity of irrigation impacts, the irrigation effects simulation clearly supports the irrigation-induced warming during the nighttime. Regardless, using the climate model simulation with irrigation, we found that the exact implementation of the irrigation process is likely to be important for predicting future climate change. Without implementing irrigation in future climate simulations, we would underestimate future warming. This process could also affect regional climate changes in other regions because of the circulation changes over the NCP [4]. Secondly, crop production over the NCP is strongly dependent on irrigation owing to limited water resources [24]. There was an observed decreasing trend in precipitation over the NCP [21, 24, 33], and the interactions of irrigation and climate change would be more significant [24]. In the future, the changes in the irrigation impacts will rely on our ability to maintain (increase or decrease) current irrigation rates. Over the NCP, irrigation demand is predicted to increase in the future [34]. However, the future precipitation change is largely uncertain [21], and terrestrial water storage has largely decreased because of irrigation [6] (figure S1). Lu and Kueppers [35] found that a potential decrease in irrigation because of groundwater depletion would increase heatwave frequency, duration, and intensity. Bonfils and Lobell [5] thought it could even contribute to more rapid warming. However, our findings suggest that the decrease in irrigation would not lead to more of a warming trend over the NCP because there is no masking effect of irrigation on Tmean. Still, heat waves could increase because of the loss of the benefits of irrigation cooling on Tmax. Finally, irrigation-induced warming could affect crop yields. For example, wheat yields at certain stations have increased because of increases in Tmin during the period from 1981–2009 in the Huang-Huai-Hai Plain in China [36]. However, the impact of warming in Tmin on crop yields is still uncertain and depends on the crop and growing region [36, 37]. Whether the warming effect of irrigation on Tmin could benefit crop yields over the NCP should be analyzed.
Acknowledgments
Su-Jong Jeong was supported by the Startup funding of the Southern University of Science and Technology (SUSTech). Additional support was provided by the Southern University of Science and Technology (No. G01296001). We thank Professor Qian Y and Yang B for providing the irrigation scheme code for the WRF simulation. We also thank Dr Park C E for assistance with the model simulation and Park H for the preprocessing of the observational data. We thank the three anonymous reviewers for their valuable suggestions that greatly improved this manuscript.