

Abstract
There is an international effort to attempt to limit global warming to 1.5 °C above pre-industrial levels, however, there is a lack of quantitative analysis on the benefits of holding global warming to such a level. In this study, coupled climate model simulations are used to form large ensembles of simulated years at 1.5 °C and 2 °C of global warming. These ensembles are used to assess projected changes in the frequency and magnitude of European climate extremes at these warming levels. For example, we find that events similar to the European record hot summer of 2003, which caused tens of thousands of excess deaths, would be very likely at least 24% less frequent in a world at 1.5 °C global warming compared to 2 °C global warming. Under 2 °C of global warming, we could expect such extreme summer temperatures in the historical record to become commonplace, occurring in at least one-in-every-two years. We find that there are very clear benefits to limiting global warming for the European continent, including fewer and less intense heat and rainfall extremes when compared with higher levels of global warming.
Export citation and abstract BibTeX RIS

Original content from this work may be used under the terms of the Creative Commons Attribution 3.0 licence.
Any further distribution of this work must maintain attribution to the author(s) and the title of the work, journal citation and DOI.
Introduction
Following the Paris Agreement of December 2015 (UNFCCC 2015), there is an international effort to limit global warming to 'well below 2 °C above pre-industrial levels and to pursue efforts to limit the temperature increase to 1.5 °C above pre-industrial levels, recognizing that this would significantly reduce the risks and impacts of climate change'. However, little is understood about the difference in climate change risks between 1.5 °C and 2 °C of global warming. There are relatively few studies that quantitatively analyse risks at 1.5 °C warming with most previous research focussed on higher levels of warming (e.g. Seneviratne et al 2016, Vautard et al 2014). However, Tebaldi et al (2015) found that relatively small changes in global-mean temperature, less than the 0.5 °C difference between the two levels discussed in the Paris Agreement, can result in significant regional differences in temperature. In general, previous research has found benefits to reduced levels of global warming especially in the form of fewer and less intense heat extremes (e.g. Tebaldi and Wehner 2016). Research to quantify the differences in climate extremes between the Paris target global warming levels of 1.5 °C and 2 °C is required.
Schleussner et al (2016) examined global- and sub-continental-scale changes in some climate extremes and relevant impacts, such as sea level rise and agricultural yields, finding substantial differences between 1.5 °C and 2 °C of global warming. However, that analysis was based only on transient climate simulations that rapidly pass through these warming levels under a high greenhouse gas emissions scenario. King et al (2017) used a larger selection of model simulations to investigate changes in Australian climate extremes at the 1.5 °C and 2 °C warming levels. That study also found significant and substantial benefits to limiting global warming, particularly in terms of a reduced frequency of Australian heat extremes.
Many more analyses are needed to better quantify the differences in impacts between the 1.5 °C and 2 °C levels of global warming and to inform the Intergovernmental Panel on Climate Change (IPCC) Special Report on 1.5 °C to be published in 2018. Efforts to do this are underway, including through modelling experiments such as the Half a Degree Additional warming, Prognosis and Projected Impacts project (HAPPI; Mitchell et al 2016a, 2017), and the Community Climate simulations (Sanderson et al 2017). A range of analyses using different model setups including coupled and atmosphere-only model experiments are required.
This study focusses on European climate extremes under 1.5 °C and 2 °C of global warming. Europe is a suitable region for study in that it suffers from a range of high-impact climate extremes that have been, in part, related to anthropogenic climate change and have resulted in excess fatalities, large economic losses and other impacts (e.g. Pall et al 2011, Mitchell et al 2016b, Schaller et al 2016). A number of studies have investigated the role of anthropogenic climate change in recent temperature (e.g. Stott et al 2004, King et al 2015a, Uhe et al 2016) and precipitation (e.g. Yiou and Cattiaux 2014, Otto et al 2015) extremes over different areas of the continent. There is also a high-quality network of observational datasets maintained by the various meteorological services in Europe and compiled and utilised in products, such as E-OBS (Haylock et al 2008). This allows for better evaluation of the model simulations used to project climate extremes at 1.5 °C and 2 °C of global warming providing greater confidence in the results than would be possible in most other regions of the world.
In this study we use a large suite of coupled climate model simulations to assess changes in climate means and extremes over Europe, both in terms of frequency and intensity, and in consideration of the role of natural climate variability.
Data and methods
The methodology used in this analysis closely follows that of King et al (2017) in the model data used and the definitions of a pre-industrial baseline, the current climate, and potential future climates at 1.5 °C and 2 °C of global warming. Sensitivity to many of the choices used in developing this methodology is discussed in the Methods and supplementary information of King et al (2017) and is only briefly discussed below.
We use state-of-the-art coupled climate model simulations from the fifth phase of the Coupled Model Intercomparison Project (CMIP5; Taylor et al 2012) in this analysis (table S1 available at stacks.iop.org/ERL/12/114031/mmedia). These include simulations from the 'historical' experiment (1861–2005 under natural and anthropogenic forcings), the 'historicalNat experiment' (1861–2005 under natural forcings only), and the four representative future concentration pathways (RCPs) representing projected climate for 2006–2100 under a range of low to high greenhouse gas emissions scenarios.
These simulations are used to define four different 'worlds' that we make comparisons between. These are:
- a 'Natural world' (defined using the period 1901–2005 in the historicalNat simulations),
- a 'Current world' (defined as 2006–2026 in the RCP8.5 simulations),
- a '1.5 °C world' (defined as years under all the RCP scenarios within decades when global-average temperatures are between 1.3 °C and 1.7 °C warmer than the corresponding model natural baseline),
- and a '2 °C world' (defined using the same method as the 1.5 °C world, but for model years within decades when global-average temperatures are between 1.8 °C and 2.2 °C warmer than the corresponding model natural baseline).
Observation-based data are used in the evaluation of the model data (through a comparison between the statistical distributions of observed data and historical model simulations over a common 1951–2005 period; see King et al (2017) for further details) and to contextualise the climate extremes analysed here. The E-OBS dataset (Haylock et al 2008) is used for this purpose. E-OBS temperature and precipitation data on a 0.50° regular grid were interpolated to a coarser 2° grid to allow for a fairer comparison with the model data, also regridded to a regular 2° grid. Mean sea level pressure (MSLP) data from the ERA-Interim reanalysis (Dee et al 2011) was used in the calculation of the North Atlantic Oscillation (NAO) index and to establish the NAO-British Isles December temperature relationship.
We focus on temperature and precipitation variables extracted from the observational and model data. We examine two mean climate variables and three climate extremes indices pre-calculated from these model simulations (Sillmann et al 2013a, 2013b, table S2) and easily derived from E-OBS data:
- T, the monthly/seasonal/annual mean surface air temperature,
- R, the monthly/seasonal total precipitation,
- TXx, the monthly/seasonal highest daily maximum temperature,
- TNn, the monthly/seasonal lowest daily minimum temperature, and
- Rx1 day, the monthly/seasonal highest 1 day precipitation total.
We first investigate the annual and seasonal changes in these variables over Europe before focussing on a set of recent climate extremes to investigate how similar events may change under 1.5 °C and 2 °C global warming. We select six events for further analysis:
- 1.European-average temperature of 2016 (a new record over the region 12°W–45°E, 30°N–75°N). Variable analysed: T.
- 2.Central England temperature of 2014 (a new record over the region 2°W–0°E, 52°N–54°N). Variable analysed: T.
- 3.Central European temperature of summer 2003 (a new record over the region 5°W–20°E, 40°N–55°N). Variables analysed: T, TXx.
- 4.British Isles temperature of December 2010 (a new cold record over the region 12°W–2°E, 50°N–60°N). Variables analysed: T, TNn.
- 5.Southern European average total precipitation of March 2013 (second highest over the region 10°W–20°E, 35°N–50°N). Variable analysed: R.
- 6.British Isles precipitation of May–July 2007 (highest on record over the region 12°W–2°E, 50°N–60°N). Variables analysed: R, R × 1 day.
For many of these events there are analogous event attribution studies assessing the anthropogenic influence in the current climate (e.g. Stott et al 2004, King et al 2015a).
For each of the three events that we examine climate extreme indices we find that these indices were also at record values. Many weather records were set during these events including, for example, national daily maximum temperature records in France and the UK in summer 2003 (Burt 2004), the lowest daily minimum temperature record in Northern Ireland in December 2010 (Prior and Kendon 2011), and the highest single-day rainfall total at Pershore and other sites in central and southern England in July 2007 (Prior and Beswick 2008).
For each region and event we first calculate all observed and simulated data as an anomaly from a 1961–1990 climatology. The precipitation indices are all calculated as percentage departures from this baseline to better account for potential model biases in absolute rainfall totals. We then evaluate the models against the E-OBS data in terms of the statistical distributions of each variable (as described in King et al 2017) and subsequently only use the models that pass the evaluation test in each case (table S3).
The changing frequency of similar extreme events is analysed by simply calculating and comparing the proportion of model years exceeding the relevant threshold in each case in each of our four worlds (Natural, Current, 1.5 °C, and 2 °C). The threshold is always set as the value ranked below the event of interest, as is standard practice in event attribution analyses (e.g. Lewis and Karoly 2013). For example, events similar to the record-setting European average temperature of 2016 are compared in the four worlds using a threshold of the 2015 temperature anomaly (the previous record). In the case of the cold December event we use the second coldest December as our threshold and examine for temperature anomalies below that value.
To investigate the changing magnitude of climate extremes, the differences in the 90th, 95th, and 99th percentiles in the relevant distribution (e.g. European-average annual temperature anomalies) are computed between the 1.5 °C and 2 °C worlds. These are compared with the change in the median (50th percentile) of these distributions. Again, in the case of the cold December event we look at the change in the cold tail of the distribution instead (i.e. the 10th, 5th, and 1st percentiles).
Uncertainties on all of these changes in frequency and intensity of extreme events are estimated by bootstrap-resampling (with replacement) half of the model simulations that form each of these worlds. For example, if there are 20 climate model simulations in the ensemble that passed the test then random resampling of ten simulations at a time is used to compute different estimates of the frequency/intensity of the extreme events. This process is done 10 000 times and 90% confidence intervals are extracted.
To examine if there is a change in the background conditions associated with an extreme event type, we analyse the average temperature and mean sea level pressure anomalies of the hottest/coldest/wettest percentile in each of the four worlds. In the cold December case we also investigated whether the relationship between the North Atlantic Oscillation (NAO) and British Isles December temperatures changes between our four different worlds. The NAO was calculated as the standardised difference in MSLP between the gridboxes over Reykjavik, Iceland, and the Azores, Portugal, in both ERA-Interim reanalyses and the CMIP5 model simulations on the regular 2° grid.
Results
Europe is projected to be substantially warmer at 2 °C of global warming than at the 1.5 °C level, while for most of the continent there is high uncertainty in projected rainfall differences. Inland and eastern areas of the continent are projected to warm by more than the 0.5 °C global warming between the 1.5 °C and 2 °C levels, while western and coastal areas warm by less (figure 1). The north of the continent is expected to get wetter while some southern areas are projected to be drier (figure 2). These initial results are in agreement with general model projections from other studies (e.g. Maraun 2013, Vautard et al 2014) and the IPCC Fifth Assessment Report (Bindoff et al 2013), but here we quantify changes at relatively low levels of global warming.

Figure 1. Changes in mean temperature and temperature extremes projected between 1.5 °C and 2 °C of global warming. Maps showing the average difference in (a) annual average temperature, summer (b) average temperature, (c) highest maximum temperature, and winter (d) average temperature, and (e) lowest minimum temperature, between 2 °C and 1.5 °C of global warming.
Download figure:
Standard image High-resolution image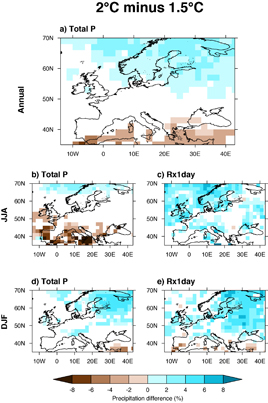
Figure 2. Changes in mean precipitation and precipitation extremes projected between 1.5 °C and 2 °C of global warming. Maps showing the average difference in (a) annual average total precipitation, summer (b) total precipitation, and (c) highest 1 day precipitation, and winter (d) total precipitation, and (e) highest 1 day precipitation, between 2 °C and 1.5 °C of global warming. All precipitation changes are given in percentage departures from the average at 1.5 °C and are only shown where at least three-quarters of climate models agree on the sign of the change.
Download figure:
Standard image High-resolution image
Figure 3. The change in the frequency of European climate extremes under different levels of global warming. The likelihoods in a given year of similar events to recent European extremes in a natural world, the current world, a 1.5 °C world and a 2 °C world. The best estimate is shown with the 90% confidence intervals in parentheses. The context and relevant impacts of the events are highlighted.
Download figure:
Standard image High-resolution image
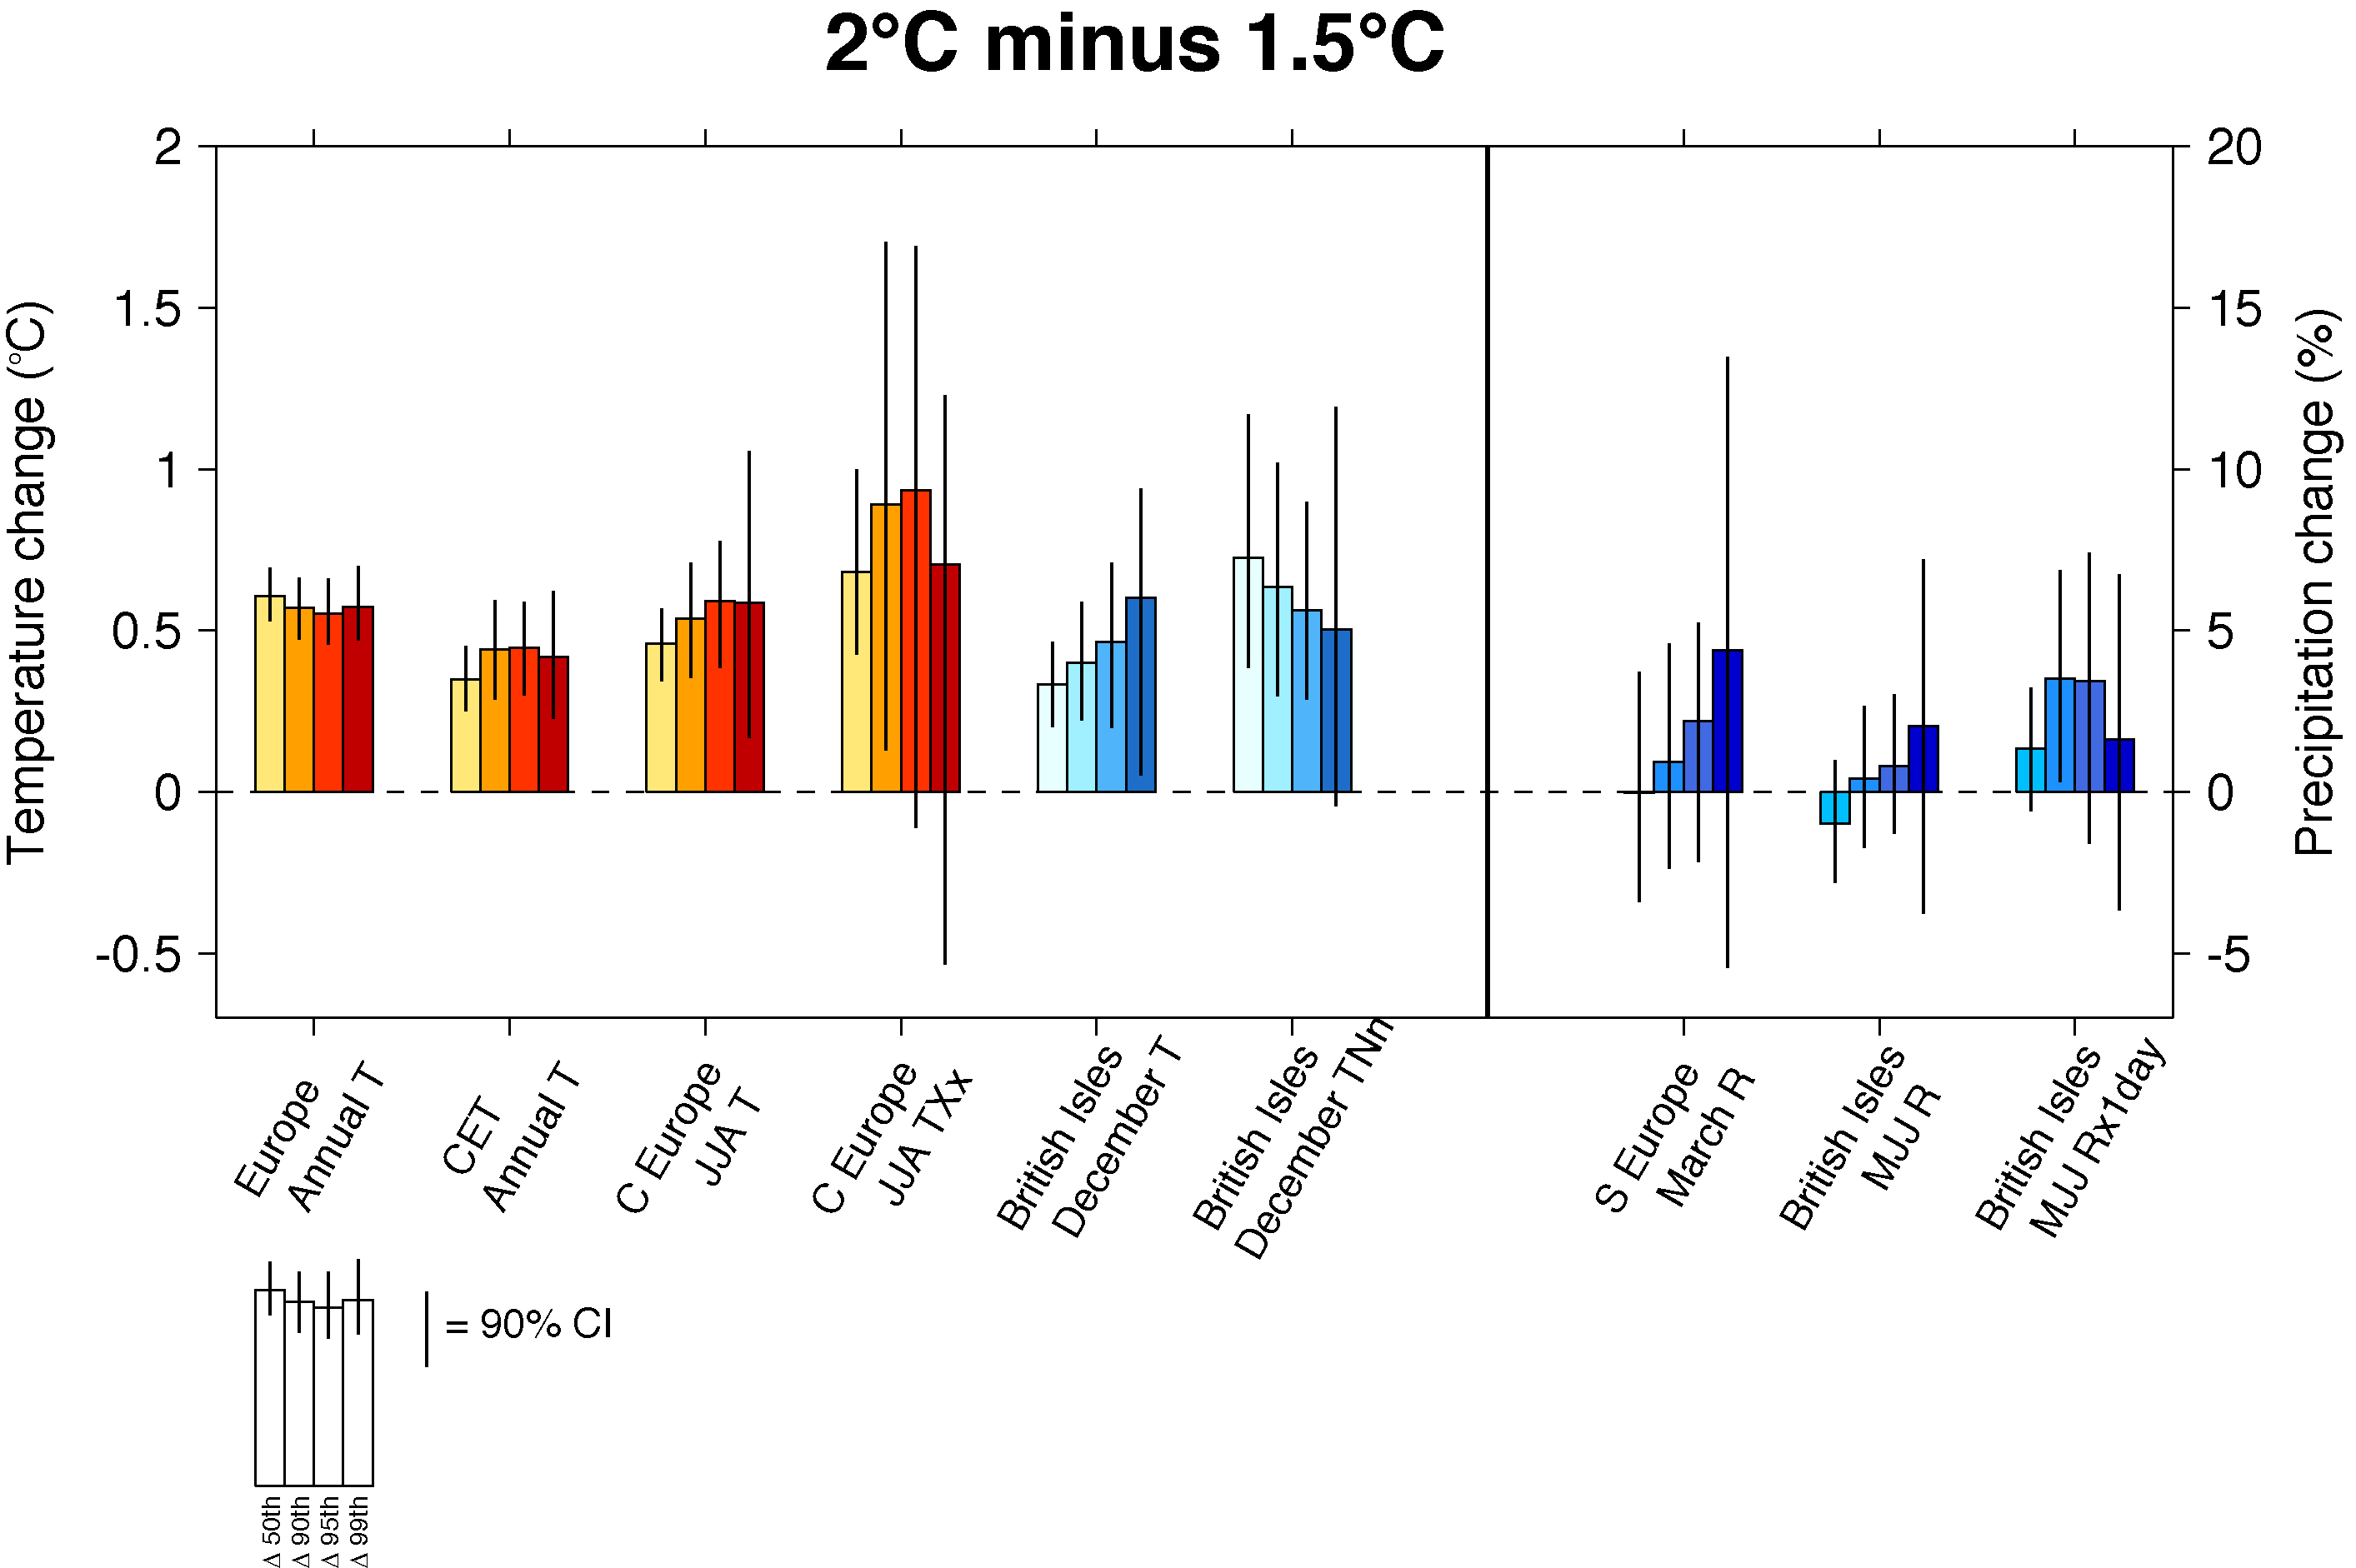
Figure 4. The change in intensity of European temperature and precipitation extremes between 2 °C and 1.5 °C global warming. The difference in temperature and precipitation at the median, 90th, 95th and 99th percentile between 1.5 °C and 2 °C of global warming. For the British Isles December temperature events, the median, 10th, 5th and 1st percentile changes are shown instead. The bars indicate best estimate changes while the black lines represent the 90% confidence interval.
Download figure:
Standard image High-resolution image
Figure 5. Conditions associated with the coldest Decembers in the British Isles (a)–(d) Temperature and mean sea level pressure anomalies (relative to an historical 1961–1990 baseline) in the coldest 1% of events under (a) natural, (b) current, (c) 1.5 °C, and (d) 2 °C worlds. (e)–(h) Scatter plots of the North Atlantic Oscillation index against British Isles-average December temperatures under the four scenarios respectively. (f) December 2010 (the coldest December in the observational timeseries) is marked.
Download figure:
Standard image High-resolution image
Seasonal changes are broadly similar, although with greater warming over much of Europe in boreal summer (JJA) except for parts of Scandinavia and Russia. In summer there is greater drying over more of Europe from 1.5 °C warming to 2 °C warming, while in winter more areas see increased precipitation from 2 °C warming. There is an expected signal of climate change-caused increases in precipitation over northern Europe in winter (e.g. Min et al 2011, King et al 2015b).
Temperature extremes are projected to warm in a similar pattern to mean warming between 1.5 °C and 2 °C, although with a slightly greater warming seen in both the hottest summer day (figure 1(c)) and coldest winter night (figure 1(e)) relative to the mean change, especially over western Europe. For precipitation extremes there is a clearer signal of increased intensity of extreme wet days in both summer (figure 2(c)) and winter (figure 2(e)), in contrast to the weaker signal for mean changes over most of the continent. This is particularly the case for Britain and Ireland in summer, where there is a slight drying trend in the mean from 1.5 °C–2 °C (figure 2(b)), but an increased intensity in the highest single day rainfall totals (figure 2(c)).
Changing frequency of extremes from 1.5 °C–2 °C
When we examine how historical extreme events may change under 1.5 °C and 2 °C of global warming, a clear pattern emerges (figure 3). All of the climate extremes we investigate are unusual in the context of a natural climate, occurring less than 10% of the time (i.e. in fewer than one-in-every-ten years). However, in the current climate and the future scenarios of 1.5 °C and 2 °C, heat extremes become considerably more frequent. Even at only 1.5 °C of global warming we estimate that hot years across Europe like the 2016 record would be occurring on average in roughly one-in-every-two years. High-impact heat extremes, such as the summer heat in 2003 which resulted in thousands of excess deaths in France and other countries (Mitchell et al 2016b), are significantly more frequent at 2 °C than 1.5 °C or in the current climate, and occur in most years in a 2 °C world. For each of the heat extremes studied here, analogous event attribution analyses found a significant anthropogenic role in these events in Europe (Uhe et al 2016, for a previous record set in 2014), central England (King et al 2015a), and central Europe (Stott et al 2004, Christidis et al 2014). In the extreme temperature index, TXx, we find an increase in occurrence of heat events with global warming, although with greater uncertainty due to the use of a smaller model ensemble (table S3).
Cold extremes like those experienced in December 2010 in the UK and Ireland are very uncommon even in the current climate, with a return period of less than one-in-100 years, and are virtually impossible at the 1.5 °C and 2 °C warming levels with no such events in the 2 °C world. Heavy snowfalls during this event caused massive disruption with hundreds of flight cancellations at airports including the busiest in Europe, London Heathrow, and billions of pounds in lost business.
There is less change in the frequency of wet periods as illustrated by the non-significant changes in the likelihood of both wet Marchs in southern Europe and very wet May–July periods in the British Isles. In contrast, there is a clear signature of an increase in the frequency of very wet days like those seen during May–July 2007 over the UK and Ireland. In a 2 °C world, such extreme single-day rainfall events are at least 17% more likely (> 90% confidence) than in a 1.5 °C world and at least 70% more likely than in the current climate.
Changing intensity of extremes from 1.5 °C–2 °C
In addition to the changes in the frequency of these climate extremes, we also find substantial changes in the intensity of extreme events at 2 °C global warming relative to 1.5 °C (figure 4). In the case of temperature extremes (90th, 95th, and 99th percentile) we project similar changes as are seen in the median temperature change from 1.5 °C–2 °C, albeit with increased uncertainty in the change (as seen through the lengthened bars representing the 90% confidence intervals in figure 4). As expected from figure 1, we project larger increases in European-average temperature than for central England in both the median change and high percentile changes from 1.5 °C–2 °C.
For central European summer temperatures we find a tendency for greater warming in the warm tail of the distribution than in the median. For example, the best estimate changes in the 95th and 99th percentiles (0.59 °C and 0.58 °C respectively) are above the upper bound of the 90% confidence interval on the median change (0.57 °C). This suggests a slight lengthening in the warm tail of central European summer temperatures in the 2 °C world relative to the 1.5 °C world. We also project greater warming in TXx than we do in average summer temperatures, although with higher uncertainties, especially in the tail of the TXx distribution.
British Isles December temperatures are projected to warm in both the median and the cool tail of the distribution between global warming levels of 1.5 °C and 2 °C. There is a suggestion of greater warming in the cool tail than the median, with the best estimate of warming in the 1st percentile (0.60 °C) above the upper bound of the 90% confidence interval in the warming of the median (0.47 °C). The coldest nights are projected to become warmer between 1.5 °C and 2 °C scenarios, albeit with very high uncertainty.
The changes in precipitation intensity from the 1.5 °C–2 °C global warming levels also have high uncertainty. There is a suggestion of increased precipitation in the wet tail of the distribution with the majority of bootstrapped estimates greater than zero despite very little change in the median for March precipitation in southern Europe and a decrease in the median for May–July rainfall in the UK. There is a signal for a lengthening of the wet tail of the rainfall distribution, although it is not extremely clear between the 1.5 °C and 2 °C warming levels.
Changing background conditions associated with climate extremes
We also investigated how the meteorological conditions associated with extreme events may change. We focussed on cold Decembers in the UK and Ireland as these events tend to be associated with particular atmospheric circulation patterns (i.e. anomalously high pressure to the north of Britain that prevents Atlantic storm systems from reaching the UK and instead delivers air from the much colder east). We compared the mean sea level pressure and temperature anomalies (from a 1961–1990 baseline) associated with the coldest percentile of Decembers in each of our four worlds (figures 5(a)–(d)). We found that whilst the coldest events tended to get warmer as the world warmed, the circulation patterns changed very little with strong easterly anomalies still required to bring the coldest weather.
Similarly when we examined the relationship across all December temperature anomalies in the British Isles with the NAO (figures 5(e)–(h)), we found that strong relationship being maintained while the background warming increases the temperatures associated with a given NAO phase. The observation-based and simulated NAO relationships with December temperatures over the British Isles were similar with positive, statistically significant correlations (p < 0.05) in all models and in ERA-Interim and E-OBS over their common 1979–2015 period. Historical cold events such as December 2010 lie well outside the distribution of December temperature anomalies under either 1.5 °C or 2 °C levels of global warming.
Discussion and conclusions
In this study we have used a large ensemble of readily-available coupled model simulations to investigate how climate extremes in Europe would likely change under 1.5 °C and 2 °C of global warming. We found a very clear signal towards more regional warming with a greater frequency of heat extremes and fewer cold extremes as global warming increases. The highest changes in frequency are projected for the largest regions as the year-to-year variability is lower on these spatial scales (e.g. Fischer et al 2013, King et al 2015b, Uhe et al 2016). Rainfall changes are less clear, although there is a signal that the heaviest rainfall events would likely become more intense at 2 °C warming compared to 1.5 °C.
We have greater confidence in some of our findings than others. Unfortunately we had fewer model simulations with which to analyse the changes in extreme indices (table S3) and that, as well as there being greater variability in climate extremes, resulted in greater uncertainties on those changes, as seen in the wide 90% confidence intervals in figures 3 and 4. We also have more confidence in our large-scale results, such as the analysis of European-average temperatures, compared with the gridbox-scale changes in figures 1 and 2, although we have confidence in the general patterns seen in figures 1 and 2. There is less confidence on the NAO-based results too as models project quite different future scenarios for the North Atlantic jet stream and extratropical storm track (e.g. Bader et al 2011). However, we found the NAO-British Isles December temperature relationship was similar between the observation-based data and the model simulations. Some scientists have argued that due to such uncertainties, event attribution analyses should be focussed on thermodynamically-derived changes (e.g. Trenberth et al 2015). We acknowledge that different modelled changes in atmospheric circulation pose an additional challenge for studies such as ours and should be the focus of further research. The most substantial changes we find between 1.5 °C and 2 °C in Europe are primarily related to background warming (i.e. more frequent and intense heat extremes, fewer and less intense cold extremes, and more intense extreme rainfall). For the results which are likely more related to atmospheric circulation changes (i.e. mean rainfall changes) we present the uncertainty related to those changes through indicating the level of model agreement or providing confidence intervals.
This analysis follows that of King et al (2017) which was focussed on Australia and is designed to provide quantitative estimates of how climate extremes will likely change with global warming. As was the case for Australia, in Europe there are clear benefits to limiting global warming to 1.5 °C relative to 2 °C, in particular in terms of the reduced frequency and magnitude of heat extremes. Very intense summertime rainfall extremes over the UK would also be less frequent at 1.5 °C than 2 °C of warming. Our study does not attempt to go further into quantifying the benefits of limiting global warming through reduced numbers of excess deaths due to heat or flooding costs; other impacts-relevant studies are needed to inform the IPCC special report on 1.5 °C on these effects.
Our study should also complement other analyses using different model simulations and setups, such as those in the HAPPI project and the Community Climate simulations (Sanderson et al 2017) amongst others (James et al 2017). Indeed our extreme event selection was limited by the ability of the climate models to reasonably represent past temperature and rainfall variability, and this resulted in the exclusion of analyses on events like the wet December of 2015 in northern Britain. Other modelling experiments may be able to examine more localised precipitation extremes than were possible in our analysis.
There are advantages and disadvantages to the use of different model experiments for analysis of climate changes at 1.5 °C global warming. Our time-slice method based on CMIP5 data is a surrogate for analysis based on equilibrium climates at the 1.5 °C and 2 °C levels that could be achieved using other model experiments. However, it has advantages over other methods in that it is based on a multi-model ensemble of state-of-the-art fully-coupled climate models. Further comparisons between analyses under transient and equilibrium states and using different experiment designs will be useful.
This study finds that limiting global warming to 1.5 °C relative to higher levels of global warming would have substantial benefits for Europe. If global warming is kept to lower levels, Europe would experience fewer heat and rainfall extremes compared with higher levels of warming.
Acknowledgments
We thank the anonymous reviewers for providing helpful and constructive feedback. We acknowledge the support of the NCI facility in Australia and the World Climate Research Programme's Working Group on Coupled Modelling, which is responsible for CMIP, and we thank the climate modelling groups for producing and making available their model output. For CMIP the US Department of Energy's Program for Climate Model Diagnosis and Intercomparison provides coordinating support and led development of software infrastructure in partnership with the Global Organization for Earth System Science Portals. We acknowledge the E-OBS data set from the EU-FP6 project ENSEMBLES (http://ensembles-eu.metoffice.com) and the data providers in the ECA&D project (www.ecad.eu). Both authors are funded through the Australian Research Council Centre of Excellence for Climate System Science (CE110001028). David Karoly acknowledges support from the Oxford Martin School while he was a Visiting Fellow during January to July 2017.