


Abstract
In many terrestrial regions, higher than usual surface temperatures are associated with (or are even induced by) surface moisture deficits. When in the warm season temperatures become anomalously high, their extreme values affect human beings causing heat stress. Besides increased temperature, rising humidity may also have substantial implications for bodily thermal comfort. However, the effects of surface moisture on heat stress, when considering both temperature and humidity, are less known. In this study, the relationship between the number of hot days in July as indicated by the wet-bulb globe temperature and the preceding three months of precipitation was assessed over eastern China. It is found that the probability of occurrence of above the average number of hot days exceeds 0.7 after a preceding precipitation deficit in northeastern China, but is less than 0.3 in southeastern China. Generally, over eastern China, the precipitation in the preceding months is negatively correlated with temperature and positively correlated with specific humidity in July. The combined effects generate a spatially distinct pattern: precipitation deficits in preceding months enhance heat stress in northeastern China while in southern China these deficits are associated with reduction of heat stress. In the south, abundant preceding precipitation tends to increase atmospheric humidity that is instrumental for the increase of heat stress. These results contribute predictive information about the probability of mid-summer heat stress in eastern China a few weeks ahead of its occurrence.
Export citation and abstract BibTeX RIS

Original content from this work may be used under the terms of the Creative Commons Attribution 3.0 licence.
Any further distribution of this work must maintain attribution to the author(s) and the title of the work, journal citation and DOI.
1. Introduction
The coupling between soil moisture, temperature and precipitation plays an important role in the land–atmosphere interaction under a changing climate (Koster et al 2004, Seneviratne et al 2006). The strong coupling between antecedent soil moisture (ASM) and temperature has been found in considerable areas in Europe, the United States, and Australia (Miralles et al 2012, Hirsch et al 2014, Mazdiyasni and AghaKouchak 2015, Hauser et al 2016, Herold et al 2016), which could somewhat facilitate the seasonal forecast of local temperature and hot extremes (Hirschi et al 2011, Orth and Seneviratne 2014) in regions located downwind from the areas of original ASM anomalies (Volodin 2011). For example, the catastrophic drought in the central region of European Russia (CRER) during July−August 2010 was caused by an anticyclone that stalled (was blocked) over the region for six weeks (Barriopedro et al 2011, Mokhov 2011, Hauser et al 2016) and a prolonged ASM anomaly over the Lower Volga–Northwestern Kazakhstan regions located more than 1000 km south-southeast of CRER. Model simulations show that the last factor was critical in the extraordinary summer drought that year by adding 3 °C to mean July temperature anomalies (Volodin 2011). The ASM mainly affects hot extremes by modulating the energy balance, that is, lower soil moisture depresses the cooling effect of evaporation and increases sensible heat flux (Mueller and Seneviratne 2012, Gallego-Elvira et al 2016), and, by changing atmospheric circulation, that moves the abnormally hot air masses affected by the ASM anomaly to new areas where they contribute to (enhance, or even cause) extreme summer temperatures (Koster et al 2016). The positive feedback between an ASM deficit and the following hot summer temperatures was mostly found in arid/semi-arid regions but seldom in humid regions (Alexander 2011), and the latent heat flux (evapotranspiration) component of the land–atmosphere coupling was often ignored in this feedback (Ford and Schoof 2016).
Though evapotranspiration is mostly controlled by the energy budget and is not sensitive to soil moisture anomaly in wet climates (Koster et al 2004), the relevant moisture flux exchange in these climates is a dominant process in the land–atmosphere interaction during summer. In warm and wet regions, the atmospheric vapor content (humidity) could be a key parameter in addressing the extreme heat stress on humans (Wehner et al 2016). High values of the wet-bulb globe temperature (WBGT) combining temperature and humidity provide a more integrated quantification of climate impact on heat stress (Sherwood and Huber 2010). Furthermore, the WBGT has been more robustly estimated in climate models (Knutti and Sedlacek 2013). Therefore, understanding the potential connections between ASM and WBGT may improve projections of extreme heat stress for some regions (Leng et al 2016).
The climate in eastern China is dominated by the East Asian Summer monsoon and often characterized by a wet and warm summer season (Ding and Chan 2005). This region is home to a large portion of the Chinese population and is frequently struck by heat extremes (Li et al 2014, Sun et al 2014, Tang et al 2014, Sun et al 2017). Thus, improving extreme weather forecast over eastern China would be of great socioeconomic significance. Some areas in this region, e.g. Northeast and North China, have been identified as hot spots of the land–atmosphere coupling (Koster et al 2004, Hirsch et al 2014). In this study, potential connections between ASM and summer heat stress are investigated using the Standardized Precipitation Index (SPI), as a proxy of ASM, and the number of hot days (NHD) based on maximum temperature (Tx) and maximum WBGT (Tw) as characteristics of heat stress of humans respectively. Although SPI is not the best index of ASM, SPI that is based on a single most frequently observed variable, rainfall, undisputedly allows the best spatial coverage of the ASM characterization. We particularly focus on correlations between Tw and SPI to examine whether the use of combinations of temperature and humidity (Tw) may reveal a higher degree of land–atmosphere coupling in wet and warm regions like South China. For three regions identified as hot spots according to the strength of the land–atmosphere coupling over eastern China, we also perform several in-depth analyses to better characterize/quantify the ASM–heat stress relationships.
2. Methods and data
2.1. Data
In this study, a gridded meteorological dataset derived from in-situ observations and reanalysis data is used. It includes near-surface temperature, precipitation, specific humidity, and the near surface atmospheric pressure at 3 h time-steps from 1979–2014 (Yang et al 2010, Chen et al 2011, He and Yang 2011). These meteorological data were generated through combining the sub-daily (6 h or hourly) and daily maximum/minimum observations of more than 700 stations from the China Meteorological Administration (CMA) and the Princeton Meteorological Forcing Data (Sheffield et al 2006, He 2010). More details about this data product can be found in He (2010) and He and Yang (2011). This dataset has been used in many climatic and hydrological studies in China (e.g. Liu and Xie 2013, Zhang et al 2014). Daily maximum temperature (Tx) was computed from the 3 h temperatures of each day. The 3 h precipitation information was aggregated over time to obtain monthly data, which are required for the SPI calculations. For reference, correlations between Tx and SPI are also calculated using the CMA gridded daily dataset with 0.5° spatial resolution (available from the China Meteorological Data Service Center: http://data.cma.cn/en/); these correlations are shown in the supplementary data available at stacks.iop.org/ERL/12/115010/mmedia.
It should be noted that the changes in instrumental observations and site displacements may affect the data quality of relative humidity (Wang and Gaffen 2001). However, most sites with inhomogeneity issues are located in western China (Wang and Gaffen 2001) and nationwide changes in observational practice at the Chinese meteorological network had occurred well before 1979, which is the first year of observations used in our analyses. Furthermore, the China Meteorological Data Service Center has worked hard to provide homogenized time series. The quality-controlled humidity data were also used in some recent studies (Ding and Liu 2014). No obvious abrupt shifts were found in the relative humidity time series used in this study.

Figure 1. Correlation between the preceding SPI and NHD of July based on Tx (NHD-T) and Tw (NHD-W). Three hot spots regions are delineated with black rectangles and labelled as HS1, HS2, and HS3, respectively. The Yangtze River and the Yellow River are displayed as gray lines. All maps have been smoothed with a moving box of width 5. Significance levels (95%, dotted) are not smoothed. The absolute threshold value of significant correlation at 95% level of statistical significance is 0.33.
Download figure:
Standard image High-resolution image2.2. Extreme heat events
NHD per month is used in our analysis as a proxy of the extreme heat events at the monthly time scale. NHD is calculated separately for Tx (NHD-T) and Tw (NHD-W) of July, the hottest month in China. Following Mueller and Seneviratne (2012), NHD is defined here as the number of days with a maximum temperature exceeding the 90th percentile of Tx distribution in July from 1979−2014. The NHDs are calculated for each grid cell and thereafter are domain-averaged for regional analyses.
The simplified WBGT estimates are used to express potential heat stress (ACSM 1984, Willett and Sherwood 2012):

where T is temperature (°C) and e is simultaneous water vapor pressure (hPa). Water vapor pressure is derived using e = pq/0.622/100, where p is atmospheric pressure and q is specific humidity.

Figure 2. Domain-averaged time series of NHD anomalies of July and the preceding SPI in the three hotspot regions shown in (a) Northeast China, (b) North China, and (c) South China. The blue dashed lines are for SPI = −0.8 and SPI = 0.8.
Download figure:
Standard image High-resolution imageThe 3 h WBGT values are estimated from the simultaneous 3 h data, which thereafter are used to obtain the daily maximum WBGT estimates (Tw). In wet and warm regions (e.g. South China), WBGT could be higher than maximum temperature (see the monthly Tx and Tw in figure S1). By accounting for both temperature and moisture components of heat stress, Tw is a better heat stress indicator than Tx (i.e. serves better as a heat stress characteristic) (Ford and Schoof 2016). It has been widely used to represent the heat stress level perceived by humans in the surrounding environmental conditions (Willett and Sherwood 2012, Fischer et al 2012).

Figure 3. Probability of occurrence of hot day (NHD-W) after dry versus wet antecedent conditions. Probability of occurrence of above-average number of hot days in July after dry conditions (SPI<−0.8, (a)) and wet conditions (SPI>0.8, (b)), and difference between them (c). In plot (c), the lower negative values indicate larger probabilities of hot day after wet conditions, while higher positive values indicate larger probabilities of hot day after dry conditions.
Download figure:
Standard image High-resolution image2.3. Standardized Precipitation Index (SPI)
The SPI (McKee et al 1993) has been widely used to represent the antecedent soil moisture conditions when exploring the coupling of soil moisture and temperature (e.g. Hirschi et al 2011, Zhang et al 2015). SPI can be calculated at different time-scales, like 1 to 12 months, among which the 3 month SPI was mostly used for similar analyses and often showed the strongest correlations with temperature extremes in previous studies (Mueller and Seneviratne 2012, Whan et al 2015, Herold et al 2016). In this paper, SPI is calculated (see the supplementary data or Liu et al (2012) for the full procedures) using the precipitation of the three months preceding July, i.e. April, May, and June, for each grid cell individually, and is then spatially averaged for the hot spots analysis.
2.4. Hot spots analysis
Three hot spots, located in Northeast, North, and South China (figure 1), respectively, are identified using the pattern of correlations between SPI and NHD from the past studies (e.g. Koster et al 2004, Mueller and Seneviratne 2012). Temporal variations of the area-averaged NHD and SPI are shown for the hot spots, and their correlations are calculated to show the regional features of the soil moisture–temperature coupling over eastern China.
3. Results
Figure 1 shows the correlations between the NHD based on Tx and Tw in July and the preceding 3 month SPI. Correlations between NHD-T and SPI (figure 1(a)) are mainly negative in Northeast China and some areas in North China, and are mostly insignificant in South China (hereafter, South China refers to the areas south of 35°N in all figures), which is generally in line with previous studies (e.g. Mueller and Seneviratne 2012, Hirschi et al 2014) and is also consistent across different datasets (see figure S2). The negative correlations between SPI and NHD-W (figure 1(b)) basically resemble the pattern for SPI and NHD-T but with smaller areas of significant correlations in Northeast China. The absolute threshold values of significant correlations here are 0.33 at the 95% level of statistical significance. There are many fewer areas with statistically significant correlations in North China. There are visibly more areas with significant positive correlations in South China (near 10% of the entire region; see figure S3 for the field significance test (Livezey and Chen 1983)) while there are no areas with significant negative correlations. Thus, the correlations between SPI and NHD-W exhibit a significant regional divergence shifting from negative in Northeast to positive in South China.
Figure 2 shows the domain-averaged time series of NHD-T, NHD-W, and SPI for the three hot spot regions outlined in figure 1. For HS1 (figure 2(a)), the hot spot region in Northeast China, both NHD-T and NHD-W are significantly correlated with SPI (r = −0.65 and −0.43, respectively). NHD-T and NHD-W show large positive anomalies after dry conditions (SPI < −0.8) except in 2004, and show negative anomalies after wet conditions (SPI > 0.8), e.g. in 1983, 2005 and 2009. In the hot spot region in North China, HS2, a significantly negative correlation (r = −0.43) is found for the NHD-T and SPI, while there is no significant correlation between NHD-W and SPI (figure 2(b)). The NHD-T shows large positive anomalies after dry conditions except in 1982, while NHD-W shows much smaller or negative anomalies, e.g. in 1982, 1992 and 1997. In the HS3 hot spot region in South China, no significant correlation is found between NHD-T and SPI, but a significant positive correlation (r = 0.44) is found for NHD-W and SPI (figure 2(c)). The NHD-T and NHD-W show a strong positive correlation (r = 0.81) in HS1, and relatively small correlations (r = 0.42 and 0.5, respectively) in HS2 and HS3. It suggests the temperature's dominant role in Tw estimation in HS1, but imposes a relatively smaller impact on Tw in HS2 and HS3.
Figure 3 shows the probability of occurrence of an above-average NHD-W in July after dry (SPI < −0.8, 3a) and wet (SPI > 0.8, 3b) antecedent conditions. The difference between the probability after dry conditions and that after wet conditions is shown in figure 3(c). More than 60% of years display an above-average NHD-W after dry conditions in considerable areas of Northeast China and in some areas of North China, in contrast to less than 20% of years across South China (figure 3(a)). After wet conditions (SPI > 0.8), the probability of occurrence of above-average NHD-W is less than 40% for most areas in Northeast and Southeast China. It is larger than 60% for the areas between the Yangtze River and the Yellow River and in a few areas of South China. The probability of occurrence of an above-average NHD-W is increased by more than 20% after dry conditions compared to wet conditions for many areas in Northeast China, while it is increased by more than 20% after wet conditions compared to dry conditions in many areas across South China (figure 3(c)). These patterns are different from the analysis based on NHD-T (see figure S4, which is generally in line with the figure 4 of Mueller and Seneviratne 2012). It suggests that, in Northeast China, wet conditions tend to prevent the occurrence of hot extremes in terms of both NHD-T and NHD-W; while in many areas of South China, wet conditions are prone to increase the occurrence of hot extremes based on Tw.
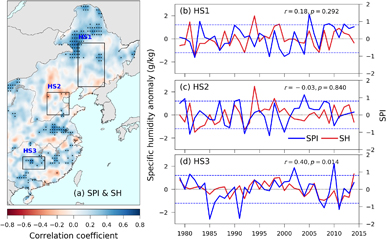
Figure 4. Correlation between specific humidity (SH) in July and the preceding SPI. The map (a) has been smoothed with a moving box of width 5. Significance levels (95%, dotted) are not smoothed.
Download figure:
Standard image High-resolution image
The correlations between the specific humidity (SH) of July and the preceding SPI further demonstrate the strength of the land–atmosphere coupling over eastern China (figure 4(a)). Significant positive correlations between SPI and SH are found in some parts of Northeast China, but the correlation is weak and statistically insignificant in the HS1 hot spot (figure 4(b)). Both positive and negative but statistically insignificant correlations between SPI and SH are found over most of North China (see figure 4(c) for the HS2 hot spot), while statistically significant positive correlations are found in considerable areas of South China (cf. figures 4(d) for the HS3 hot spot), including the areas between the Yangtze and Yellow Rivers, where Koster et al (2004) also identified areas with strong land–atmosphere coupling. The hot spot in North China (HS2, figure 4(c)) shows insignificant correlation, and the hot spot in South China (HS3, figure 4(d)) shows relatively large positive correlations between SPI and SH.
4. Discussion
ASM anomaly characterized by SPI is statistically significantly connected to hot extremes represented by both Tx and Tw in July over most of eastern China. Positive correlations between SPI and Tx-based hot extremes are found in many areas of northern China which is in line with the previously identified potential hot spots of strong land–atmosphere coupling (Koster et al 2004, Hirschi et al 2014). The positive feedback mechanism between ASM and hot extremes has been well documented in previous studies (e.g. Hirschi et al 2011, Mueller and Seneviratne 2012). ASM deficit tends to produce high temperature by inhibiting surface evaporation and increasing sensible heat flux. Meanwhile, a decrease of atmospheric water vapor results in less precipitable water in the atmosphere (Berg et al 2015, Gallego-Elvira et al 2016). However, under wet conditions, evapotranspiration (latent heat flux) is often a dominant process in land–atmosphere interactions. The near-surface temperature is lower mainly because of the evaporative cooling effect of preceding wet conditions (see figure 2). Moreover, high evapotranspiration could increase the atmospheric water vapor content and enhances cloud cover (Alexander 2011) that might cool the near-surface atmosphere as well (Tang and Leng 2012, Tang and Leng 2013). On the other hand, the ASM deficit seems to be more easily moderated by rainfall in wet regions (the July rainfall in figure S5) and consequently, the soil moisture in these regions often has relatively short memory in the summer season (Wu and Dickinson 2004, Zhang et al 2017). Therefore, the positive feedback between ASM deficit and hot extremes is mostly found in arid and semi-arid regions (Alexander 2011) like northern China where less water vapor is available for cooling the near-surface air. However, such weather conditions are rarely observed across South China.
In comparison to the relation between SPI and NHD-T, the connection between SPI and heat stress index (NHD-W) is much weaker and shows larger variations across China (figure 1). The negative but weaker correlation between SPI and NHD-W still exists in some parts of Northeast China, but it is almost absent in North China. Meanwhile, more robust positive correlations between SPI and NHD-W emerge over considerable areas of South China, which suggest a potential hot spot region here with strong land–atmosphere coupling.
The changes in the correlations between NHD-W and NHD-T in South China to some degree imply the decoupling between SPI and NHD-T. In these wet and warm regions, the enhanced evapotranspiration due to high ASM seems to have limited cooling effect on high temperatures (Koster et al 2004), which may be among the reasons for lacking the positive feedback between SPI deficit and temperature extremes in South China. However, inclusion of the humidity-related factor reveals here a potential land–atmosphere coupling. The significant correlations between SPI and SH, which may indicate a plausible positive feedback between ASM and humidity, are found in considerable areas of South China (figure 4(a)) where high ASM may facilitate the persistence of wet conditions (Eltahir 1998, Zhang et al 2008). The positive correlations between SPI, Tw and SH (see figure 1(b) and 4(a)) in South China reflect that high WBGT is related to the occurrence of antecedent wet weather which provides abundant moisture to promote oppressive hot extremes (Ford and Schoof 2016). It should be noted that, as an approximation of the observed WBGT, the simplified WBGT still has some limits which may result in slight overestimation of heat stress under cloudy or windy conditions and underestimation during periods of full sun and light winds (Willett and Sherwood 2012).
The combination of temperature and humidity takes into account both the energy and water balances in the land–atmosphere interactions as well as in the wellbeing of the human body, and is supposed to be a more robust estimation of heat stress in climate models (Fischer and Knutti 2013). In this study, the significant positive correlations between SPI and Tw in South China further confirm the necessity of accounting for humidity conditions for heat stress estimates and allow for improving the hot extremes projections using a heat stress index in numerical weather forecast and climatic models. However, it remains a great challenge to fully understand the coupling between soil moisture, precipitation and temperature extremes (Lorenz et al 2016). The investigation is partly impeded by a limited availability of in-situ measurements of soil moisture (Miralles et al 2012) and the insufficient representativeness of soil moisture persistence reported by satellite-based products due to a shallow layer of soil moisture reported by these products (Hirschi et al 2014, Parinussa et al 2014). Furthermore, the coupling is frequently being affected by local human activities. For example, irrigation may alter the sensible and latent heat fluxes over cropland (Tang et al 2008, Leng et al 2013, Han et al 2014), which may completely eliminate the effects of the preceding precipitation deficit on high temperatures reported by meteorological observations. The complexity of the issue is also implied from differences in hot spots of land–atmosphere coupling that are identified by climate models (Koster et al 2004) and observations (Mueller and Seneviratne 2012). Soil moisture observations with larger spatial and upper soil layer depth coverages are needed and would be of great help in understanding the land–atmosphere coupling (Vinnikov et al 1999, Robock et al 2000, Seneviratne et al 2010, Hirschi et al 2011, Collow et al 2014).
5. Conclusions
The coupling between ASM, characterized by the SPI of April, May and June, and July hot extremes based on Tx and Tw are investigated over eastern China during 1979−2014. The correlations between the SPI and NHD-W are mostly negative and are weaker compared to SPI and NHD-T in northern China. However, SPI and NHD-W show significant positive correlations over large areas of South China. This study implies that ASM shows a strong impact on the hot extremes in Northeast China and some areas in North China, but this impact is very small in South China. However, we found that ASM plays an important role in moderating the occurrence of a high WBGT in South China. Here, high ASM may not reduce much sensible heat flux from the land surface but it is associated with high overlying atmospheric humidity which favors the formation of a high WBGT in wet and warm regions. Strong correlation and plausible positive feedback between ASM and the atmospheric humidity contribute to statistically significant correlations between SPI and NHD-W in these regions.
This study suggests a new potential hot spot region with strong land–atmosphere coupling in South China. In South China, there is a positive feedback between antecedent soil moisture and relative humidity which affects WBGT, i.e. extreme heat stress on humans. In contrast, the land–atmosphere coupling in northern China shows negative correlations between antecedent soil moisture and temperature which affects WBGT in a different way. It also highlights the necessity of using heat stress indices that combine temperature and humidity variables for hot extreme estimates over eastern China. The use of heat stress indices improves projections of hot extremes that affect the human well-being in warm and humid regions like South China. It is also noted that high-quality soil moisture observations are needed (or have to be revitalized, see Robock et al (2000)). These observations would be helpful to further understand the connections between soil moisture and heat stress indices in eastern China.
Acknowledgments
This research is supported by the National Natural Science Foundation of China (grants 41425002, 41730645 and 51609230) and the National Youth Top-notch Talent Support Program in China. The work of P Groisman was supported by the Ministry of Education and Science of the Russian Federation (grant 14.B25.31.0026) to the P P Shirshov Institute for Oceanology. The meteorological dataset used in this study was developed by the Data Assimilation and Modeling Center for Tibetan Multi-spheres, Institute of Tibetan Plateau Research, Chinese Academy of Sciences.