

Abstract
It is unclear to what extent emissions of nitrous oxide (N2O) from drained histosols in the tropics may contribute to the atmospheric burden of greenhouse gases. In particular, there is a critical need to elucidate their magnitude in oil palm plantations on these soils. We examined spatio-temporal variations of N2O emissions from peat decomposition and nitrogen (N) fertilization in a plantation trial in Sumatra, which included three application rates: 0 (N0), 153 (N1) and 306 (N2) kg N ha−1 y−1. The spatially stratified sampling design distinguished the area around the palms which received fertilizer (9% of the surface) from the rest of the plot which was unfertilized. Annual emissions were substantial with rates of 22.1 ± 5.7, 12.8 ± 2.7 and 26.6 ± 5.7 kg N2O-N ha−1 in the N0, N1 and N2 treatments, respectively. These equal 9.3 ± 2.4, 5.4 ± 1.1 and 11.2 ± 2.4 Mg CO2eq ha−1 y−1, or 5–10 times emission rates in natural peatland forest. The site exhibited two persistent hotspots located in the unfertilized zone, contributing 33 and 46% of annual emissions in N0 and N2 while representing only 10% of the area sampled. The response of emissions to fertilization was exponential but restricted to the small N application area. At the plot scale and over the year, the impact of fertilized-induced emissions was minimal due to the prevalence of emissions from peat decomposition. Annual rates among treatments were similar when discarding the contribution of hotspots to evaluate N addition effect. High N2O emissions from peat decomposition in the tropics tend to be common within the restricted existing literature; which is in contrast with most recent IPCC emission factors. Our results emphasize the importance to integrate N2O emissions in greenhouse gas budgets of plantations on peat, despite the predominance of CO2 in total emissions.
Export citation and abstract BibTeX RIS

Original content from this work may be used under the terms of the Creative Commons Attribution 3.0 licence.
Any further distribution of this work must maintain attribution to the author(s) and the title of the work, journal citation and DOI.
1. Introduction
Agriculture contributes 10%–12% to worldwide greenhouse gas (GHG) emissions and 56% to global non-CO2 GHG emissions (IPCC 2014, USEPA 2013). The emissions from this sector are mainly in the form of nitrous oxide (N2O) (46%), followed by methane (CH4) (45%) and CO2 (9%). Nitrous oxide is classified as long-lived GHG and has a global warming potential 268 times higher than that of CO2 over a 20 year time horizon and when including climate–carbon feedbacks (Myhre et al 2013). The atmospheric N2O concentration in 2013 was 326 ppb, about 20% higher than its pre-industrial value (IPCC 2014). N2O emissions largely come from soil management including tillage and other cropping practices, such as fertilizer application (Baumert et al 2005). Emissions from synthetic fertilizers have increased more than nine‐fold from 0.07 to 0.68 GtCO2eq yr−1 over the period between 1961 and 2010 (Tubiello et al 2013).
Oil palm is one of the most rapidly expanding crops in the tropics (Fitzherbert et al 2008). Malaysia and Indonesia began to dominate oil palm production in 1966 (Poku 2002) and Indonesia has been the largest producer of crude palm oil since 2005. In 2006 the country had 4.1 million ha of oil palm plantations or 31% of the global plantation area, 7.2 million ha in 2010 and around 10.5 million ha in 2013 (Koh and Wilcove 2008, Bromokusumo and Jonn 2010, MoA 2014). This trend is likely to continue in the future as Indonesia aims at doubling palm oil production by 2020 (Koh and Ghazoul 2010). Plantations have been and are often developed on forestlands and conversion of primary forests into oil palm plantations accounted for more than 10% of the deforestation in Indonesia and Malaysia between 1990 and 2010 (Koh et al 2011) causing large biodiversity losses and contributing substantially to climate change (Hergoualc'h and Verchot 2011, Verchot et al 2012, Wijedasa et al 2017). At the same time, palm oil, is a key contributor to Indonesian economic growth, is an important source of edible oil for many countries, is used as a source of alternative fuel (Sheil et al 2009), and generates economic benefits for rural people (Sayer et al 2012). The Indonesian government allows the development of oil palm plantations on marginal lands such as peatlands; however, it forbids plantation on peat soils that are deeper than 3 m (RSPO 2012). Furthermore, oil palm is allowed to be grown only on sapric and hemic peat which have higher nutrient contents than fibric peat. A moratorium established in 2011 by the government of Indonesia and supported by Norway has put in place restrictions to halt the issuance of new licenses on primary forests and peatlands. Yet expansion in these areas is likely to continue, particularly for lands not included in the moratorium map and if economic incentives for environmental services such as carbon sequestration remains low while demand for palm oil continues to grow (Murdiyarso et al 2010, 2011, Koh et al 2011). In 2010 around 14.6% (1.2 million ha) of Indonesian oil palm plantations were established on peatlands, with the majority (85%) located in Sumatra (Miettinen et al 2012, MoA 2014).
Peat is considered to be a poor soil due to acidic conditions and limited nutrient availability (Murdiyarso et al 2010, Sabiham 2010), except for nitrogen which is high (Mutert et al 1999). Therefore N fertilizer for oil palm cultivated on peat is recommended to be applied at a lower rate than for cultivation on mineral soils (von Uexkull 2016). Notwithstanding, the fertilizer rate is high compared to rates applied to other major crops in Indonesia (Firmansyah 2010). Common nitrogen fertilizer doses for oil palm cultivated on peat in West Malaysia range from 50–100 N kg ha−1 y−1 for immature palms to 120–160 kg N ha−1 y−1 for mature ones (Mutert et al 1999) while in Indonesia application rates average 136, 170 and 102 kg N ha−1 y−1 for 3–8, 9–13 and 14–25 year old plantations, respectively (Darmosarkoro et al 2003). The addition of fertilizer to promote palm productivity is likely to foster peat mineralization and stimulate soil CO2 and N2O emissions (Hergoualc'h and Verchot 2014, Comeau et al 2016). Recent studies suggested an exponential increase in soil N2O emissions with increasing N fertilizer application rates especially when these exceed crop needs (Shcherbak et al 2014, van Lent et al 2015). On the other hand, the IPCC default emission factor is linear and amounts to 1% of the mineral fertilizer added (De Klein et al 2006). The direct emissions driven by peat mineralization were set by the IPCC at 1.2 kg N ha−1 y−1 for drained organic soils cultivated with oil palm (Drösler et al 2014).
The production and consumption of N2O in soils is mainly the result of microbial nitrification and denitrification activity (Smith et al 1982). Nitrification is the aerobic oxidation of ammonium (NH4+) to nitrate (NO3−) and denitrification is the anaerobic reduction of nitrate (NO3−) to dinitrogen (N2). Nitrous oxide is a gaseous intermediate in the reaction sequence of denitrification and a by-product of nitrification that leaks from microbial cells into the soil and ultimately to the atmosphere (Bouwman 1998, Smith et al 2003). Among the main controlling factors of the flux are soil water content, temperature, and nitrogen availability (Verchot et al 2006). Soil water and more specifically the water-filled pore space (WFPS) is a key indicator of oxygen availability in soils and has an important effect on N2O emissions because denitrification requires anaerobic conditions (Butterbach-Bahl et al 2013). The optimum WFPS for soil N2O emissions under tropical climates was estimated to be around 60% but emissions can remain high at values of 80% (van Lent et al 2015). Denitrification is known to be extremely temperature sensitive as are N mineralization and nitrification, albeit to a lower extent than denitrification (Butterbach-Bahl et al 2013). The magnitude of in situ N2O emissions variation associated with temperature changes may however remain low in the tropics wherever diurnal and seasonal fluctuations are limited.
Studies reporting soil N2O emissions from oil palm plantations are few (Melling et al 2007, Aini et al 2015, Sakata et al 2015, Hassler et al 2017) and some are based on very short sampling periods (Ishizuka et al 2005, Banabas 2007, Fowler et al 2011). Aini et al (2015) observed highly elevated emission rates following N fertilization in a plantation cultivated on mineral soil in Jambi, Sumatra. The studies by Melling et al (2007) and Sakata et al (2015), both carried out in Sarawak, Malaysia, are the only ones that were conducted in oil palm plantations on peat. However none of them spatially stratified the emissions according to fertilizer application practices. Neither did they capture the magnitude and dynamics of emissions following fertilizer application. As a consequence these studies did not differentiate fertilizer-induced emissions from those stemming from peat decomposition.
In this context, we set main objectives for this study to investigate N2O emissions from peat decomposition and fertilizer application in an oil palm plantation and to assess how different doses of N fertilizer affect the emission rate. We evaluated the annual long-term response to N application and the short-term response immediately following the fertilization events. In order to get an understanding of the biochemical processes underlying the emissions the key environmental variables controlling N2O emissions i.e. temperature, water table level, soil WFPS, mineral N content, and N mineralization and nitrification rates were monitored concomitantly with the fluxes.
2. Materials and methods
2.1. Site description
The study was conducted at an oil palm plantation located at Arang-Arang, Jambi district, Sumatra, Indonesia (1°38' S, 103°54' E). Long-term records from the Sultan Taha airport station in Jambi indicate an average annual air temperature of 26.5 °C during 1989–1997 and an average annual rainfall of 2466 mm y−1 during 1951–1997. The driest months usually occur from June to August (Siderius 2004). The peat at the research site is deep (>8.5 m) and has been classified as Folic Hemic Histosol dystric drainic following the IUSS Working Group WRB (2006) classification (Comeau et al 2013). The site was cleared of native vegetation by fire in 2004 and planted in December 2009 at a density of 149 palms ha−1 (8.8 m between palms in a triangular design). Additional land clearing fires may have taken place between first clearance and planting, but there are no records. The peat surface at the site is relatively flat as a result of compaction during land preparation. The water table depth is managed through a drainage system to be maintained at 60 cm below the soil surface; a level suitable for oil palm growth. Primary drainage canals are deep (>400 cm), secondary and tertiary canals are about 150 and 75 cm deep, respectively.
2.2. Experimental plots
The plots were located within a 11.7 ha long-term fertilization trial (see figure S1 in the supplementary material available at stacks.iop.org/ERL/12/104007/mmedia) using a 33 × 2 factorial design that included three doses of urea (N0-N1-N2), three doses of rock phosphate (P0-P1-P2), three doses of KCl (K0-K1-K2) as main treatments, plots were split with two doses of crushed limestone (Ca0-Ca1). In order to isolate the effect of N application, the three plots selected for this study all received the same applications of P (1 kg P palm−1 y−1 as rock phosphate), K (1.5 kg K palm−1 y−1 as KCl) and Ca (no application). These rates are consistent with current industry practices. Each plot corresponded to an N treatment as follows: The N0 plot received no N fertilizer and the N1 and N2 plots received an N application rate that gradually increased with the age of the palms until they reached maturity (table 1). The N2 dose was the double of the N1 dose; the latter treatment is representative of present industry practices. The palms received fertilizer for the first time 3 months after planting. They were fertilized twice a year in March/April and September/October until they reached full production at about 3 years. Afterwards, they were fertilized once a year in April.
Table 1. Rate of fertilization applied in the N1 treatment of the oil palm plantation on peat, Jambi, Sumatra, Indonesia.
| Fertilization rate | ||||
|---|---|---|---|---|
| Age of palms (months) | Year | Month | g urea palm−1 | kg N ha−1 y−1 |
| 3 | 2010 | March | 100 | 21 |
| 9 | September | 200 | ||
| 15 | 2011 | March | 300 | 48 |
| 21 | September | 400 | ||
| 27 | 2012 | March | 750 | 103 |
| 34 | Octobera | 750 | ||
| 40 | 2013 | Aprila | 1500 | 103 |
aFertilizations during which intensive sampling was carried out.
2.3. Sampling design and soil flux measurement
The soil N2O fluxes were measured monthly from October 2012 until September 2013. They were sampled more intensively following the 2 N fertilization events that took place on 23 October 2012 and 18 April 2013. Other nutrients were brought separately at different dates. During these events gas samples were collected 1 day before fertilization (d − 1), the day of the fertilization (d), daily during 1 week after fertilization (d + 1 − d + 7) and then every 2 d until d + 29. Thus in total, there were 19 measurement days over a 30 day fertilization period during both intensive sampling campaigns. Flux data were collected in the field between 9 am and 2 pm. Previous work on the site showed no diurnal variation in soil trace gas fluxes (Comeau et al 2014) however for precaution and with the objective to capture any potential diurnal variability the order of plot sampling was randomized.
During the fertilization applications, urea was homogeneously spread by hand within a 1 m radius around the trunk of the palms in the N1 and N2 treatments. In the first fertilization experiment the fertilizer was applied as granules, whereas in the second one the granules were dissolved in distilled water before being applied to the soil in order to minimize N volatilization. We made a distinction in our sampling design between the area close to the palms (CP) which received fertilizer and the area further from the palms (FP) where fertilizer was not applied, as this application method is commonly practiced in oil palm plantations. The CP area consisted of a 1 m radius circle around a palm (on average 6.2 m2 including the palm basal area) from which was subtracted the palm basal area (0.5 m2 on average). Considering that the triangular planting design was perfectly equilateral, we estimated that the CP and FP areas represented, respectively, 9 and 91% of each plot area. The fertilization rate applied to the chambers located in the CP area of the N1 and N2 treatments was calculated as the surface ratio between the chamber and CP multiplied with the rate applied to the CP area. The same spatial stratification as in N1 and N2 was implemented in the N0 treatment although this plot did not receive N fertilizer; to account for root effects.
Soil fluxes were measured by the static chamber technique (Verchot et al 1999) using opaque white PVC chambers (diameter and height of 26 cm and 30 cm, respectively). Five replicate chambers were permanently installed at each position (CP and FP) in each N treatment plot. These were inserted into the soil to a 2–3 cm depth, 1 month before the first data collection. Chambers in the CP area were located at a 50 cm distance from the trunk of the palm while in the FP area chambers were located at mid-distance between two palms (following the design by Aini et al (2015)). The procedures for gas sampling, analysis and flux computation are presented in section S.1.1. of the supplementary material.
Cumulative emissions for each fertilization period (October 2012 and April 2013) were calculated using data from the day of fertilizer application until 29 d after fertilization, for a total of 29 d. For each spatial position in each N treatment cumulative annual and post-fertilization emissions were computed by linear interpolation between measurement dates. Cumulative emissions over the 344 day monitoring period were annualized by considering 365 days in a year. Cumulative emissions outside of fertilization periods were calculated by subtracting the two post-fertilization cumulative emissions from the annual emissions. The N2O fluxes were further extrapolated to the plot scale using the proportion occupied by each area (9% CP and 91% FP) in the plot. Emissions of N2O were converted to CO2eq using the factor 268, which corresponds to a global warming potential over a 20 year time horizon including climate–carbon feedbacks from Myhre et al (2013). A 20 year time horizon was preferred over a 100 year time horizon given the 25 year rotational period of oil palm plantations.
2.4. Environmental parameters
Rainfall was monitored daily while air pressure, air temperature, soil temperature, soil moisture and water table level data were collected concomitant with N2O measurements. Root density and soil properties including pH, C and N content, available P, base saturation, CEC and bulk density were analyzed at the end of the experiment. Information on sampling methods, analytical methods and instruments used is available in section S.1.2. of the supplementary material.
2.5. Nitrogen availability
N availability was determined by measuring inorganic N pools and the rates of net mineralization and nitrification in February 2013—in the absence of fertilization and in April 2013—following the fertilization. Soil sampling and incubation methods are described in section S.1.3. of the supplementary material.
2.6. Statistics
Statistical analysis was performed with the SPSS software v.19, with a probability level of 5% to test the significance of treatments effects. Methods used for comparing treatments, spatial positions and periods and for establishing relationships between variables are described in section S.1.4. of the supplementary material.
Identification of emission hotspots was conducted using boxplot analysis (SPSS v.19 SPSS Inc. USA). A chamber was qualified as a hotspot whenever it displayed over the measurement period at least three extreme flux values (i.e. values > three times the interquartile range from the upper edge of the 50% percentile; van den Heuvel et al (2009). The analysis was performed using emission rates measured outside of fertilization periods in order to not confound between spatial and temporal hotspots.
3. Results
Soil properties and climate results are available in section S.2. of the supplementary material.
3.1. Soil nitrogen concentrations, mineralization and nitrification rates
Inorganic-N pools were dominated by NH4+ in all N treatments (P < 0.007), at both spatial positions (P < 0.0001) and during the 2 observation periods (February, absence of fertilization and April, after fertilization) (P < 0.03) (figures 1(A) and (B)). Net mineralization rates were higher than nitrification rates (P = 0.03) (figure 1(C) and (D)).
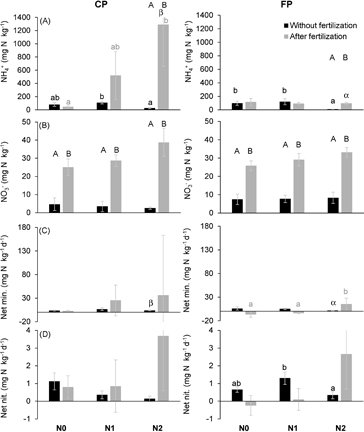
Figure 1. Soil ammonium (NH4+) (A) and nitrate (NO3−) (B) contents, net mineralization (C) and nitrification (D) rates of the N0, N1 and N2 treatments in the oil palm plantation trial on peat. The results differentiate two spatial positions: close to palm (CP) and further from palm (FP) and two periods: without (February 2013) and after fertilizer application (April 2013). Note the different scales between (A) and (B), and between (C) and (D). Error bars are standard errors. Letters (a, b) indicate a significant difference between N treatments, within a spatial position and a period. Symbols (α, β) indicate a significant difference between spatial positions, within an N treatment and a period. Letters (A, B) indicate a significant difference between periods, within a spatial position of an N treatment.
Download figure:
Standard image High-resolution imageSoil NH4+ content without fertilizer application was overall high (74 ± 19 mg N kg−1 on average). It was significantly lower in the N2 than in the N1 treatment in the absence of fertilization at both spatial positions (figure 1(A)). Following the fertilization, the concentration was significantly higher in the N2 than in the N0 treatment at the close to palm (CP) position whereas it was similar between treatments at the further from palm (FP) position. After fertilizing NH4+ content was significantly higher at the CP than at the FP position in the N2 treatment only. The comparison between the incubations of soils without and with fertilizer indicated that in N2 NH4+ content was significantly higher with than without fertilizer not only in the CP area where the fertilizer was applied but also in the FP area. This suggests urea leakage from the CP to the FP area in the N2 treatment.
Soil NO3− contents were systematically and significantly higher with fertilizer application than without it (figure 1(B)). The fact that this was true regardless of the spatial position or the N treatment likely indicates a seasonal rather than a fertilization effect.
The net mineralization rate was significantly higher close to palm than further from palm in the N2 treatment, in the absence of fertilizer application (figure 1(C)). Following fertilizer application the net mineralization rate was higher in N2 than in N0 and N1 in the FP area. Contrary to the observations from incubations without fertilizer, N was immobilized following fertilizer application in the FP area of the N0 and N1 treatments whereas the opposite happened for the N2 plot. The difference between the N2 and the other treatments arise from one single chamber displaying a net N mineralization rate 30 times higher than the average rate from the other chambers in the same area, albeit with an initial mineral N content similar to other chambers.
The rate of nitrification also displayed a significant difference between treatments, but only at the FP position, with a lower value in the N2 plot as compared to the N1 one (figure 1(D)).
3.2. N2O emissions
The emissions of N2O are first presented outside of fertilization periods and correspond to emissions associated with peat decomposition. Second we present the emission rates during the 29 d following the October (23/10–21/11/2012) and April (18/4–15/5/2013) fertilizations; emissions which are from peat decomposition plus the fertilizer. Third, the cumulative emissions are detailed per spatial position including and excluding the contribution of hotspots.
3.2.1. Emissions outside of fertilization periods
Monthly averages of soil N2O emissions in the CP and FP areas all together were in the range −3 ± 4 g N ha−1 d−1 (N0CP in August) to 296 ± 114 g N ha−1 d−1 (N0 FP in December) with very high spatial and temporal variability (figure 2(A)). December was the month displaying the highest average emission rate across treatments and areas followed by July, while October (before fertilizing) exhibited the lowest emission rate. The N2 treatment emitted N2O at a significantly higher rate than the two other treatments in the CP area (P = 0.004; table 2). It also emitted at a higher rate than the N1 treatment in the FP area (P = 0.049). In all treatments the emissions were significantly (P < 0.02) higher FP than CP, by a factor of more than 2.
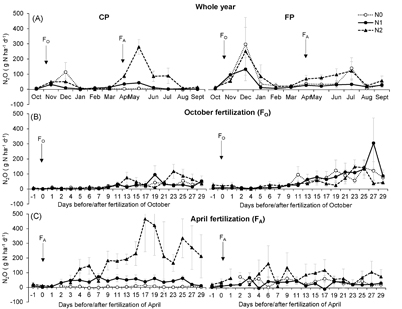
Figure 2. Averages of soil N2O fluxes over the year (A) and after the fertilizations of October (B) and April (C) in the close to palm (CP) and further from palm (FP) areas of the N0, N1 and N2 treatments of the oil palm plantation fertilization trial. The arrows indicate a fertilization event, error bars indicate standard errors (SE).
Download figure:
Standard image High-resolution imageThrough the boxplot analysis, two chambers were identified as being emission hotspots. Both of them were located FP, one was in the N0 treatment, the other was in the N2 treatment. These hotspots emitted at an average rate (135.3 ± 94.3 and 200.5 ± 69.4 g N ha−1 d−1 in N0 and N2, respectively; figure 3) four and six times higher than the average rate from the other chambers in the FP area of their respective treatment (table 2). The common feature of the two hotspots was linked to an index of N availability. They displayed net mineralization rates much higher than that of all other chambers in the same area and treatment. The rate for the N0 hotspot in the absence of fertilization (17.1 mg N kg−1 d−1) was five times higher than the average rate of the other chambers located FP (3.2 ± 2.8 mg N kg−1 d−1). The rate for the N2 hotspot following fertilizer application (66.5 ± 2.8 mg N kg−1 d−1) was, as already mentioned in section 3.1, 30 times higher than the other FP chambers average (2.2 ± 0.7 mg N kg−1 d−1).

Figure 3. Average chamber N2O emission rate outside of fertilization periods in the oil palm plantation trial. The chambers were located close to palm (CP) and further from palm (FP) in each N0 (grey bar), N1 (checker board) and N2 (black bar) treatment.
Download figure:
Standard image High-resolution image3.2.2. Post-fertilization emissions
During the post-fertilization period of October, soil N2O emissions increased with time in both areas of all treatments (P < 0.0001) (figure 2(B)). This increase was associated with rainfall starting on day 3 after fertilizer application and intensifying towards the end of the monitoring period (figure S3 in the supplementary material). The water table level also significantly increased as the result of rainfall (P = 0.0005). The emissions peaked once 19 d after fertilization in the CP area of the N1 treatment; they peaked twice 13 and 23 d after fertilization in the CP area of the N2 treatment. At this spatial position the average emission rate in the N2 treatment was significantly higher than in the two other treatments (table 2). The punctually high emission rates observed in the FP area of the N0 treatment were essentially due to the hotspot chamber emitting at rates > 250 g N ha−1 d−1 on d + 11, + 19, + 25 and + 27. Over the post fertilization period this hotspot emitted at a rate (134.8 ± 30.2 g N ha−1 d−1) four times higher than the average rate of other chambers in the same area and treatment (table 2). The same occurred in the FP area of the N2 treatment where the hotspot mainly was at the origin of the large emissions and emitted at a rate (96.2 ± 18.9 g N ha−1 d−1) four times that of the average rate of other chambers in the same area and treatment (table 2). The peak observed on d + 27 in the FP area of the N1 treatment may come from fertilizer leakage from a chamber located CP to its neighbor located FP. The emission rate in the FP area was not significantly different between treatments. Following the trend observed outside of fertilization periods soil emissions of N2O were significantly higher FP than CP in the N0 (P = 0.009) and N1 treatments (P = 0.0002) whereas this wasn't the case in the N2 treatment (P = 0.24).
During the post-fertilization period of April the rainfall pattern was erratic as was the pattern in soil WFPS and water table level, especially in the first 15 d following the fertilization for this last variable (figure S3 in the supplementary material). Soil emissions of N2O remained steady in the CP area of the N0 treatment while in the same area of the N1 and N2 treatments the emissions started increasing as of d + 2 following fertilizer application reaching extremely high average rates in the N2 treatment (figure 2(C)). The average emission rate in the CP area was significantly different between each treatment, following the order N2 > N1 > N0 (P < 0.0001; table 2). In the FP area the average emission rate was similar across treatments. The hotspots emitted at rates (100.5 ± 16.7 and 276.1 ± 42.3 g N ha−1 d−1 in N0 and N2, respectively) 5 and 11 times higher than the rate from other chambers in the same area (table 2). Soil emissions of N2O were significantly higher in FP than in CP in the N0 treatment; while the opposite was observed in the N2 treatment (P < 0.0001). There was no difference in emission rate between the two spatial positions in the N1 treatment (P = 0.19).
Table 2. Average and cumulative annual N2O emissions ± SE outside of fertilization periods (307 d) and during the two post fertilization periods (29 d each) in the N treatments of the oil palm plantation fertilization trial. Emission rates are presented for each spatial position (CP: close to palm; FP: further from palm) and at the plot scale (i.e. 91% N2OFP + 9% N2OCP). Emission rates without the contribution of the hotspots in N0 and N2 are displayed.
| Average emission rate (g N ha−1 d−1) | Annual emission rate (kg N ha−1 y−1) | |||||||||||||||||||
|---|---|---|---|---|---|---|---|---|---|---|---|---|---|---|---|---|---|---|---|---|
| Outside fert. | Post fert. October | Post fert. April | Per spatial position | Plot-scale | Plot-scale no hotspot | |||||||||||||||
| N0 | CP | 13.2 ± 6.9 | a | α | 21.4 ± 3.2 | a | α | 4.6 ± 2.0 | a | α | 5.7 ± 2.0 | a | α | 22.1 ± 5.7 | b | 14.7 ± 3.3 | a | |||
| FP | 54.9 ± 19.5 | ab | β | 53.1 ± 8.4 | β | 38.2 ± 6.6 | β | 23.7 ± 6.2 | b | β | ||||||||||
| FP no hotspot | 36.6 ± 10.6 | β | 32.7 ± 5.1 | α | 21.4 ± 5.4 | β | 15.6 ± 3.6 | a | β | |||||||||||
| N1 | CP | 6.5 ± 1.5 | a | α | A | 20.6 ± 4.9 | a | α | B | 40.7 ± 5.1 | b | C | 4.8 ± 0.9 | a | α | 12.8 ± 2.7 | a | |||
| FP | 27.1 ± 8.6 | a | β | A | 62.6 ± 13.0 | β | B | 27.5 ± 5.2 | A | 13.6 ± 2.9 | a | β | ||||||||
| N2 | CP | 25.2 ± 6.9 | b | α | A | 31.1 ± 5.5 | b | A | 200.9 ± 30.9 | c | β | B | 19.3 ± 3.8 | b | α | 26.6 ± 5.7 | b | 14.5 ± 3.8 | a | |
| FP | 67.6 ± 18.3 | b | β | 40.1 ± 6.2 | 78.0 ± 15.4 | α | 27.3 ± 6.3 | b | α | |||||||||||
| FP no hotspot | 34.4 ± 10.9 | α | 25.7 ± 4.7 | 24.2 ± 5.1 | α | 14.0 ± 4.1 | a | α | ||||||||||||
Letters (a, b, c) indicate a significant difference between N treatments, within a spatial position and a period. Symbols (α, β) indicate a significant difference between spatial positions, within an N treatment and a period. Letters (A, B, C) indicate a significant difference between periods, within a spatial position of an N treatment. In the absence of a significant difference no letters are displayed. n is about 55 outside of fertilization periods, 90 during post-fertilization periods. Cumulative emission rates are based on 47 sampling days.
The fertilization rates applied to the N1 and N2 treatments during the fertilization of April 2013 were twice the rates applied during the fertilization of October 2012 (table 1). As a consequence soil average N2O emission rates in the CP area were significantly higher during the second than during the first fertilization in both treatments (P < 0.0001) (table 2). The average N2O emission rates in the FP area were, on the other hand, similar during both fertilization periods in the N0 and N2 treatments.
3.2.3. Annual emissions
Plot-scale soil annual N2O emissions were remarkably high in all treatments (table 2). They were similar in the N0 and N2 treatments and lower in the N1 treatment. This difference arose essentially from the greater cumulative emissions in the FP area of the N0 and N2 treatments which were about the double of that in the N1 treatment. Annual emissions in the N0 and N2 treatments, excluding the hotspots, resulted in rates within the same magnitude of the rate in the N1 treatment. The hotspots which represent 10% of the area sampled contributed 33 and 46% of annual emissions at the plot scale in the N0 and N2 treatments.
The contribution of post-fertilization emissions to annual emissions was significant in the CP area of the fertilized treatments (41 and 37% in N1 and N2), especially during the second fertilization (27 and 31% in N1 and N2). The contribution of post-fertilization emissions to annual emissions in the CP area of the unfertilized N0 treatment (16%) was less than half that of the N1 and N2 treatments. Notwithstanding, at the plot scale post-fertilization emissions represented 13, 22 and 15% of annual emissions in the N0, N1 and N2 treatments, respectively, which is similar to the contribution of the duration of the two post-fertilization periods (58 d) to one year. Therefore even though fertilization increased significantly soil fluxes of N2O over prolonged periods in the CP area of the N1 and N2 treatments, the effect at the plot-scale and over the year was minimal due to very high background emissions from peat decomposition.
3.3. Controlling factors of soil N2O fluxes
The relationship explaining most of the variation in N2O emissions was developed from cumulative emissions during each post-fertilization period in the CP area of each treatment (table 3, equation (1)). It indicates an exponential response of soil N2O emissions to the amount of N applied. The second best model relates to average daily N2O fluxes within both spatial positions (equation (2)) which denotes increasing emission rates with increasing nitrification rate, soil temperature and NH4+ content. Average annual N2O emission rates within spatial positions were found to be enhanced as soil C:N ratios were lower (equation (3)) and as soil N contents were higher (equation (4)). Soil NH4+ content, nitrification and mineralization rate alone were also significantly and positively correlated to daily N2O emission rate in each individual chamber (equations (5)−(8)). Average daily soil emissions of N2O within each spatial position were partially and exponentially controlled by the water table level only in the N1 and N2 treatments (equations (9)−(10)).
4. Discussion
Despite having a global warming potential about 270 times that of CO2 and being known as highly responsive to mineral N application, N2O remains a forgotten gas in many studies from the tropics, notably in oil palm plantations. The results by Stichnothe and Schuchardt (2011) for plantations on mineral soil denote a share of N2O emissions in palm oil production that varies considerably (16%−42%) according to plantation management (figure 4). Estimates based on current IPCC CO2 and N2O emission factors for peat soil suggest that N2O makes only a small contribution to total emissions. When we substitute the average N2O emission rate from the N0, N1, and N2 plots for the IPCC N2O emission factors, the role played by N2O is significant (12%–15%) and cannot be neglected. In a land-use change perspective, which is disconsidered in the results from figure 4, it is worthwhile noting that average N2O emissions from natural peat forests of 2.7 kg N ha−1 y−1 or 1.1 Mg CO2eq ha−1 y−1 (Hergoualc'h and Verchot 2014) are 5 to 10 times lower than the emission rates measured in this study.

Figure 4. Emissions of GHG associated with palm oil production, as analyzed by a life cycle assessment (LCA) based on data from Stichnothe and Schuchardt (2011). Emissions considered in this assessment are from: the plantation, transport of raw material, the mill, dumping or composting of empty fruit bunches (EFB), and effluent ponds. In the worst case scenario EFB are dumped and palm oil mill effluents are stored in ponds; in the best case scenario residues are treated and returned to the plantation. The results for mineral soils are from Stichnothe and Schuchardt (2011). We constructed four additional scenarios for peat soils where the plantation emisions from the original study were replaced by IPCC CO2 default emission factors for drained organic soils (Drösler et al 2014). Additionally, scenarios labeled 'IPCC' or 'here' use the IPCC default emission factors and average emissions from the N0, N1 and N2 treatments, respectively. Sources and calculation methods are described in section S.1.5. of the supplementary material.
Download figure:
Standard image High-resolution imageCurrent mechanistic understanding of soil N2O emissions in tropical peatlands remains limited and their magnitude is poorly characterized (van Lent et al 2015). To evaluate the representativeness of the emissions from this oil palm plantation we examined the most recent synthesis on soil emissions of N2O in the tropics (van Lent et al 2015). The analysis points out that among the 9% of studies (40 cases) reporting high annual emission rates (>9 kg N ha−1 y−1); 25% were from unfertilized sites of which 80% were from drained peat soils (figure 5(A)). Thus, the present and limited literature suggests that N2O emissions from peat decomposition in the tropics can be substantial and that our results are no exception. With respect to emissions in oil palm plantations, studies encompassing monthly sampling over a year are very few (four studies). The emissions tends to be much higher in peat than in mineral soils in both fertilized and unfertilized plantations (figure 5(B)). It seems therefore that the IPCC emission factors for peat decomposition in the tropics which are < 5 kg N ha−1 y−1 (Drösler et al 2014) and more specifically the one for oil palm plantation (1.2 kg N ha−1 y−1) may be underestimated and would need to be revised following collection of additional data. Higher N2O emissions in drained peat soils compared to mineral soils is consistent with higher emissions from lower pH soils where N2O reductase inhibition during denitrification results in an increase of the N2O:N2 ratio (Knowles 1982). Furthermore high concentrations of electron donors (soil organic C) such as in peat soils may result in rapid oxygen depletion favoring denitrification (van den Heuvel et al 2009) even though the dominant product of denitrification (N2O or N2) will depend upon the relative availability of electron donors versus electron acceptors (NO3−) (Firestone et al 1980).

Figure 5. Relative frequency of annual emissions of N2O in the tropics from the dataset of van Lent et al (2015) updated with the data by Sakata et al (2015) (a) and emissions of N2O from oil palm plantations (b) including this study with and without hotspot (noHS), Melling et al (2007) (1), Sakata et al (2015) (2), Aini et al (2015) (3) and Hassler et al (2017) (4). F denotes N-fertilized plantations.
Download figure:
Standard image High-resolution imageCapturing hot moments induced by fertilization in oil palm plantations requires a sampling design that integrates management practices. The local application of fertilizer around palm trunks requires differentiating the fertilized area from the non-fertilized area between the palms. This spatial stratification is also needed to appropriately scale-up the emissions estimates. In addition, given the erratic nature of fertilizer-induced pulses in emissions for prolonged periods (Hergoualc'h et al 2008), sampling needs to be intensive for at least a month after fertilizer application. Our results obtained from such a design confirmed the exponential nature of the response of N2O emissions to N fertilizer application with a magnitude of the effect more pronounced than that evaluated by Shcherbak et al (2014) or the IPCC (De Klein et al 2006) (figure 6). Notwithstanding this effect was significant only in the fertilized area (CP) which represents 9% of the plot and only during the two post-fertilization periods of 29 d which account for 16% of the year. On a plot and annual scale there was no difference in annual N2O emissions between treatments (table 2, excluding the contribution of hotspots) because high emissions from peat decomposition were prevalent. Similarly, Takakai et al (2006) did not find a significant relationship between annual N applied and N2O emissions in croplands and a grassland on drained peat of Central Kalimantan; where emissions from peat decomposition were substantial. The high emission factors proposed by Sakata et al (2015) in an oil palm plantation on peat were derived from measurements taken in the fertilized area exclusively and likely overestimate actual plot scale emissions induced by fertilization.

Figure 6. Response of cumulated post-fertilization N2O emissions in the close to palm (CP) area to the average Napplied compared to the response obtained using the models by Shcherbak et al (2014) and the IPCC (De Klein et al 2006).
Download figure:
Standard image High-resolution image
The high spatial variability of soil N2O emissions has been observed from the microscale to the regional one but appears to be more substantial at smallest scales and to be linked to denitrifying microsites (Hénault et al 2012). The presence of hotspots is common but not consistently evaluated (Groffman et al 2009). Hotspots are attributed to a series of plant and soil factors such as rooting patterns, soil structure (aggregates), topography and hydrological flows that govern oxygen diffusion and the fate of mineral N. In artificially drained agricultural fields, variation in drainage paths and lack of plant cover can result in significant variation in soil moisture and N dynamics. The hotspots encountered in this study did not display an air temperature, soil temperature, bulk density or porosity significantly different from the average of other chambers in the respective area and treatment. The hotspot in N0 exhibited a lower live root density than the average of other chambers in the same area but the opposite was true for the hotspot in N2. Both hotspots were located further from palm, where roots are potentially less active in taking up nutrients; as demonstrated by Nelson et al (2006). Both hotspots exhibited, during in vitro incubation, a net mineralization rate much larger than the rate from other chambers in the same area despite similar initial mineral-N contents. This suggests that the hotspots were also governed by microbial or fungal community composition. The hotspots contributed substantially to annual emissions (33%−46%) while representing a very small sampled area (10%). Such a disproportional contribution was also observed by van den Heuvel et al (2009) in riparian buffer zones. Given the potential high contribution of hotspots to annual emissions, investigation in a particular ecosystem needs to consider the type and scale of hotspots that might occur before starting a study and to establish an experimental design allowing heterogeneity quantification from the outset (Groffman et al 2009).
The conceptual hole-in-the-pipe model (Firestone and Davidson 1989) proposes that the variation in N-oxide emissions from the soil is mainly controlled by N availability and soil water content. Common indexes of N availability include net mineralization and nitrification rates while the WFPS controls the N2O:NO flux. Soil fluxes of NO were not measured in the present study but variations in N2O were positively related to different indices of N availability (NH4+ content, net mineralization and net nitrification rates) individually or in combination with soil temperature (table 3). A positive correlation between N2O emissions and net mineralization and net nitrification rates is consistent with observations by Davidson et al (2000) and Ishizuka et al (2005) across different land uses in the tropics and Sumatra, Indonesia, respectively. Whereas NH4+ is generally found to be negatively correlated to N-oxide emissions (Davidson et al 2000, Hadi et al 2005, Hergoualc'h and Verchot 2014) the positive correlation found here arise from the increase in N2O emissions following urea application. The predominance of NH4+ in mineral N pools together with the robust correlation between annual N2O emissions and C:N supports the assumption that N is the main limiting factor for N2O emisisons in drained histosols (Klemedtsson et al 2005). The relative proportion of NO:N2O:N2 is usually determined by the WFPS; but the N2O flux alone is also controlled by WFPS levels, especially in non-fertilized land uses (van Lent et al 2015). One reason why we did not find a significant relationship linking N2O emission to WFPS may come from a shortcoming in the experimental design with measurements of WFPS taken without considering the spatial stratification (CP, FP) put in place for N2O monitoring. As observed by Aini et al (2015) and Hergoualc'h et al (2008) in, respectively, oil palm and coffee plantations, the WFPS is generally higher further than closer to plants due to differences in bulk density and water uptake by root plants. The high emissions from peat decomposition observed at our site is likely a combination of optimal soil moisture conditions for N2O production (60% WFPS) (van Lent et al 2015) together with high net N mineralization and intermediate net N nitrification rates (4.5 and 0.7 mg N kg−1 d−1 on average, respectively, outside of fertilization periods) as compared to rates in the tropics (Davidson et al 2000). The site is also subject to intense precipitation events likely promoting nitrate leaching to deeper soil layers and subsequently enhancing denitrification.
Table 3. Relationships between soil fluxes of N2O and soil and environmental variables either across N treatments, or within N treatments (N0, N1, N2) or spatial position (CP: close to palm; FP: further from palm). The models are presented with slope (SE) and intercept (SE) with their level of significance.
| Dataset | Model | R2 | n | Equation |
|---|---|---|---|---|
| Cumulative emissions over post fertilization periods | N2O CP = 0.3268⁎⁎ (0.0687) × exp [0.0131⁎⁎⁎ (0.001) × Napplied] | 0.99 | 6 | (1) |
| Average per spatial position, daily time step except during the April fertilizationa | N2O = 13.81⁎ (5.77) × Nit + 40.49⁎ (12.5)× SoilT + 0.12⁎⁎⁎ (0.02) × NH4+—1138⁎ (352) | 0.95 | 12 | (2) |
| Average per spatial position, annual time step | N2O = −6.8⁎ (1.5) × C:N—282.5⁎ (51.7) N2O = 110.5⁎ (29.6) × Ncontent—151.0⁎ (53.2) | 0.84 0.78 | 6 6 | (3) (4) |
| All chambers, daily time step except during the April fertilizationa | N2O FP = 2.37⁎⁎⁎ (0.56) × Min + 25.83⁎⁎ (8.05) | 0.39 | 30 | (5) |
| N2O FP = 11.88⁎ (4.43) × Nit + 23.08⁎ (9.67) | 0.20 | 30 | (6) | |
| N2O = 0.06⁎⁎⁎ (0.02) × NH4+ + 25.46⁎⁎ (9.00) | 0.22 | 59 | (7) | |
| N2O = 10.14⁎⁎ (3.38) × Nit + 28.65⁎⁎ (9.39) | 0.14 | 59 | (8) | |
| Average per spatial position, daily time step | Ln(N2O + 9) N2 = 0.04⁎⁎⁎ (0.01) × WT + 6.15⁎⁎⁎ (0.50) | 0.23 | 66 | (9) |
| Ln(N2O + 9) N1 = 0.02⁎⁎ (0.01) × WT + 4.56⁎⁎⁎ (0.37) | 0.11 | 68 | (10) |
⁎ P < 0.05, ⁎⁎ P < 0.01, ⁎⁎⁎ P < 0.001. Soil N2O fluxes are expressed in g N ha−1 d−1 except for the relationship for cumulative emissions over the post-fertilization periods for which the unit is kg N ha−1 29 d−1. Napplied is the amount of fertilizer applied i.e. 0, 52, 105 kg N ha−1 in N0, N1 and N2 in October; 0, 100, 223 kg N ha−1 in the same treatments in April. aSince soil mineral N content, mineralization and nitrification rates were measured once during the post fertilization of April, the other variables were averaged over the 29 d following fertilizer application for the purpose of relationship testing. Soil NH4+ contents are in mg N kg−1 d.m., net nitrification (Nit) and mineralization (Min) rates in mg N kg−1 d.m. d−1, soil temperature (SoilT) in °C, water table level in cm with a negative value indicating that the water is below ground.
5. Conclusion
Given the high global warming potential of N2O, the expanses of drained peatlands in Southeast Asia and the increasing development of oil palm plantations on peat, it is critical to put more effort in quantifying N2O emissions in these systems, in evaluating their spatio-temporal variability and in investigating the mechanisms at their origin. Appropriate experimental designs that incorporate plantation management practices and allow heterogeneity quantification need to be put in place. Ideally soil emissions of N2O should be monitored together with other main components of the soil N budget such as nitrate leaching. Strategies to mitigate N2O emissions from soils exist but their success depend upon an appropriate knowledge of N pathways within the ecosystem.
Acknowledgments
We would like to thank PT Bakrie Sumatera Plantation in particular its research division BARI for providing the research site and facilitating field work. We thank Novi Sari Wahyuni for analyzing the gas samples and Ahmad Fadli, Ferdianto Sitompul, Meli Sitomorang and Frannivo Afriansyah for assisting with the field work. We are grateful to Xavier Bonneau of CIRAD for providing valuable information on oil palm agronomy and helping for plot selection at the research site. This study was generously supported by the governments of Norway (grant agreement # QZA-12/0882), Australia (grant agreement # 63560), United States of America (grant MTO-069018) and the European Commission (grant agreement # 265286). This work was carried out as part of the CGIAR programs on Trees, Forests and Agroforestry (FTA) and Climate Change, Agriculture and Food Security (CCAFS). We would also like to thank the anonymous reviewers who provided comments on earlier versions of this letter.