

Abstract
Southern Ocean sea-ice cover exerts critical control on local albedo and Antarctic precipitation, but simulated Antarctic sea-ice concentration commonly disagrees with observations. Here we show that the radiative effects of precipitating ice (falling snow) contribute substantially to this discrepancy. Many models exclude these radiative effects, so they underestimate both shortwave albedo and downward longwave radiation. Using two simulations with the climate model CESM1, we show that including falling-snow radiative effects improves the simulations relative to cloud properties from CloudSat-CALIPSO, radiation from CERES-EBAF and sea-ice concentration from passive microwave sensors. From 50–70°S, the simulated sea-ice-area bias is reduced by 2.12 × 10⁶ km2 (55%) in winter and by 1.17 × 10⁶ km2 (39%) in summer, mainly because increased wintertime longwave heating restricts sea-ice growth and so reduces summer albedo. Improved Antarctic sea-ice simulations will increase confidence in projected Antarctic sea level contributions and changes in global warming driven by long-term changes in Southern Ocean feedbacks.
Export citation and abstract BibTeX RIS

Original content from this work may be used under the terms of the Creative Commons Attribution 3.0 licence.
Any further distribution of this work must maintain attribution to the author(s) and the title of the work, journal citation and DOI.
1. Introduction
The Southern Ocean and Antarctica are climatically important due to Antarctic ice-sheet melt contributing to sea-level rise, changes in sea-ice cover contributing to albedo feedbacks, and the importance of oceanic heat uptake in this region for global energy balance and heat transport. The area of sea-ice in the Southern Ocean changes hugely with the seasons [van den Broeke 2004, Simmonds 2015] and is currently poorly represented in current climate models. Recent studies have shown that the Coupled Model Intercomparison Project, phase 5 (CMIP5) global climate models (GCMs) do not show an overall improvement in the simulation of Antarctic sea-ice compared to those in the older Coupled Model Intercomparison Project, phase 3 (CMIP3) [Turner et al 2013, 2014, Mahlstein et al 2013, Lefebvre and Goosse 2007, Simmonds 2015, Zunz et al 2013]. We focus on the mean state here, although we note that most CMIP5 models simulated retreating Antarctic sea-ice over 1979–2005, in contrast to the observed statistically significant increase in most months [Simmonds 2015]. Some studies have shown that these changes are within the natural variability simulated by CMIP5 [Meehl et al 2016, Polvani and Smith 2013, Gagné et al 2015], and the observed increase is now less robust in many months following reductions in 2016 and 2017. We provide a further discussion on trends in supplementary information but otherwise do not address them.
Sea-ice cover strongly affects surface energy budgets through its high albedo and by restricting heat and moisture exchange between the ocean and atmosphere and simulations indicate an important role for this region in future climate change. For example, Armour et al [2013] found that strong amplifying feedbacks in the Southern Ocean over centennial timescales contribute to an increase of apparent climate sensitivity with time i.e. increased global warming in response to a given forcing. If this is accurate then calculations using current observational records likely underestimate equilibrium climate response, meaning that the carbon budget for any given temperature target is smaller than inferred from these calculations. Given that this is a modelled result relying heavily on Southern Ocean changes, improved simulation of the regional sea-ice and energy budget in the present day is necessary to increase confidence.
Partial collapse of the West Antarctic ice-sheet is a major climate risk [Joughin and Alley 2011, Joughin et al 2014, Bamber et al 2009] but relevant thresholds and timescales have not been precisely identified despite extensive research on recent Antarctic mass balance [Shepherd et al 2012, McMillan et al 2014, Zwally et al 2015, Holland et al 2017]. Confounding factors include extreme storms causing large short-term mass increases [Boening et al 2012, Lenaerts et al 2016], and uncertainties in how long-term warming is expected to increase snowfall as well as melt and dynamical loss [Winkelmann et al 2012]. Changes in modelled precipitation over Antarctica are linked to sea-ice cover [Palerme et al 2016], so improved representations of sea-ice conditions in models is therefore important to help determine the credibility of projections of Antarctic changes.
Antarctica's relative isolation thanks to the strength of the Antarctic Circumpolar Current (ACC), its surrounding belt of westerlies and upwelling cool water [Armour et al 2016] mean that its forced response to climate change is weak relative to internal variability. The Southern Hemisphere dominates recent ocean heat storage [Stephens et al 2016] but otherwise this delayed Southern-Hemisphere response to forced changes makes it difficult to observationally constrain factors important for future climate change and sea-level rise. Holland et al [2017] shows that models simulate a two-timescale response to positive Southern Annular Mode (SAM) anomalies, with an initial increase in ice followed by an eventual sea-ice decline, further complicating the interpretation of short-term sea-ice records.
Local radiation contributes to sea-ice changes, and one challenge for GCMs is the correct radiative representation of clouds. Cloud properties in fully coupled GCMs often disagree with observations [Li et al 2013, Lenaerts et al 2017]. Here we focus on examining the radiative effects of considering precipitating ice clouds (i.e. snow) as 26 out of 40 CMIP5 GCMs do not consider these effects [Li et al 2012, Waliser et al 2009] (see supplementary table 1 available at stacks.iop.org/ERL/12/084010/mmedia).
A number of physical processes have been shown to contribute to differences in GCM representations of energy budgets and sea-ice in the Southern Ocean, including the abundance and brightness of clouds [Trenberth and Fasullo 2010], the representation of supercooled liquid droplets [Cesana et al 2012, McCoy et al 2015, Kay et al 2016] and the importance of regional topography and bathymetry [Nghiem et al 2016]. Here we quantify the contribution of precipitating-ice radiative effects and show that it is another important factor in modelled Antarctic sea-ice biases.
A series of studies has demonstrated the importance of precipitating-ice radiative effects for explaining model biases in radiation fields that are well correlated with biases in other simulated properties such as near-surface temperatures [Li et al 2013, Li et al 2014, Li et al 2015, Li et al 2016]. We use specialized simulations where we turn on or off the precipitating-ice radiative effects and compare these with observation-based products. Here we begin by summarizing the regional importance of precipitating-ice radiative effects for reducing the model-observation discrepancy in cloud and radiation properties. We then extend this analysis to the simulation of Antarctic sea-ice and show that including these radiative effects substantially reduces the discrepancy between simulated and observed sea-ice area. Our inclusion of snow radiative effects also reduces model-observation discrepancy of Arctic sea-ice concentration, but differences in geography between the Arctic and Antarctic complicate a joint analysis. Therefore, we restrict our discussion here to Antarctic sea-ice.
2. Methods
2.1. Climate Model Simulations
As historical simulations end in 2005 and satellite sea-ice series begin in the late 1970s, we select output from 1980–2005 and for each grid-cell take the mean of the CMIP5 simulations for a given month and given property. There is little difference in the average properties between the CMIP3 and CMIP5 ensembles so we only report CMIP5 results here (supplementary figure 1). All CMIP5 models together are reported the Multi-Model Mean (CMIP5 M MM, Taylor et al 2012), and we separately present the mean for those models both with and without falling-snow radiative effects (CMIP5-S and CMIP5 NoS respectively, see supplementary table 1).
For our intervention 'snow radiative effects on' (S) and 'snow radiative effects off' (NoS) simulations we use the Community Earth System Model version 1 (CESM1) managed by National Center for Atmospheric Research (NCAR) and Department of Energy (DOE) which is composed of four separate models that simultaneously simulate Earth's atmosphere, ocean, land surface, and sea-ice. Model code and documentation are available from www.cesm.ucar.edu/models/cesm1.0/. The atmospheric model is the Community Atmosphere Model version 5 (CAM5), and snow in this model represents large ice crystals diagnosed from the falling ice mass flux at each model level and time step [Morrison and Gettelman 2008, Neale et al 2012]. The model uses two-moment, stratiform cloud microphysics scheme described by Morrison and Gettelman (2008) which accounts for diagnosed snow mass. Snow is included in the radiation code [Gettelman et al 2010], using the diagnosed mass and effective radius of falling snow crystals [Morrison and Gettelman 2008]. The simulated prognostic ice and diagnostic snow are comparable against CloudSat-CALIPSO retrieved products [Gettelman et al 2010]. More detailed descriptions and related references are in supplementary information section 2.
We conduct sensitivity experiments using a fully coupled setup with two simulations over 1850–2005: one excludes the precipitating ice radiative effect (NoS); and the other includes the effect (S). Each simulation otherwise follows the CMIP5 historical protocol, including initialization from the same CESM1 C AM5 CMIP5 300 year preindustrial control (piControl) run.
The global area-weighted mean of the net radiative flux at top of atmosphere (TOA) over the full simulation is −0.17 W m−2 and 0.12 W m−2 for the NoS and S cases, respectively. The reflected SW TOA flux is −1.6 W m−2 for NoS and 0.6 W m−2 for S and the outgoing LW at TOA is 0.6 W m−2 for NoS and −1.9 W m−2 for S.
Changes in model-observation discrepancy between the S and NoS cases are determined from:
where x is some property, the subscript NoS represents the value from the NoS simulation, S is from the snow simulation and obs denotes the observation-based value. We use this metric in figures 5(c) and (f), and it is defined such that a positive value represents a decrease in the magnitude of the model-observation discrepancy when snow-radiative effects are included.
2.2. Comparison with observation-based cloud- and radiation properties
We begin by highlighting the importance of including falling snow to cloud properties by considering biases over Antarctica and the Southern Oceans in the CMIP5 NoS ensemble average. We first compare modelled cloud properties with those determined over 2007–2010 from CloudSat-CALIPSO measurements. CloudSat and CALIPSO are satellites in the Afternoon-Train (A-train) constellation that fly along the same reference ground track on a Sun-synchronous orbit with an ascending (northward) local equatorial crossing time near 13:36. CALIPSO and CloudSat are separated by less than a minute, allowing reliable collocation between the CALIPSO-mounted CALIOP LIDAR and the CloudSat-mounted Cloud-Profiling Radar. We use the CALIPSO-CloudSat 2 C-ICE product [Deng et al 2010, 2013] over the region 40–82 °S where the poleward edge is limited by the satellites' orbit. Cloud ice water path (CIWP) is identified using the FLAG method [Li et al 2012] which separates cloud-only (floating or suspended cloud ice) and precipitating + convective clouds, and we use both in our comparison. Because of negligible sampling biases of cloud water, cloud formation etc [Li et al 2012, Guan et al 2013], the uncertainties related to the diurnal cycle and sampling issues are not specifically considered in the model-observation comparisons in this study.
For an observation-based estimate of surface radiation we use the satellite-based Clouds and the Earth's Radiant Energy System-Energy Balanced and Filled (CERES-EBAF) Surface products over 2000–2010, which are widely used and have been validated with surface measurements, with a monthly-grid-mean uncertainty of ± 10 W m−2 for shortwave and ±14 W m−2 for longwave [Kato et al 2011, Kato et al 2012, 2013]. We select the same 40–82 °S region and use each of the radiative energy-budget components: longwave up and down plus shortwave up and down.
2.3. Comparison with observation-based sea-ice concentration
We take gridded monthly-averaged sea-ice concentration data from the National Snow and Ice Data Center (NSIDC) over 1980–2005 derived from the NASA Team Algorithm [Cavalieri et al 2012, 1999]. These are based on measurements from passive microwave sensors beginning with the Scanning Multichannel Microwave Radiometer (SMMR) aboard the Nimbus-7 satellite and proceeding with the Special Sensor Microwave/Imager (SSMI) instruments aboard the Defense Meteorological Satellite Program (DMSP) F8, F11, F13, and F17 platforms. The data's native resolution of 25 km is remapped onto a 1°×1° latitude-longitude grid and we use data from 50–70°S, excluding areas closer to Antarctica to avoid discrepancies in mapping of the Antarctic coast and its ice shelves. 82% of the magnitude of the annual cycle of sea-ice area is captured within this area, so our results apply to the majority of the sea-ice area.
3. Results
3.1. CMIP5 Biases in cloud- and radiation properties
Figure 1 shows that the CMIP5 NoS models have little bias in a like-with-like comparison with CloudSat-CALIPSO Cloud Ice-Water Path (CIWP; cloud ice only) in both Austral winter (figure 1(a): June-July-August, JJA) and Austral summer (figure 1(e): December-January-February, DJF). However, the CMIP5 NoS substantially underestimates total IWP (TIWP) over and near Antarctica once precipitating clouds are included (figure 1(b): JJA; figure 1(f): DJF). This contributes to a multi-model mean (MMM) bias in total ice water path of −90.7 g m−2 with relative bias of −72% averaged over the region 40–82°S, relative to the CloudSat-CALIPSO 2 C-ICE product [Deng et al 2010, 2013]. The spatial patterns and magnitudes of TIWP biases between CMIP3 and CMIP5 are similar with an absolute bias larger than 110 g m−2 over the Southern Ocean, implying a zeroth-order deficiency embedded in both NoS CMIP3 and NoS CMIP5 GCMs (see supplementary figure 1). Figure 1 also shows cloud and net surface radiation biases between CMIP5 NoS and CERES-EBAF (figure 1(c): JJA; figure 1(g): DJF) and sea-ice concentration biases (figure 1(d): JJA; figure 1(h): DJF) between CMIP5 NoS and NSIDC.

Figure 1 (a) 1980–2005 CMIP5 multi-model-mean for models without falling snow radiative effects (CMIP5 N OS) values for: (a) ice water path (IWP) minus CloudSat-CALIPSO observed cloud-only IWP (CIWP, g m−2) for Jun-Jul-Aug (JJA), (b) Same as (a) but for total IWP (TIWP). (c) Same as (a) but for CMIP5 NoS minus observed all-sky net surface radiation. (d) Same as (a) but for CMIP5 NoS minus observed sea-ice concentration (SIC) (%). (e)–(h) Same as (a)–(d) but for Dec-Jan-Feb (DJF).
Download figure:
Standard image High-resolution imageGiven the correlation between patterns of bias in TIWP, surface fluxes and sea-ice concentration, we propose a causal link as follows: models without falling-snow radiative effects underestimate TIWP, reducing surface downward longwave and increasing surface downward shortwave fluxes, which drive changes in sea-ice concentration (see supplementary figures 2 and 3 for the radiation budget split into its components). We support our hypothesis using specialized simulations to isolate and quantify the contribution of falling-snow radiative effects. These specialized simulations are necessary as the comparison in figure 1 includes all potential biases in simulated physical processes between CMIP5 NoS and the real-world state.
3.2. Falling-snow radiative effects and the annual cycle of modelled energy budgets and sea-ice concentration
For our quantification of the precipitating-ice radiative effects, we present results from our CESM1 simulations both with (S) and without (NoS) the radiative effects of falling snow. Figure 2 shows the model minus observed monthly values of surface radiation budget components and sea-ice concentration, presented for two different latitude bands. This illustrates that the S simulation is consistently closer than the NoS simulation to the observed energy-budget components (figures 2(a), (b), (d) and (e) and sea-ice concentration (figures 2(c) and (f), CMIP5 M MM also shown). The largest remaining bias in the S simulations is in shortwave fluxes during austral summer, which may be related to other cloud-simulation biases such as underestimated supercooled liquid fraction in mixed-phase clouds [Tan et al 2016, Kay et al 2016] and large-scale atmospheric conditions [Simmonds 2015, Holland et al 2017]. Snow radiative effects reduce the size of the JJA longwave bias from 58–70°S relative to CERES-EBAF, from −30 W m−2 down to −10 W m−2 (figure 2(d), and the DJF shortwave bias over the same region from approximately +55 W m−2 to +35 W m−2. We do not present a formal uncertainty estimate in these fluxes as there is a lack of CERES validation over this region. However, the reported monthly zonal mean uncertainty over oceans for the CERES data are ±10 W m−2 in downward LW and SW [Kato et al 2012]. Our averaging over 10 year s would favor a smaller error, but the large uncertainties associated with surface albedo would favor a larger value. Taking the reported ±10 W m−2 as an approximation of the error, the radiative effects of falling snow are similar in size to the observational error, and the NoS simulations are indeed in disagreement with the CERES-EBAF data over much of the year. Of the changes we see, improved model representation of downwelling longwave radiation restricts winter sea-ice growth leading to a decrease of 2.11 × 10⁶ km2 in the September peak sea-ice area, whose lower level is maintained by increased shortwave absorption during the summer. This substantially reduces the bias relative to observations.
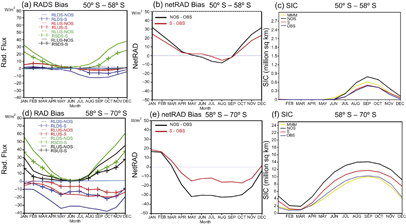
Figure 2 (a) 1980–2005 CESM1 seasonal cycle of surface radiative fluxes for snow-radiative effects off (NOS: solid line) and snow-radiative effects on (S: line with +) averaged over 50–58°S for downward longwave (RLDS, blue), upward longwave (RLUS, red), downward shortwave (RSDS, green), and upward shortwave (RSUS, black). Reported as bias against 2000–2010 CERES-EBAF mean (W m−2). (b) Same as (a) but for the bias of net surface radiative flux (netRAD) against CERES for snow-radiative effect off (NOS, black) and snow-radiative effect on (S, red). (c) Mean seasonal cycle of sea-ice area (SIC) for the CMIP5 multi-model mean (MMM: yellow) from all 40 outputs snow-radiative effects off (NOS: black), snow-radiative effects on (S: red) and National Snow and Ice Data Center (NSIDC) observation (OBS: blue). (d)–(f) Same as (a)–(c) but for 58–70°S.
Download figure:
Standard image High-resolution imageFigure 3 shows a spatial anti-correlation in the NoS minus S (NoS-S) change in JJA. When snow radiative effects are excluded, the underestimated IWP results in increased net surface shortwave flux (RSDS-RSUS: figures 3(a), (b)) and decreased surface downward longwave flux (RLDS: figure 3(c)). Longwave dominates in austral winter, meaning smaller net radiation (figure 3(e)), cooler surface temperature (see supplementary figures 4 and 5) and increased sea-ice concentration (figure 3(f)).
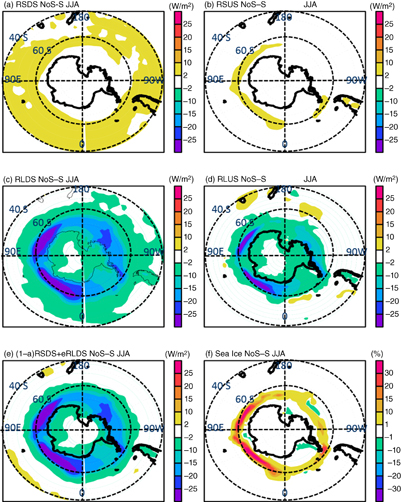
Figure 3 June-July-August (JJA) mean change in surface radiative fluxes and sea ice for snow-radiative effect off (NoS) minus snow-radiative effect on (S) over 1980–2005 in CESM1. (a) Downward shortwave (RSDS); (b) upward shortwave (RSUS); (c) downward longwave (RLDS); (d) upward longwave (RLUS); (e) net absorbed flux accounting for albedo, a, and surface emissivity, e; (f) sea ice concentration. Radiative fluxes in W m−2, sea ice concentration in %.
Download figure:
Standard image High-resolution imageFigure 4 shows that during austral summer the situation is more complex. In some regions, such as off the coast of Dronning-Maud land, there is a net decrease in downward radiation (figure 4(e)) along with a net decrease in sea-ice concentration (figure 4(f)). This is counterintuitive, but can be understood from the seasonal cycles in figure 2. In these regions, the increased winter longwave heating restricts sea-ice growth and leads to a reduced surface albedo. Although less sunlight reaches the surface due to atmospheric reflection by falling snow, the surface is darker due to reduced winter sea-ice growth caused by increased wintertime longwave heating. This increases absorption by enough to offset the reduction in downward shortwave radiation at the surface, helping to prevent summertime sea-ice growth in these regions.
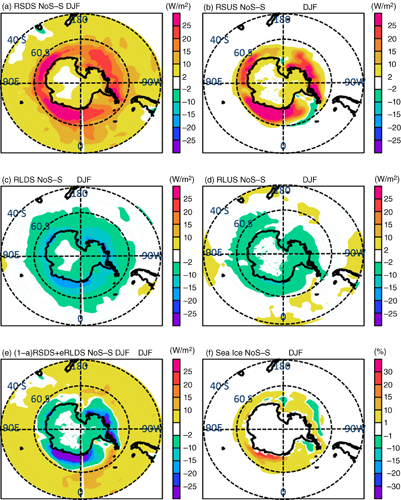
Figure 4 Same as figure 3 but for December-January-February (DJF).
Download figure:
Standard image High-resolution imageWe consider these effects in more detail and determine their robustness in figure 5, which maps changes in the bias in sea-ice concentration during JJA and DJF for the S and NoS simulations and the relative difference in bias from equation (1). In this case, positive means a reduction in bias magnitude. The inclusion of snow radiative effects leads to a widespread decrease in sea-ice concentration that brings the simulated sea-ice case closer to observations in most regions, with the exception of a band centered near 45°E in JJA.
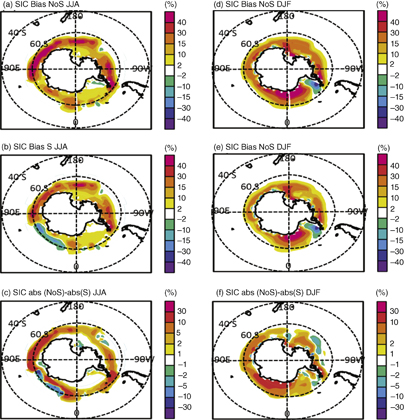
Figure 5 Sea-ice concentration for CESM1 simulations minus observations over (a)–(c) JJA and (d)–(f) DJF (%) over 1980–2005. Differences shown for snow-radiative effect off (NoS) in (a), (d) and snow-radiative effect on (S) in (b), (e). The bottom row with (c), (f) shows change in bias magnitude relative to observations, where positive represents a reduction in bias.
Download figure:
Standard image High-resolution imageFrom 50–70 °S the NoS simulations of sea-ice area have a relative bias of 3.01 × 10⁶ km2 in DJF and 3.88 × 10⁶ km2 in JJA, which is reduced in the S simulations to 1.84 × 10⁶ km2 (by 39%) in DJF and 1.75 × 10⁶ km2 (by 55%) in JJA. The greatest absolute change is in March-April-May (MAM) where the discrepancy is reduced by 65%. September-October-November (SON) shows a reduction of 54%. Using t-tests applied to the monthly simulated time series, the differences are statistically robust with, for example, sea-ice concentration changes significant at p < 0.01 over much of the Southern Ocean (supplementary figures 6 and 7). The surface radiation budget and surface or near-surface temperature biases are also reduced in most regions (supplementary figures 8 and 9).
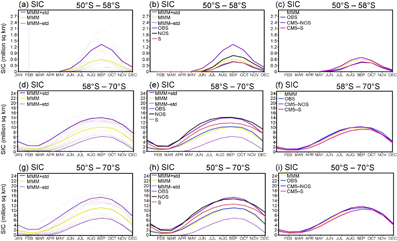
Figure 6 shows mean SIC seasonal cycles from a range of sources. Figures 6 (a), (d) and (g) show the 40 m ember full CMIP5 ensemble along with the multi-model mean (MMM) and standard deviation. Figures 6(b), (e) and (h) show where the observations and CESM-1 S and NoS simulations fall within the CMIP5 distribution. Figures 6(c), (f) and (i) show the CMIP5 MMM versus observations along with the mean for CMIP5 NoS models (N = 14) and CMIP5-S models (N = 26). The CMIP5 mean annual cycle is similar to observations, with slight underestimates in maximum extent, as reported elsewhere [Zunz et al 2013, Lenaerts et al 2016, Boucher et al 2013, IPCC 2013]. Consistent with our CESM1 results, the CMIP5-S models show less sea-ice than the CMIP5 NoS models. The CMIP5-S underestimate of sea-ice extent indicates that other aspects of the model design likely overcompensate for the inclusion of snow radiative effects.
Figure 6 (a) 1980–2005 mean seasonal cycle of sea-ice concentration (SIC) for each CMIP5 model (thin black line), the multi-model mean (MMM: yellow), and one standard deviation (purple line) averaged over 50–58°S. (b) Same as (a) but for mean seasonal cycle of MMM with one standard deviation, snow-radiative effects off (NOS: black), snow-radiative effects on (S: red) and National Snow and Ice Data Center (NSIDC) observation (OBS: blue). (c) Same as (a) but for mean seasonal cycle of MMM (yellow) and the ensemble CMIP5 model mean with considering snow-radiative effects (CM5 N OS: purple) and the models with inclusion of snow-radiative effects (CM5-S: red). Note that the MMM is the average of CM5 NoS and CM5-S. (d)–(f) Same as (a)–(c) but for 58–70°S. (g)–(i) Same as (a)–(c) but for 50–70°S.
Download figure:
Standard image High-resolution image
4. Discussion and conclusions
We have investigated CMIP5 biases relative to observations over the Antarctic sea-ice region and attributed some of these biases to the exclusion of falling-ice radiative effects in most models. We showed that for the 26 out of 40 CMIP5 models that do not simulate precipitating ice radiative effects, the multi-model mean cloud ice water path agrees well with the non-precipitating cloud ice water path identified from CloudSat-CALIPSO observations. However, there is a substantial bias in total cloud ice-water path due to the exclusion of model falling-snow radiative effects. Total ice-water path is underestimated by about 100 g m−2 over much of the Southern Ocean, contributing to an underestimate in downward longwave radiation and an overestimate in downward shortwave radiation at the surface.
Through controlled simulations using the CESM1 in which we activated or deactivated the snow radiative effects, we demonstrated that this radiation reduces the model-observed discrepancy in sea-ice area at 50–70°S by 39–66%, depending on the season. The geographical pattern of SIC and radiation fields changes largely matches the CMIP5-S multi-model mean bias. From inspection of the annual cycle, it appears that the improvements in representation of sea-ice are driven by an increase in downward longwave radiation due to increased ice-water path with inclusion of precipitating ice during winter (JJA). This restricts the growth of sea ice, leading to a lower mean sea-ice area of 2.11 × 10⁶ km2 in 1980–2005 during September, the month of peak sea-ice cover. During austral summer, increased reflection by cloud ice reduces the shortwave radiation arriving at the surface, in some regions by an amount greater than the increased downwelling longwave due to this ice. However, this does not increase sea-ice concentration because during the previous winter, cloud-ice radiative effects restricted sea-ice growth and reduced surface albedo. This memory effect from the previous winter more than offsets the reduced amount of sunlight reaching the surface during summer.
Falling-snow radiative effects are therefore important for simulating radiative balance and sea-ice concentration over the Southern Ocean and this has not been previously quantified. Studies have shown that multiple factors contribute to model Southern-Ocean sea-ice biases, and we only argue that the evidence shows that radiative effects of falling snow are an additional candidate, but one with substantial effects on simulated energy budgets and sea ice. Such a physics-based improvement, if applied across models, would increase confidence in projections of regional changes affecting climate feedbacks. In addition, better representation of sea-ice should improve water flux and therefore simulated Antarctic bottom water (AABW) and Southern Ocean temperature profiles, which are currently poorly simulated (e.g. Rhein et al 2013, IPCC AR5 report). We do not argue that precipitating-ice radiative effects are the only dominant factor in model biases related to sea ice. However, given the reduction in model-observation discrepancy of 39–66% when including falling-snow radiative effects, we conclude that the exclusion of precipitating snow particles is a critical shortcoming of 26 of the 40 state-of-the-art GCMs used to project the future state of Antarctic sea ice. Given that falling-snow radiative effects are already included in some models, this is an opportunity to address an easily understood, physically based deficiency that may introduce notable biases in climate simulations. Including falling-snow radiative effects is an obvious opportunity for improvement across the majority of climate models used in the widely referenced reports of the Intergovernmental Panel on Climate Change (IPCC).
Acknowledgments
The contribution by JLL to this study was carried out on behalf of the Jet Propulsion Laboratory, California Institute of Technology, under contracts of ATMOS COMP 2013 (NNH12ZDA001N-CCST) with the National Aeronautics and Space Administration (NASA). This work has been supported in part by the NASA Making Earth System Data Records for Use in Research Environments (MEaSUREs) programs.
The most up-to-date Radiative Longwave Downward flux at Surface (RLDS) and Radiative Shortwave Downward flux at Surface (RSDS) are available from EBAF-Surface and ISCCP derived products. This surface flux radiation product is constrained by TOA CERES-derived flux with Energy Balanced and Filled (EBAF) adjustments [39–41]. The data used in this study is the monthly mean product, collected from January 2000 to December 2010. The CERES data can be found at http://ceres.larc.nasa.gov/order_data.php.
The land surface temperature is monthly composite and average of the MODIS Level-3 LST product (MOD11C3) at 0.05 degree grid resolution (2002 to 2012). Further details regarding the MODIS land product validation for the LST/E products is available from the following URL: http://landval.gsfc.nasa.gov/ProductStatus.php?ProductID=MOD11. The surface air temperature climatology used in this study is based on the period of 1961–1990 from HADCRUT2V data. The data can be accessed at www.esrl.noaa.gov/psd/data/gridded/data.hadcru3.html. The monthly mean UDel land-only SAT data span from 1900 to 2010 can be accessed at http://climate.geog.udel.edu/∼climate/html_pages/download.html and references can be found at the http://climate.geog.udel.edu/∼climate/.
For sea-ice observations, we utilize sea-ice concentration from the National Snow and Ice Data Center (NSIDC), where it provides the longest sea-ice record [Cavalieri et al 2012]. Here, we use the monthly mean sea-ice concentration data from 1978 to 2014 derived from NASA Team algorithm. The monthly mean sea-ice concentration data is available at 25 km Polar Stereographic Projections in both north and south polar regions (https://nsidc.org/data/seaice/data_summaries.html). These data are then re-gridded to global 1° longitude by 1° latitude.
The filtered cloud ice, ice water path and cloud fraction data span from 2007 to 2010 are available by email request (jli@jpl.nasa.gov).