

Abstract
Food production is key to achieving food security in the drylands of sub-Saharan Africa. Since agricultural productivity is limited, however, due to inherent agro-ecological constraints and land degradation, sustainable agricultural intensification has been widely discussed as an opportunity for improving food security and reducing vulnerability. Yet vulnerability determinants are distributed heterogeneously in the drylands of sub-Saharan Africa and sustainable intensification cannot be achieved everywhere in cost-effective and efficient ways. To better understand the heterogeneity of farming systems' vulnerability in order to support decision making at regional scales, we present archetypes, i.e. socio-ecological patterns, of farming systems' vulnerability in the drylands of sub-Saharan Africa and reveal their nestedness. We quantitatively indicated the most relevant farming systems' properties at a sub-national resolution. These factors included water availability, agro-ecological potential, erosion sensitivity, population pressure, urbanisation, remoteness, governance, income and undernourishment. Cluster analysis revealed eight broad archetypes of vulnerability across all drylands of sub-Saharan Africa. The broad archetype representing better governance and highest remoteness in extremely dry and resource-constrained regions encompassed the largest area share (19%), mainly indicated in western Africa. Moreover, six nested archetypes were identified within those regions with better agropotential and prevalent agricultural livelihoods. Among these patterns, the nested archetype depicting regions with highest erosion sensitivity, severe undernourishment and lower agropotential represented the largest population (30%) and area (28%) share, mainly found in the Sahel region. The nested archetype indicating medium undernourishment, better governance and lowest erosion sensitivity showed particular potential for sustainable agricultural intensification, mainly in western and some parts of southeastern and eastern Africa. Insights into the nestedness of archetypes allowed a more differentiated discussion of vulnerability and sustainable intensification opportunities, enhancing the evaluation of key interlinkages between land management and food security. The archetypes may support the transfer of successful intensification strategies based on similarities among the drylands in sub-Saharan Africa.
Export citation and abstract BibTeX RIS

Original content from this work may be used under the terms of the Creative Commons Attribution 3.0 licence.
Any further distribution of this work must maintain attribution to the author(s) and the title of the work, journal citation and DOI.
1. Introduction
Achieving food security, one of the Sustainable Development Goals, remains a challenging task in African drylands. Major efforts to promote a unique African green revolution (MDGTSC 2004) and sustainably intensify agricultural production (Pretty et al 2011, Tittonell 2014) have contributed to improvements in crop and livestock production (FAO 2015, Sanchez 2015), mainly in the humid parts of the continent. However, severe productivity constraints and undernourishment persist in the drylands of Africa (FAO 2015). Drylands are low-productivity regions where low and unreliable rainfall, infertile soils and land degradation constrain agricultural productivity (Safriel et al 2005, Hein and De Ridder 2006, Zika and Erb 2009). The majority of the rural population living in African drylands relies on smallholder agriculture as the main source of food and income. Constraints are further aggravated when market opportunities and infrastructure are limited and authorities struggle to efficiently formulate and implement policies and ensure the provision of public services, as outlined in the 'Drylands Development Paradigm' (Reynolds et al 2007) and 'Dryland Livelihood Paradigm' (Safriel and Adeel 2008). These socio-ecological conditions render farming systems in African drylands vulnerable to adverse impacts of recurrent droughts, price fluctuations and related conflicts (Sietz et al 2011a, Sterzel et al 2014, Kok et al 2016).
Sustainable agricultural intensification is part of an increasingly shared vision on how to overcome the pressing challenges of sustaining a growing population. Following the principle of responsibly increasing food production while maintaining and enhancing ecosystem services (Royal Society 2009, Godfray et al 2010), sustainable intensification provides major entry points for vulnerability reduction. Yet, it requires comprehensive decisions regarding both environmental and socio-economic factors such as natural resource potential, resource-use intensity, governance, the role of markets and consumption preferences in order to prevent a narrow productionist focus. As agricultural production cannot, however, be sustainably intensified everywhere at an acceptable cost, it is essential to identify regions where sustainable intensification is a viable strategy. Although intensification potential is high in the humid tropics due to better water availability, sustainable intensification in drylands presents another major opportunity for reducing vulnerability and achieving food security (Pretty et al 2011).
Specific processes that shape farming systems' vulnerability locally result from context-dependent socio-ecological interactions that, in turn, are shaped by global phenomena such as climate conditions and economic policies. The recurrence of distinct processes within the diverse socio-ecological situations in drylands and elsewhere has inspired extensive research on typical patterns of human-nature interactions, in particular the identification of archetypes of vulnerability (Jäger et al 2007, Sietz et al 2011a, 2012, Kok et al 2016) and land use (Václavík et al 2013, Levers et al 2015, Oberlack et al 2016). Archetypes of vulnerability are defined as recurrent conditions that shape the relation between socio-ecological systems and environmental as well as socio-economic stresses, including weather extremes and inequitable trade conditions (Sietz et al 2011a, 2012, Kok et al 2016). We define vulnerability—based on McCarthy et al (2001)—as a function of farming systems' sensitivity and capacity to adapt to environmental and socio-economic stresses. Archetypes allow us to gain a systemic understanding of vulnerability at an intermediate level of complexity, in between an all-embracing perspective and the particularities of individual cases.
Archetype analyses have focused on single scales using indicator-based (Sietz et al 2011a, Václavík et al 2013, Kok et al 2016), model-based (Sietz et al 2006) and meta-analytical (Oberlack et al 2016) approaches. We use the term 'scale' to refer to the spatial (e.g. regional) dimensions at which vulnerability is assessed. Each discrete spatial representation is defined by an extent and a resolution. Choice of extent and resolution is critical since these features determine input variables and results (Vincent 2007). The assessment scale is also important since interventions to reduce vulnerability are more commonly designed at higher than local scales, demanding an improved understanding of the processes that typically drive vulnerability. Focusing on a large extent with coarse resolution allows the identification of various patterns caused by different drivers but may mask local diversity. One option for better understanding heterogeneity in phenomena such as vulnerability is to focus the analysis on a smaller extent and refine specific patterns identified at a broader extent. Using finer-grained information on factors of interest, i.e. employing a finer resolution (Sietz 2014), is another way to operationalise a multi-scale approach to analysing vulnerability.
The aim of this study was to improve our knowledge of the heterogeneity in farming systems' vulnerability in the drylands in sub-Saharan Africa. In particular, it addressed two research questions. Firstly, are there broad archetypes of farming systems' vulnerability across all drylands in sub-Saharan Africa? Secondly, are there nested archetypes of vulnerability in those regions with higher agropotential and predominant agricultural livelihoods that can facilitate a more nuanced discussion of vulnerability? Evaluating the archetypical patterns from the perspective of sustainable intensification allows us to identify those dryland regions for which sustainable intensification presents particular entry points for reducing vulnerability and improving food security.
2. Data and methods
This study used a cluster-based approach to identify broad and nested archetypes of vulnerability at two spatial scale extents. Firstly, we identified broad archetypes representing typical combinations of vulnerability drivers and outcomes across all drylands in sub-Saharan Africa. Secondly, we focused on a subset of broad archetypes encompassing only those regions that showed a higher agropotential and prevalent agricultural livelihoods in order to identify those agricultural regions in which sustainable intensification may contribute to reduced vulnerability and food insecurity. Within this subset, we analysed nested archetypes depicting embedded vulnerability drivers and outcomes at a smaller spatial scale extent. The methodological approach is described below, outlining the indicators and cluster analysis used.
2.1. Indicators of vulnerability
Major dryland studies (Reynolds et al 2007, Safriel and Adeel 2008, Sietz et al 2011a, Kok et al 2016) have suggested typical socio-ecological factors affecting farming systems' vulnerability (see section SI.1 in the supplementary material available at stacks.iop.org/ERL/12/095006/mmedia), which we used to select nine socio-ecological indicators (table 1) to assess archetypes of vulnerability. Data derived from integrated assessment models such as environmental resource indicators received particular attention in order to facilitate future investigations of changes in vulnerability and scenario analysis. Our analysis focused on a sub-national resolution. Aiming at both finding a common ground for working with sufficient data quality for all the indicators considered and facilitating the use of data derived from integrated assessment models such as IMAGE (MNP 2006) and GISMO (Hilderink and Lucas 2008, Stehfest et al 2014), we worked on an intermediate resolution (0.5°). This choice is a compromise that balances differences in indicator resolution and enables future scenario analysis considering environmental and well-being dynamics (MNP 2006, Hilderink and Lucas 2008, Stehfest et al 2014).
Table 1. Indicators used for analysing both broad and nested archetypes of vulnerability in the drylands of sub-Saharan Africa. (Note: all data used were derived from global data sets referring to the year 2000. Mean values and standard deviations were calculated for the gridded values comprising the drylands in sub-Saharan Africa, all (dis)aggregated at 0.5° resolution. NCHS = National Center for Health Statistics; CDC = Centers for Disease Control and Prevention; WHO = World Health Organisation.)
| Vulnerability dimension | Indicator (unit) | Mean value (standard deviation) at 0.5°×0.5° grid cell level | Spatial resolution | Source |
|---|---|---|---|---|
| Resource quality | ||||
| Water availability | Water runoff per river basin, taken from WaterGap 2.1 model (mm*year−1) | 40 (58) | 0.5° × 0.5° grid cells | Alcamo et al (2000) |
| Agropotential | Ratio of actual grassland productivity to maximum productivity (unitless) | 0.11 (0.12) | 0.5° × 0.5° grid cells | MNP (2006) |
| Erosion sensitivity | Water-induced erosion sensitivity index for soil, ranging from 0 (no erosion risk) to 1 (high erosion risk) | 0.14 (0.13) | 0.5° × 0.5° grid cells | Hootsmans et al (2001) |
| Resource use intensity | ||||
| Population pressure | Population density (people*km−2) | 15 (34) | 5' × 5' grid cells | Klein Goldewijk et al (2010) |
| Urbanisation | Urban population share (%) | 11 (21) | 5' × 5' grid cells | Klein Goldewijk et al (2010) |
| Socio-political constraints | ||||
| Remoteness from markets and decision making | Distance to nearest city of 100 000 inhabitants (hours) | 14 (10) | 0.5° × 0.5° grid cells | Letourneau et al (2010) |
| Governance | Average of six aggregate indicators (z-score-scaled) included in the Worldwide Governance Indicators dataset of the World Bank (unitless) | −0.7 (0.7) | National | Kaufmann et al (2008) |
| Well-being | ||||
| Income | Gross domestic product/capita (in US dollars) | 737 (956) | National | UNSTAT (2005), World Bank (2006) |
| Undernourishment | Percentage of underweight children (more than two standard deviations below the mean weight-for-age score of the NCHS/CDC/WHO international reference population) (%) | 31 (12) | 2.5' × 2.5' grid cells | CIESIN (2005) |
Regarding food security (FAO 2000), we focused our analysis on food availability and access as those dimensions that are at least partly within farmers' and pastoralists' control. Dryland regions were selected according to aridity including hyper-arid to dry sub-humid areas (aridity index: 0–0.65), based on dryland characterisation used by the Convention on Biological Diversity (Sörensen 2007). The year 2000 is the reference year for which all relevant data were available. Thus, this study presents a baseline assessment suited as a starting point when analysing current or future trends in vulnerability using dynamic indicators as proposed by Lüdeke et al (2014).
Resource quality was indicated by (i) water availability modelled as surface runoff and shallow groundwater recharge at river basin level (Alcamo et al 2000) depicting water scarcity as a major constraint in dryland development (see section SI.1 in the supplementary material), (ii) agropotential including soil quality (e.g. organic carbon content, soil texture, depth and water holding capacity), precipitation and topographic conditions approximated as the ratio of actual grassland productivity to maximum productivity under ideal conditions (MNP 2006) and (iii) erosion sensitivity given by the soil's water erosion sensitivity index proposed by Hootsmans et al (2001). Resource use intensity was indicated by (i) population pressure expressed as population density (Klein Goldewijk et al 2010) to capture food, water and other demands to be satisfied and (ii) urbanisation given by the share of urban population (Klein Goldewijk et al 2010) pointing towards a decreasing importance of agriculture in people's livelihoods. Socio-political constraints were indicated by (i) remoteness from markets and decision making represented by the distance to the nearest city (Letourneau et al 2010) and (ii) governance depicted as the national average of governance indicators proposed by Kaufmann et al (2008). The remoteness indicator further differentiates the broad governance information. For example, in more easily accessible regions governments can more effectively implement policies and regulations and ensure the quality of public and civil services, and citizens can more easily participate in elections. Finally, well-being was indicated by income and undernourishment, reflecting both causes and consequences of vulnerability. Due to a lack of spatially well-resolved data, income was indicated by gross domestic product available at a national level (UNSTAT 2005, World Bank 2006). Undernourishment was indicated by the percentage of underweight children represented at a sub-national resolution (CIESIN 2005), enabling a better understanding of income distribution. If many children were underweight in areas with a high national average income, we assumed that income was very unequally distributed.
In preparing the cluster analysis, we resampled population, urbanisation and undernourishment data to a 0.5° × 0.5° resolution. Moreover, country-level governance and income data were assigned to all grid cells in a given country such that all data were available at a grid-cell level (0.5° × 0.5°). To enable comparison, all indicators used to identify the broad archetypes were normalised to values between 0−1, reflecting their minima and maxima within the drylands of sub-Saharan Africa. Complementing the broad archetypes, the nested sub-clustering presents a more focused analysis considering only those indicator values that describe the regional sub-set that belonged to the broad archetypes with higher agropotential and mainly agricultural livelihoods. That sub-set of data spans a range that is smaller or equal to the range that is spanned by the data set used in the broad analysis. The indicator values were re-scaled to values between 0 and 1, on the basis of the minimum and maximum values over that regional sub-set. This resulted in a linear re-scaling of the normalised indicator values that were used in the broad archetype analysis.
2.2. Cluster analysis
Cluster analysis was used to categorise the drylands in sub-Saharan Africa in groups or clusters with similar socio-ecological characteristics, here referred to as 'archetypes of vulnerability'. We used an established clustering approach based on the sequence of hierarchical (hclust) and partitioning (k-means) algorithms (Sietz et al 2011a, Janssen et al 2012, Kok et al 2016). Cluster analysis was conducted in the nine-dimensional data space spanned by the indicators detailed in section 2.1. Firstly, clustering was performed for all drylands in sub-Saharan Africa, which revealed broad archetypes. Secondly, only those broad archetypes encompassing regions with higher agropotential in which people relied mainly on agriculture were clustered to identify nested archetypes.
The optimal number of clusters was determined by investigating the stability of cluster partitions using different starting points (see section SI.2 in the supplementary material). The overall importance of indicators for a given cluster partition was estimated by assessing a partition's sensitivity to the omission of indicators, expressed as a Fraiman Index (Fraiman et al 2008, see figures SI.2 and SI.4 in the supplementary material). Low values of the Fraiman Index depict important indicators while high values mean less important indicators. While the Fraiman Index delivered an overview of the most important indicators at the level of cluster partitions, the average indicator values for the clusters provided the basis for discussing cluster-specific mechanisms. The spatial distribution of clusters offered insights into regional combinations of vulnerability drivers and outcomes.
3. Results and discussion
3.1. Broad archetypes of vulnerability
Cluster analysis revealed eight broad archetypes of vulnerability as the consistency measure showed a maximum for partitions with eight clusters for all drylands in sub-Saharan Africa (see figure SI.1 in the supplementary material). Four groups of broad archetypes can be identified including (i) extremely dry and resource-constrained areas, (ii) dry areas with better agropotential, (iii) better governance, higher income and better nourished people and (iv) urbanised areas. According to the Fraiman Index (see figure SI.2 in the supplementary material), the most important indicators distinguishing the broad archetypes were erosion sensitivity, governance and urbanisation (in order of decreasing importance). In contrast, water availability and population pressure hardly differentiated the clusters. We named the archetypes according to the differentiating vulnerability dimensions that often, but not always, coincided with the most important indicators revealed by the Fraiman Index (e.g. erosion sensitivity and governance). The broad archetypes of vulnerability are discussed in more detail in the following sub-sections.
3.1.1. Extremely dry and resource-constrained areas
The broad archetypes encompassing extremely dry and resource-constrained areas described the most severe resource constraints in terms of water availability and agropotential, combined with very low income and medium to most severe undernourishment (red and orange clusters, figure 1). Contrasting levels of governance and remoteness differentiated vulnerability in these clusters. Representing the most isolated and sparsely populated regions, this group of clusters encompassed only a minority of people (4%) living in the sub-Saharan drylands (table 2).
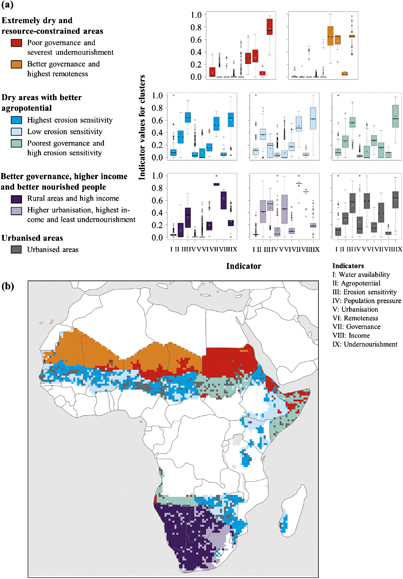
Figure 1. Broad archetypes of vulnerability: Cluster properties (a) and spatial distribution (b) in the drylands in sub-Saharan Africa. (Note: box boundaries in (a) denote the 25th and 75th percentiles of normalised indicator data. Whiskers indicate 5th and 95th percentiles while dots show outliers beyond this range. The mean value is indicated by the cross inside a box; the line near the middle of a box depicts the median value.)
Download figure:
Standard image High-resolution imageTable 2. Broad archetypes of vulnerability: dryland population and area share.
| Groups of broad archetypes | Broad archetypes | Populationa (in thousands) | Population share (%) | Area (1000 km2) | Area share (%) |
|---|---|---|---|---|---|
| Extremely dry and resource-constrained areas | Poor governance and severest undernourishment | 5624 | 3 | 1873 | 15 |
| Better governance and highest remoteness | 1846 | 1 | 2376 | 19 | |
| Dry areas with better agropotential | Highest erosion sensitivity | 41 205 | 20 | 2135 | 17 |
| Low erosion sensitivity | 32 030 | 16 | 1789 | 14 | |
| Poorest governance and high erosion sensitivity | 15 033 | 7 | 1342 | 10 | |
| Better governance, higher income and better nourished people | Rural areas and high income | 4042 | 2 | 1751 | 14 |
| Higher urbanisation, highest income and least undernourishment | 30 317 | 15 | 685 | 5 | |
| Urbanised areas | Urbanised areas | 75 048 | 37 | 879 | 7 |
| Total | 205 145 | 100 | 12 649 | 100 | |
aData source: Klein Goldewijk et al (2010).
The poor governance and severest undernourishment archetype was primarily found in the hyper- to semi-arid zones in eastern Africa and the eastern and central Sahel zone (red cluster, figure 1). This archetype represented the most critical development trajectory outlined in the Dryland Livelihood Paradigm in which inherently low primary productivity significantly limits well-being (Safriel and Adeel 2008), shown by the worst undernourishment among all broad archetypes. For example, recurrent droughts, food shortages and violent conflicts are major causes of vulnerability and food insecurity in the northern part of Afar Regional State in Ethiopia (Tesfay and Tafere 2004). The predominant pastoralists in this region had frequently been excluded from development programmes compared with other pastoral groups in Ethiopia, and government support for rangeland management remained largely ineffective, partly as a result of centralised, top-down approaches in project planning and implementation (Tesfay and Tafere 2004).
The better governance and highest remoteness archetype was mainly found in western Africa where, despite better governance, the largest distances to markets and institutions created serious barriers to trading and effective policy implementation (orange cluster, figure 1). Extreme water scarcity further challenged farmers and pastoralists in achieving food security, reflected in the severe undernourishment. For example, the Mauritanian government prioritised food security improvements and designed national policies and development programmes directly aimed at preventing, monitoring and reducing child undernourishment (Wuehler and Ould Dehah 2011). However, their implementation was lacking in less accessible areas, and greater efforts are needed particularly in regions with extremely low productivity due to a lack of rainfall and surface water such as in central and northeastern Mauritania (Ould Soule 2006).
3.1.2. Dry areas with better agropotential
The broad archetypes representing dry areas with better agropotential described situations with relatively better, though still very low water availability, higher agricultural production potential compared with all other broad archetypes and closer distances to markets and centres of decision making (dark blue, light blue and turquoise clusters, figure 1). However, the somewhat better natural resource endowment and connectivity had not translated into improved well-being, shown by intermediate undernourishment and very low income. Two broad archetypes differentiated vulnerability situations mainly according to erosion sensitivity (dark blue and light blue clusters, figure 1). They were found in the western and central Sahel region as well as in some parts of eastern and southeastern Africa, comprising about one third of the population living in the drylands in sub-Saharan Africa (table 2). In contrast, the archetype capturing poorest governance and high erosion sensitivity was found in Somalia, Sudan and Angola (turquoise cluster, figure 1). Together, these archetypes encompassed about 43% of the dryland population and 41% of the dryland area in sub-Saharan Africa (table 2).
Besides their large area and population share, these more productive archetypes represented regions in which agriculture's contribution to a country's gross domestic product (FAO 2014) and farming systems' properties vary greatly. The heterogeneity of these conditions, which influence a region's potential for sustainable intensification as a vulnerability-reduction strategy, prompted a refinement in order to distinguish nested archetypes that depict typical vulnerability situations within these broad archetypes. The nested archetypes identified in the dry areas with better agropotential are discussed in section 3.2.
3.1.3. Better governance, higher income and better nourished people
These broad archetypes characterised regions with best governance, highest income and best nourished people (dark purple and light purple clusters, figure 1), covering 17% of the sub-Saharan dryland population (table 2). These archetypes depicted more favourable facets of the Drylands Development Paradigm (Reynolds et al 2007) than any other archetype, despite severe water scarcity and partly very low agropotential. These seemingly better-off conditions need to be interpreted with care, however. Even though undernourishment in southern Africa is relatively low in comparison with other sub-Saharan drylands, the share of underweight children is considerable in absolute terms (20%–40%) in parts of Botswana and Namibia (CIESIN 2005), indicating a very unequal distribution of national wealth. Botswana, Namibia and South Africa had the most unequal wealth distribution of any region covered in this study, highlighted by a higher GINI Index (World Bank 2015). Therefore, these clusters portrayed situations in which higher national wealth translated into a major divide between rich and poor segments of society, potentially reinforcing vulnerability and food insecurity. Moreover, agriculture played only a minor role (<8%) in these countries' gross domestic product while mineral, gold and diamond mining and other industries (≥30%) as well as services (>50%) dominated their national economies (FAO 2014).
The rural areas and high income archetype was constrained by low agropotential and water availability (dark purple cluster, figure 1). These sparsely populated regions (table 2) were mainly located in Namibia, Botswana and large parts of western and central South Africa. For example, rural people living in the Kalahari Desert partly benefited from drought relief assistance, pensions and other forms of government support to sustain their well-being (Chanda et al 2003, Sallu et al 2010). In the harsh desert conditions, people usually supplemented livestock keeping and hunting activities with paid employment and small local business to invest in livestock herds and land resources as a basis for improved food security (Chanda et al 2003, Sallu et al 2010). The higher urbanisation, highest income and least undernourishment archetype represented 15% of the sub-Saharan dryland population (table 2) often living in urban areas mainly in eastern and southern South Africa and some scattered regions in Botswana and Namibia (light purple cluster, figure 1). These areas showed the highest agropotential among all clusters but are sensitive to soil erosion. The combination of better resource endowment and erosion sensitivity may, however, bear the risk of overuse due to higher population pressure and urban growth.
3.1.4. Urbanised areas
The urbanised areas archetype (grey cluster, figure 1) depicted relatively densely populated regions that had as much water available as the archetypes representing dry areas with better agropotential (blue clusters, figure 1), though water was generally scarce. This broad archetype was indicated throughout sub-Saharan drylands, representing more than one third of the dryland population (table 2). Despite being well-connected and relatively well resource-endowed, undernourishment in this broad archetype was no lower than in the archetypes covering extremely dry and dry areas. For example, population growth and urbanisation in Jigawa State in northern Nigeria had triggered intensification and expansion of agriculture (MOE 2012). In this desertification-prone region, reflected in its high erosion sensitivity (figure 1), shortened fallow periods and agricultural expansion to marginal land had contributed to the most severe soil erosion in Nigeria, restricting farmers' capacity to increase food production and income generation to improve their nutrition (MOE 2012).
3.2. Nested archetypes of vulnerability
In analysing nested archetypes, we were particularly interested in those agricultural regions where sustainable intensification can contribute towards reducing vulnerability. Three dimensions captured in this vulnerability analysis (see section 2.1) are especially suited to exploring possibilities for sustainable intensification. Firstly, agropotential and water availability jointly indicate primary productivity, depicting an environmental potential for intensification. Lack of environmental potential precluded regions from being considered for sustainable intensification efforts. Secondly, erosion sensitivity points towards the risk of land overuse. It directly links environmental conditions and land management, allowing a more differentiated discussion of intensification opportunities. Thirdly, we considered effective planning and implementation processes, specified by governance and remoteness, to be institutional prerequisites for success in sustainable intensification. Among the broad archetypes, the clusters depicting dry areas with better agropotential (see group of blue clusters, figure 1) demonstrated higher primary productivity together with a varying risk of land overuse and planning as well as implementation effectiveness. In these regions we identified nested archetypes to refine vulnerability insights and investigate sustainable intensification opportunities. In contrast, primary productivity was strongly limited in the archetypes representing extremely dry and resource-constrained areas, and agricultural livelihoods did not prevail in the archetypes indicating better governance, higher income and better nourished people as well as urbanised areas.
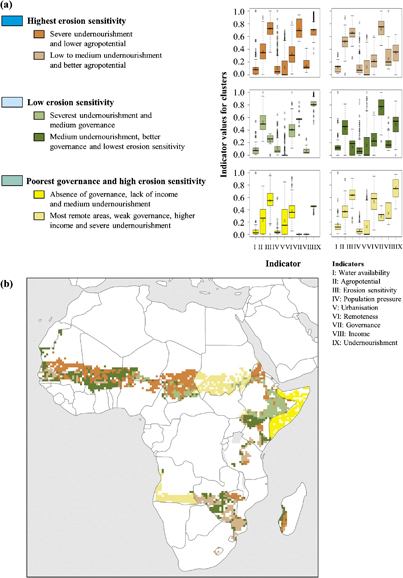
We identified six nested archetypes (figure 2) embedded in the dry areas with better agropotential according to the consistency measure (see figure SI.3 in the supplementary material). The consistency measure showed the global maximum for partitions with three clusters. This reconfirmed the existence of the three broad archetypes identified among all drylands in sub-Saharan Africa. In each of the broad archetypes two finer archetypes were nested, mainly differentiating farming systems' vulnerability according to erosion sensitivity, governance and undernourishment (see figure SI.4 in the supplementary material).
Figure 2. Nested archetypes of vulnerability: Cluster properties (a) and spatial distribution (b). (Note: the blue colours in (a) refer to three broad archetypes depicted in figure 1. Box boundaries in (a) denote the 25th and 75th percentiles of normalised indicator data. Whiskers indicate 5th and 95th percentiles while dots show outliers beyond this range. The mean value is indicated by the cross inside a box; the line near the middle of a box depicts the median value.)
Download figure:
Standard image High-resolution image
The two archetypes nested in the regions with highest erosion sensitivity differed in undernourishment and agropotential (dark and light brown clusters, figure 2) but otherwise largely maintained the broad archetype's characteristics including highest erosion sensitivity and better governance (dark blue cluster, figure 1). The nested archetype depicting severe undernourishment and lower agropotential was mainly found in the western and central Sahel region (dark brown cluster, figure 2), representing about one third of the population in nested archetypes (table 3). For example, agro-constraints including low soil fertility and precipitation scarcity restricted crop and pasture productivity in northern Burkina Faso (Ingram et al 2002). As a result, agro-pastoralists living in this dry region, reliant on cattle production as their main source of cash income, faced difficulties in producing sufficient food and generating income (Ingram et al 2002). The nested archetype showing low to medium undernourishment and better agropotential depicted another vulnerability mechanism primarily in southeastern African drylands (light brown cluster, figure 2) encompassing 17% of the nested archetypes' population (table 3). For example, farmers in southern Mozambique who diversified their livelihoods to include farming, livestock keeping and natural resource collection for market sale could generate some cash income (Hahn et al 2009). Moreover, food storage and seed savings helped these farmers to reduce risks of food shortage (Hahn et al 2009), potentially leading to the lower undernourishment depicted in the light brown cluster (figure 2).
Table 3. Nested archetypes of vulnerability: dryland population and area share.
| Broad archetypes | Nested archetypes | Populationa (in thousands) | Population share (%) | Area (1000 km2) | Area share (%) |
|---|---|---|---|---|---|
| Highest erosion sensitivity | Severe undernourishment and lower agropotential | 26 897 | 30 | 1 459 | 28 |
| Low to medium undernourishment and better agropotential | 14 736 | 17 | 686 | 13 | |
| Low erosion sensitivity | Severest undernourishment and medium governance | 12 299 | 14 | 622 | 12 |
| Medium undernourishment, better governance and lowest erosion sensitivity | 19 402 | 22 | 1094 | 21 | |
| Poorest governance and high erosion sensitivity | Absence of governance, lack of income and medium undernourishment | 4114 | 5 | 448 | 9 |
| Most remote areas, weak governance, higher income and severe undernourishment | 10 819 | 12 | 864 | 17 | |
| Total | 88 268 | 100 | 5173 | 100 | |
aData source: Klein Goldewijk et al (2010).
The low erosion sensitivity archetype (light blue cluster, figure 1) was further differentiated by one nested cluster capturing severest undernourishment and medium governance (light olive cluster, figure 2). This nested archetype was present in eastern and southern Ethiopia, some parts of southern Chad and southern Niger, assembling 14% of the nested archetypes' population (table 3). People living in these regions were the most severely undernourished among all nested archetypes and had very low incomes. Marginalised agro-pastoralists with limited access to extension services and markets in southern Ethiopia illustrated this nested archetype. Since these farmers and pastoralists mainly subsisted on rain-fed land, the precipitation decrease (1980–2010) that concurred with a rapid population increase in this region largely undermined their food security (Lòpez-Carr et al 2014). The other nested archetype included regions with medium undernourishment, better governance and lowest erosion sensitivity (dark olive cluster, figure 2) was found in the western Sahel region and some parts of eastern and southeastern Africa. Poor soil fertility illustrates an agro-constraint that restricted smallholder farmers' production of staple crops such as maize, sorghum and millet in southwestern Zimbabwe (Ncube et al 2009). Better resource-endowed farmers who owned livestock used manure to partially improve soil fertility and crop productivity while resource-poor farmers relied on remittances and governmental support, including food for work schemes and food assistance, to cope with rain shortages.
In the regions with poorest governance and high erosion sensitivity (turquoise cluster, figure 1), one nested archetype showed absence of governance, lack of income and medium undernourishment in Somalia (yellow cluster, figure 2), representing 5% of the nested archetypes' population (table 3). For example, on-going violence, debt repayment and recurrent droughts have largely exhausted the asset base of politically marginalised agro-pastoralists in Somalia (Le Sage and Majid 2002). In particular, reduced herd sizes had decreased the pastoralists' capacity to sell livestock as a key strategy for coping with dry periods, resulting in a reduced number of daily meals (Le Sage and Majid 2002), thus contributing to the undernourishment depicted by this nested archetype. In contrast to the more agriculture-based economies addressed so far, there is one nested archetype representing most remote areas, weak governance, higher income and severe undernourishment (beige cluster, figure 2) that clearly distinguished the economies of Sudan and Angola. Weak governance and remoteness limited people's capacity to produce sufficient food and prepare for climate, market and other risks. The combination of higher income and undernourishment again suggested strong inequalities in wealth distribution, which is corroborated by a higher GINI Index, above all in Angola (World Bank 2015). Industries constituted the main share of gross domestic product in Angola (72%) while agriculture (42%) and services (37%) were important in Sudan (FAO 2014).
3.3. Regional potential for sustainable intensification
Agricultural productivity is a major driver of well-being (Irz et al 2001) such that sustainable agricultural intensification provides essential opportunities for reducing farming systems' vulnerability (Pretty et al 2011). The archetypes identified in this study help to identify those regions where sustainable intensification is a viable strategy for reducing vulnerability. They provide entry points for discussing sustainable intensification strategies at regional scales and identifying potential out-scaling domains, that is to say regions with similar socio-ecological potentials and constraints where interventions can be tested (Coe et al 2014). Within such scaling domains, intensification approaches can be suggested, but the implementation of particular practices will require in-depth knowledge of the local socio-ecological circumstances in which farmers operate.
If better agropotential, low erosion sensitivity and better governance are regarded as prerequisites for success, sustainable intensification can particularly support vulnerability reduction in the medium undernourishment, better governance and lowest erosion sensitivity archetype (dark olive cluster, figure 2). These regions constituted 21% of the nested archetypes' area (table 3) and comprised 9% of the broad archetypes (table 2). Favourable socio-political conditions are especially valuable for improving information access, knowledge co-creation and trust-building among all stakeholders as a prerequisite for successful intensification (Pretty et al 2011). For example, effective agricultural extension services and well-enforced environmental legislation were cornerstones for sustainably intensifying smallholder agriculture in southwestern Niger (Reij and Smaling 2008), where this nested archetype was found. Extension services had provided information about half-moon structures and contour stone bunds for capturing rainwater and reducing nutrient loss in order to overcome water scarcity and soil infertility.
If erosion can be controlled, the nested archetypes depicting low to medium undernourishment and better agropotential and severe undernourishment and lower agropotential (light and dark brown clusters, figure 2) would also be suited for sustainable intensification. These areas represented 41% of nested archetypes (table 3) and 17% of broad archetypes (table 2). The slightly better agropotential in the light brown cluster may be more attractive but would require careful consideration to avoid potential soil erosion. Moreover, the relatively good governance and somewhat lower remoteness in this archetype indicated supportive socio-political conditions. Finally, the severest undernourishment and medium governance archetype (light olive cluster, figure 2) may also provide suitable conditions for sustainable intensification given relatively good agropotential and low erosion sensitivity, though requiring governance improvement. In total, these four nested archetypes represented 31% of the drylands in sub-Saharan Africa encompassing 36% of the dryland population (tables 2 and 3). This constitutes a substantial dryland area well-suited to complementing sustainable intensification efforts in the humid parts of Africa. A next step would be to estimate these regions' potential for sustainably increasing agricultural production taking into account (i) the socio-ecological causes of yield gaps and ways of closing them (Tittonell and Giller 2013, Jägermeyr et al 2016), (ii) spatial interactions between land use and agri-food systems (Verburg et al 2013, Zimmerer et al 2015) and (iii) the potential of particular intervention options such as irrigation to support the transition towards sustainably intensified agriculture (Amjath-Babu et al 2016).
Moreover, the archetypes provide useful insights for transferring intensification approaches, assuming that suitable interventions are comparable among similar vulnerability situations (Sietz et al 2011a, Kok et al 2016, Václavík et al 2016). Ingram et al (2002) studied agricultural practices and the potential of seasonal weather forecasts to enhance productivity in three types of farming systems in Burkina Faso. For example, subsistence-oriented farmers frequently used soil conservation measures such as stone bunds to improve the productivity of heavily eroded upland soils in parts of the Central Plateau categorised in the erosion-sensitive light brown cluster (figure 2). Stone terraces also contributed to overcoming erosion as a major productivity constraint in drylands in southern Kenya (Ifejika Speranza et al 2008), classified in the same archetype (light brown cluster). In this region soil erosion was one of the major concerns smallholder farmers raised regarding food security. At the same time, precipitation variability undermined food production in both central Burkina Faso and southern Kenya, rendering seasonal weather forecasts an important risk-reduction strategy (Ingram et al 2002, Ifejika Speranza et al 2008). In particular, forecasts about the onset and length of the rainy season could assist farmers in both regions in timing their cropping activities and using faster-maturing varieties (Ingram et al 2002, Ifejika Speranza et al 2008).
These empirical insights highlight the value of the nested pattern approach presented in this study. They demonstrate that the membership in a nested archetype can help to better understand sustainable intensification opportunities in order to reduce vulnerability in a given location. The broad archetypes reflected the empirical findings only partly. With regard to implementation, attention needs to be given to socio-ecological synergies and trade-offs (Sendzimir et al 2011, Lahmar et al 2012, Descheemaeker et al 2016), as well as key dynamics pertaining to the uptake, modification, abandonment and replacement of intensification strategies (Sietz and Van Dijk 2015). These finer-scale interactions remain beyond the scope of a continental assessment due to the lack of appropriate data, yet they are important for mainstreaming sustainable intensification and climate adaptation in policy planning (Sietz et al 2011b, Wright et al 2014).
4. Conclusions
This study identified spatially explicit archetypes of farming systems' vulnerability in the drylands of sub-Saharan Africa, focusing on two spatial scale extents. Cluster analysis revealed eight broad archetypes of vulnerability in all drylands of sub-Saharan Africa and resulted in a further refinement of six nested archetypes in those regions with higher agropotential and agricultural livelihoods. The broad archetypes differentiated regions according to erosion sensitivity, governance and degree of urbanisation. Refining a selection of broad archetypes, the nested archetypes reflected finer-scale differences between governance, income and undernourishment that remained hidden in the broad patterns, yet still maintaining an intermediate level of complexity between local and continental scales. Advancing archetype analysis through an assessment of nested patterns, this study facilitated a more elaborated discussion of vulnerability and sustainable intensification prospects at a regional scale including the transferability of intensification strategies. Based on the selected indicators, it provided entry points for sustainable agricultural intensification suited to reducing vulnerability above all in western, southeastern and eastern Africa.
The meaningful generalisation of heterogeneous vulnerability situations contributes to the worldwide synthesis of the mechanisms that influence vulnerability and land use (Sietz et al 2011a, Magliocca et al 2015, Van Vliet et al 2015, Kok et al 2016), one of the foundations of sustainability science (Reynolds et al 2007, Turner et al 2007). The insights of this study are suited to informing the measures needed to achieve the Sustainable Development Goals on food security (SDG 2) and sustainable land management (SDG 15), drawing attention to land restoration and maintenance, governance improvement and the enhancement of farming systems' integration in decision making. The socio-ecological perspective enables a more comprehensive debate on vulnerability and sustainable intensification than purely productionist arguments. The spatially explicit indication offers decision makers the opportunity of evaluating a specific region's potentials and challenges in its wider context across nested scales.
Acknowledgments
The research presented in this study was funded by the Netherlands Organisation for Scientific Research Project 'Connecting micro and macro: Bringing case studies and model-based approaches together in analysing patterns of vulnerability to global environmental change' (NWO Project Number: 830.10.001). We would like to thank two anonymous reviewers for their constructive comments on the paper.