

Abstract
Flood early warning systems mitigate damages and loss of life and are an economically efficient way of enhancing disaster resilience. The use of continental scale flood early warning systems is rapidly growing. The European Flood Awareness System (EFAS) is a pan-European flood early warning system forced by a multi-model ensemble of numerical weather predictions. Responses to scientific and technical changes can be complex in these computationally expensive continental scale systems, and improvements need to be tested by evaluating runs of the whole system. It is demonstrated here that forecast skill is not correlated with the value of warnings. In order to tell if the system has been improved an evaluation strategy is required that considers both forecast skill and warning value.
The combination of a multi-forcing ensemble of EFAS flood forecasts is evaluated with a new skill-value strategy. The full multi-forcing ensemble is recommended for operational forecasting, but, there are spatial variations in the optimal forecast combination. Results indicate that optimizing forecasts based on value rather than skill alters the optimal forcing combination and the forecast performance. Also indicated is that model diversity and ensemble size are both important in achieving best overall performance. The use of several evaluation measures that consider both skill and value is strongly recommended when considering improvements to early warning systems.
Export citation and abstract BibTeX RIS

Original content from this work may be used under the terms of the Creative Commons Attribution 3.0 licence.
Any further distribution of this work must maintain attribution to the author(s) and the title of the work, journal citation and DOI.
1. Introduction
Flood Early Warning Systems (EWS) are vital for enhancing disaster resilience (Guha-Sapir et al 2013, Stephens et al 2015a, 2015b, Carsell et al 2004, Coughlan de Perez et al 2016, Girons Lopez et al 2017), particularly for serious flooding in transnational river basins (Emerton et al 2016, Eleftheriadou et al 2015, Webster et al 2010). Although flood forecasts are improving (Pappenberger et al 2011, Collier 2016), EWS developers still face considerable challenges (Pagano et al 2014, Wetterhall et al 2013, Zia and Wagner 2015).
One of the most prominent challenges is understanding how best to evaluate scientific improvements within a computationally intensive operational forecasting environment. The complexities of these systems mean that when small scientific or technical improvements are made, the consequent improvements to the forecasted variables and flood warnings are not necessarily straightforward. For example improvements in grid resolution, bias correction or additional data assimilation do not always produce the expected results because of feedbacks in the system (Kauffeldt et al 2015, Adams and Pagano 2016, Supplementary material: section S1, figure S1 stacks.iop.org/ERL/12/044006/mmedia). Thus the only way to comprehensively evaluate improvements in such complex systems is through an intensive set of numerical experiments which run the whole system (as for weather forecasting systems see for example https://software.ecmwf.int/wiki/display/FCST/Terminology+for+IFS+testing).
Another consideration is that decisions about the utility of improvements to EWS are typically based on an assessment of how physically consistent the system is with respect to observations. This is measured in terms of the quantitative skill of the system in forecasting variables such as river discharge or water level (Pappenberger et al 2015a, Robertson et al 2013, Wanders et al 2014). However, investment decisions about EWS instead consider the cost-benefit ratio of predictions, such as the value of flood warnings issued (Pappenberger et al 2015b). This reliance on skill measures to evaluate system improvements may exist because it is usual practice to evaluate system skill and alternatives are simply not considered, or because there is an inherent assumption that skill is correlated with value (which it may not be) or because evaluating the value of warnings is a very resource and data hungry activity which is not easy to achieve.
In this paper this mismatch is addressed by evaluating EWS improvements using traditional measures of forecast skill and measures of the value of the warnings, and a number of hybrid measures. The EWS used is the European Flood Awareness System (EFAS) which is an operational continental scale flood EWS (Smith et al 2015, 2016). A large set of reforecasts from EFAS is used to evaluate a system improvement that has never been previously objectively and fully tested in EFAS: the implementation of a multi-model Numerical Weather Prediction (NWP) forcing framework. Such a framework should theoretically provide a better estimation of uncertainty and an improved predictive distribution than a single forcing approach (Ajami et al 2006, Zsótér et al 2016).
2. Methods
In this paper, the whole integrated EFAS EWS is used to demonstrate a new skill-value evaluation strategy in the testing of the implementation of a multi-forcing framework. The experiment uses a large set of flood forecasts generated with a 2 year EFAS reforecast. Multi-forcing approaches use forecast combination techniques, which require the estimation of weights for each individual flood forecast, or ensemble of flood forecasts. All possible permutations of the NWP forcings available to EFAS are optimized in order to test the hypothesis that the full multi-model forcing provides the highest forecast skill and highest warning value (figure 1). The weights are optimized using five evaluation measures which range from traditional river discharge skill evaluation through to evaluating flood warning value (section 2.2). A sensitivity analysis is then undertaken in order to evaluate the impact of the model forcing combinations on EFAS performance. The combinations are evaluated relative to one another, again using evaluation measures ranging from river discharge skill through to flood warning value (figure 1). Following best practice for sensitivity testing (Saltelli et al 2008), first a Leave One out Comparison (LOOC) is undertaken followed by an Add One In Comparison (AOIC) (section 2.3). In order to avoid confusion in such a complex analysis, when the evaluation measures are used for optimization they are referred to as Methods1–5, and when the evaluation measures are used for the sensitivity analysis the method names (CRPS, SEDI, etc) are used (see figure 1).
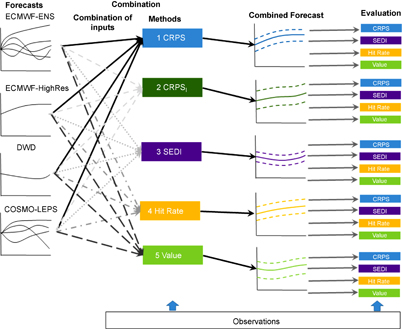
Figure 1 An overview of the experimental design for evaluating the implementation of multi-model forcings in the EFAS EWS. River discharge forecasts are produced by forcing EFAS with different NWP models ('Forecasts'). These forecasts are then combined in all possible permutations; the weightings for each combination are calculated by optimizing the past 90 d of forecasts against proxy observations using 5 different methods (1:CRPS, 2:CRPS-lagged, 3:SEDI, 4:Hit Rate and 5:Value). This then produces a large set of combined forecasts which are evaluated against one another in a sensitivity analysis. The evaluation measures used in the sensitivity analysis are CRPS, SEDI, Hit Rate and Value. In order to avoid confusion in such a complex analysis, when the evaluation measures are used for optimization they are referred to as methods 1–5, and when the evaluation measures are used for the sensitivity analysis the method names (CRPS, SEDI, etc) are used.
Download figure:
Standard image High-resolution image2.1. The European Flood Awareness System (EFAS)
EFAS produces probabilistic flood warnings up to 15 days ahead as part of the Copernicus Emergency Management Service (Bartholmes et al 2009, Smith et al 2015, 2016, Thielen et al 2009). EFAS was developed by the European Commission to contribute to better flood risk management in advance of and during flood crises across Europe. The system provides both National authorities and the European Commission with pan-European overviews of forecasted floods with the aim of improving coordination of aid and acting as a complementary source of information for national systems. The system is now forced with NWP forecasts that are both global and regional, deterministic and ensemble-based. The hydrological model is LISFLOOD (Van Der Knijff et al 2010) which is setup over the European domain on a 5 × 5 km grid and also for 768 river catchments, which are used in the operational EFAS for monitoring and post-processing. The forecasts are bias-corrected and post-processed at the locations where real-time hydrological observations are available (Smith et al 2016). Further details on the EFAS NWP forcings, flood warning decision rules and performance are provided in the supplementary material section S2.
When the EFAS has a system upgrade, a 'reforecast' is produced in order to evaluate the new changes to the system. Reforecasting is also known as hindcasting or retrospective forecasting and involves computing forecasts with the new EFAS configuration for past dates. The most recent reforecast for EFAS was produced in January 2014 (ECMWF 2014, Salamon 2014) and covers the 2 year period January 2012 to December 2013. The reforecasts used in this study are issued daily, looking up to 10 d ahead for the whole European domain. Here forecast lead times of 3–10 d are used in the analysis, as EFAS is a medium-range forecasting system that is designed for forecasts of lead times of 3 days and longer.
The NWP forcings for EFAS could be combined in a number of different ways (figure 1, table 1). It is assumed in the operational EFAS that the full multi-forcing combination (configuration 15) provides the best system performance but hitherto this has not been tested. As spatially distributed observed discharge data are not available, and the quality and coverage of station observations over the European domain are very unequal (Smith et al 2016), the river discharge observations used in this study to evaluate the reforecasts are proxies, derived from routing observed rainfall through the hydrological model (as per Pappenberger et al 2008, 2015). As the same model is used for observations and the predictions, this also allows us to control for a number of other uncertainties.
Table 1. Configurations of NWP forcings available to produce EFAS forecasts. All possible permutations are evaluated. DWD refers to the deterministic, high-resolution forecast issued by the Deutsche Wetterdienst. ECMWF-Highres refers to the deterministic, high resolution forecast issued by the European Centre for Medium-range Weather Forecasts (ECMWF). ECMWF-ENS refers to the ensemble forecast issued by the ECMWF. COSMO-LEPS refers to the ensemble forecast issued by the COSMO Consortium. (Details are provided in Smith et al 2016).
| Configuration | DWD | ECMWF-Highres | ECMWF-ENS | COSMO-LEPS |
|---|---|---|---|---|
| 1 | • | |||
| 2 | • | |||
| 3 | • | |||
| 4 | • | |||
| 5 | • | • | ||
| 6 | • | • | ||
| 7 | • | • | ||
| 8 | • | • | ||
| 9 | • | • | ||
| 10 | • | • | ||
| 11 | • | • | • | |
| 12 | • | • | • | |
| 13 | • | • | • | |
| 14 | • | • | • | |
| 15 | • | • | • | • |
2.2. Forecast improvement: combination and optimization
First the flood forecasts are combined, requiring the estimation of weights for each individual forecast or ensemble of forecasts in order to optimise the output of the systems against the proxy observations. This is done for each of the 768 river catchments.
The river discharge forecasts from different NWP are combined using nonhomogeneous Gaussian regression, NGR (Gneiting et al 2005) (equation (1)).
ys,t: discharge at location s and lead time t.
fi,s,t: mean of the ith ensemble forecast (in case of ensemble forecast)/forecast value (in case of deterministic forecast) at location s and lead time t
M: number of systems
w,g: bias correction parameters
h,y: spread correction parameters
si,s,t: the standard deviation of the ith ensemble forecast. In the case where only a deterministic forecast is used this is replaced by the forecast value.
The parameters of the NGR can be estimated by optimising an evaluation measure on the past 90 d of forecasts. Here five different evaluation measures are used for this optimization stage. These have been selected to cover the range from a traditional skill based evaluation measure (method 1) through to a monetary value based score (method 5), with hybrid scores in between (methods 2–4).
2.2.1. Optimization method 1: optimization using continuous rank probability score (CRPS) (for each lead time), CRPS
Method 1 considers the skill of river discharge and optimizes the CRPS (Hersbach 2000) for each lead time. The NGR is optimized independently for each lead time and location using the analytical formula for the CRPS given in Grimit et al (2006).
2.2.2. Optimization method 2: optimization using continuous rank probability score (CRPS) for lagged forecasts, CRPSl
Warning decisions in EFAS are based on lagged forecasts. Consecutive forecasts are required to issue an alert as this provides a better false alarm rate (see supplementary material S2). The CRPS is optimized using a NGR formulation which contains not only the most recent forecast, but also forecasts issued 3–10 days beforehand increasing the number of ensemble systems i used in equation (1). This method is hence closer to the relevant decision rules (Cloke and Pappenberger 2008).
2.2.3. Optimization method 3: optimization using the symmetric extreme dependency index, SEDI
In this method, the performance of warnings which use lagged forecasts is scored in terms of hits, misses, false alarms and correct rejections using a contingency table and the decision framework shown in table S2. Flood events are low frequency events and so the Symmetric Extreme Dependency Index (SEDI) is used (Ferro and Stephenson 2011, North et al 2013):
Where H is the hit rate:
And F is the false alarm rate:
where a, b, c, and d are the number of hits, the number of false-alarms, the number of misses and the number of correct rejections respectively. The SEDI ranges from [−1, 1], taking the value of 1 for perfect forecasts and 0 for random forecasts, therefore scores above 0 have some degree of skill.
2.2.4. Optimization method 4: optimization using the hit rate
As false alarms have a low cost in early warnings (Dale et al 2013), method 4 uses an objective scoring function for optimization which focusses on the number of hits and misses (the hit rate, equation (3)) for lagged forecasts as a proxy for monetary benefit.
2.2.5. Method 5: optimization using value
Pappenberger et al (2015) have estimated the monetary value of the EFAS by calculating the avoided flood damages of the early warnings and comparing with the costs of implementation and running the system. This required a large analysis involving details of EFAS forecasts, the EU and national forecasting context of EFAS, the flood alert decision rules, damage data sets (Barredo (2009), the EM-DAT (EM-DAT 2014) emergency events database and complementary information from the European Solidarity fund application (EC 2014)), and the calculation of avoided flood damages.
However, when making comparisons of various setups within any one early warning system (in this case EFAS), the monetary value can be evaluated using an analysis of just the hits (correct forecasts) (Pappenberger et al 2015). This is because the base investment value in the system and the running costs remain static, the false alarms can be neglected (as above in method 4) and the total number of observed flood events (hits + misses) remains constant in the evaluation dataset. Optimizing against the hits is directly equivalent to optimizing against the value, and thus the approach taken in Method 4 can be modified to use only the hits in the optimization and will reflect directly the monetary value (a in equation (3)).
2.3. Sensitivity analysis of forecast improvements
The optimised EFAS forecast sets are evaluated against one another in order to understand the influence and contributions of the different input forcings. This necessarily uses objective skill and value evaluation measures based on CRPS, SEDI, Hit Rate and Value to evaluate forecast performance (i.e. based on the same evaluation measures used for the optimization, see section 2.2 and figure 1). The mean of the CRPS for all lead times above 3 d (CRPSm) is used for comparison with other evaluation measures (lead times above 3 d are selected in this calculation as EFAS is a medium-range forecasting system that is designed for forecasts of lead times of 3 d and longer). The CRPS-lagged does not appear in this part of the analysis as this requires weighting past forecasts, which requires optimization.
The sensitivity analysis methodology follows recommendations from Saltelli et al (2008). First a 'Leave One Out Comparison' (LOOC) is performed, in which the combinations containing a particular forcing (or group of forcings) are compared with the combinations that do not contain the individual forcing (or group of forcings) (the score reference). For example, and referring to table 1, for the DWD forcing, combinations 1, 5, 6, 7, 11, 12, 13 (which contain the DWD forcing) are compared with combinations 2, 3, 4, 8, 9, 10, 14 (which do not contain the DWD forcing).
Second, an 'Add One In Comparison (AOIC)' is performed in which an individual forcing/group of forcings is added to each combination and compared to the combination without it (the score reference). For example, and again referring to table 1, for the group of forcings 'ECMWF-ENS and COSMO-LEPS', combinations 13, 14 and 15 are compared with combinations 1, 2 and 5.
In the sensitivity analysis, evaluation of the different configurations is undertaken using 'skill' scores. Using one specified system configuration as the reference, the individual scores are divided by the reference score and thus normalised. The higher the score the better, and anything above 0 indicates 'skill' of the forecast in relation to the reference. The CRPS, thus becomes the CRPSS (Continuous Rank Probability Skill Score) by dividing by the CRPS of the reference configuration. The SEDI becomes the SEDIS (Symmetric Extreme Dependency Index Skill Score) by dividing by the SEDI of the reference configuration. The Hit Rate becomes the Hit Rate Skill by dividing by the Hit Rate of the reference configuration. The Value becomes the Relative Value by dividing by the Value of the reference configuration.
3. Results
Results are presented as an average over all of the 768 EFAS river catchments for the full reforecast data set.
3.1. Is an optimization method looking at both skill and value required?
First, evidence is presented on the requirement to consider both skill and value in the optimization methods used to combine forecasts. The spearman rank correlations between the methods are shown in table 2, with the mean value of all optimization methods provided in the bottom row. These demonstrate the expected relationships between scores, in that those that are most similar in terms of their constructions tend to have the higher correlations, for example, the relationships between the SEDI, Hit rate and Value scores, the 3 scores that most represent value. There is also some correlation between CRPSm and SEDI. Correlations, however, are in general weak, which is not surprising as the optimization methods are a mix between continuous and threshold based scores including various transformations. This highlights the necessity of considering both a range of optimization methods and evaluation measures to evaluate the system, and no one measure can fully replace another.
Table 2. Spearman Rank correlations between the different objective scoring functions: CRPSm, SEDI, Hit Rate and Value for all 5 optimization methods. All values shown are significantly different from 0 (p = 0.05).
| Rank Correlation between scoring functions | ||||||
|---|---|---|---|---|---|---|
| Optimization Method | CRPSm vs SEDI | CRPSm vs Hit Rate | CRPSm vs Value | SEDI vs Hit Rate | SEDI vs Value | Hit Rate vs Value |
| 1 | −0.48 | 0.04 | 0.07 | 0.68 | −0.11 | 0.21 |
| 2 | −0.39 | 0.18 | 0.07 | 0.60 | −0.11 | 0.15 |
| 3 | 0.06 | −0.08 | −0.04 | 0.29 | −0.10 | 0.20 |
| 4 | 0.12 | 0.01 | −0.05 | 0.44 | −0.17 | 0.08 |
| 5 | −0.20 | 0.23 | 0.002 | 0.58 | −0.12 | 0.15 |
| Mean | −0.18 | 0.08 | 0.01 | 0.52 | −0.12 | 0.16 |
The forecast performance for the CRPSm and Value ranked between forcing combinations (numbered) for the 5 different methods of optimization (shapes) is shown in figure 2. This also demonstrates that skill and value are not well correlated and therefore the importance of an evaluation strategy that explicitly considers value as well as skill. The full complexity of attempting multi-forcing combination is shown by the variation in rankings between the different methods for the different forcing combinations. However, the full multi-model ensemble forcing combination (No 15, shown in a circle) ranks high for both Value and CRPSm (although not quite the highest). It also shows remarkable consistency between all methods used for optimization and supports the implementation of the full multi-forcing ensemble combination at the European scale for EFAS.

Figure 2 Ranks based on average CRPSm and average Value for all 768 EFAS river catchments, for the whole reforecast period for each multi-forcing configuration. The numbers indicate the forecast combination (table 1) and the shapes indicate the method used to optimize. The full multi-forcing ensemble is ringed.
Download figure:
Standard image High-resolution image3.2. Which NWP forcings have the greatest relative contribution to improved forecast performance?
In order to understand the relative contribution of an individual NWP model forcing to the EFAS forecast performance, a comparison between all combinations in which the forcing is used to the situations when the forcing is not used is performed over all catchments, for the whole reforecast dataset, employing the Leave One Out comparison (LOOC) method. Table 3 shows the mean and standard deviation (all forecast start dates and river catchments) of the skill score values. Values above 0 indicate a positive contribution to forecast performance (i.e. making the forecasts better), with higher numbers meaning an increasingly positive contribution. Values lower than 0 indicating a negative contribution (i.e. making the forecasts worse). Although numerical values in the cells cannot be directly compared with each other because they are different optimization-evaluation combinations, larger values indicate better performance and larger standard deviations indicate greater space-time variability across forecasts and river catchments.
Table 3. Relative contribution of the NWP forcings to EFAS forecast performance for the 5 optimization methods and 4 evaluation measures. Positive numbers represent a positive contribution to the forecast performance (i.e. this forcing is making the forecasts better) and negative numbers represent a negative contribution to the forecast performance (i.e. this forcing is making the forecasts worse). Direct intercomparison of the values is not possible because they are different optimization-evaluation combinations, but larger values indicate better performance and larger standard deviations indicate greater space-time variability across forecasts and river catchments.
| DWD | ECMWF-Highres | ECMWF-ENS | COSMO-LEPS | |||||||||||||||||
|---|---|---|---|---|---|---|---|---|---|---|---|---|---|---|---|---|---|---|---|---|
| Optimization Method | 1 | 2 | 3 | 4 | 5 | 1 | 2 | 3 | 4 | 5 | 1 | 2 | 3 | 4 | 5 | 1 | 2 | 3 | 4 | 5 |
| CRPSSm (⁎10) | 3 ± 1 | 2 ± 2 | 1 ± 2 | 1 ± 2 | 0 ± 2 | 2 ± 1 | 2 ± 2 | 1 ± 2 | 1 ± 2 | 1 ± 2 | 4 ± 1 | 3 ± 2 | 2 ± 2 | 2 ± 2 | 2 ± 2 | −1 ± 1 | −1 ± 3 | 1 ± 2 | 1 ± 3 | 0 ± 3 |
| SEDIS (⁎1000) | 4 ± 11 | 0 ± 11 | 2 ± 5 | 2 ± 11 | 3 ± 283 | 4 ± 10 | 6 ± 10 | 5 ± 5 | 5 ± 12 | 1 ± 218 | 3 ± 14 | 8 ± 12 | 5 ± 6 | 6 ± 11 | 18 ± 208 | −6 ± 15 | −11 ± 12 | −7 ± 13 | −9 ± 17 | 262 ± 734 |
| Hit Rate Skill (⁎1000) | 7 ± 33 | 0 ± 33 | 2 ± 32 | 2 ± 35 | −13 ± 31 | 10 ± 20 | 14 ± 23 | 5 ± 10 | 6 ± 16 | −8 ± 16 | 3 ± 27 | 15 ± 27 | 3 ± 9 | 5 ± 15 | −5 ± 15 | −21 ± 53 | −24 ± 25 | −9 ± 24 | −13 ± 30 | 7 ± 21 |
| Relative Value (⁎100) | 4 ± 12 | 3 ± 11 | 0 ± 8 | 0 ± 7 | 6 ± 10 | 2 ± 7 | 2 ± 8 | 0 ± 3 | 0 ± 3 | 6 ± 7 | 0 ± 8 | 0 ± 9 | 0 ± 3 | 0 ± 3 | 6 ± 6 | 3 ± 20 | 1 ± 12 | 5 ± 9 | 6 ± 9 | −5 ± 8 |
Results show that most of the combinations have a positive contribution to EFAS performance regardless of the skill/value score or optimization method used; results for the DWD, ECMWF-Highres and ECMWF-ENS nearly always show a positive contribution. This provides good evidence for employing a multi-forcing framework for EFAS.
The picture for COSMO-LEPS is more mixed and does not add value to forecast performance in many of the combinations. However, COSMO-LEPS results also exhibit a very large variance which suggests that the contribution is very variable across Europe. If analysis is restricted to the Alpine area over which the high resolution COSMO-LEPS is considered to outperform lower resolution models, there is significant improvement in the COSMO-LEPS score (1 ± 1 as opposed to −1 ± 1 for method 1 and CRPSSm) with little deterioration in the other scores (3 ± 0.9 DWD; 2 ± 1 ECMWF-Highres; 3 ± 1 ECMWF-ENS 1 ± 1), indicating the value added from the COSMO-LEPS forcing even though it deteriorates the Europewide mean. This is an important finding because it means that in some areas there is a positive contribution to forecast performance even though the spatio-temporal mean is negative, and thus forcings to EFAS cannot be discounted purely on a spatio-temporal mean of performance.
If the analysis considers river catchments individually and looks for a maximum value from any of the catchments (rather than the mean over all catchments) then for Relative value and method 3 the following values are achieved: 33 (DWD), 17 (ECMWF-Highres), 22 (ECMWF-ENS), 100 (COSMO), which are significantly larger than the numbers in table 3. There are thus very strong spatial dependencies in the scores achieved for different combinations of forcings. There are also variations depending on the optimization method and the evaluation methods used. To highlight this figure 3 shows for each EFAS river catchment, the NWP forcing with the maximum positive contribution to EFAS forecast performance for the CRPS (a) and the Value (b). Each colour represents a different forcing and the spatial variability across the catchments is clearly shown. Considering the dark red colour which represents the DWD forcing as an example, those catchments in which EFAS forecasts improve the most when the DWD is added are shaded. Although there is some overlap between figures 3(a) and (b) in this shading, there are also substantial differences in the catchments shaded. This indicates that there would be significant gains to be achieved in flood forecast performance by using particular forcing combinations for individual river catchments, and also that these gains should be evaluated in terms of both skill and value as the results differ substantially. The resulting patterns are necessarily complex because of the spatial variability in the hydrological regimes of the river catchments as they respond to the variations in the performance of the numerical weather forecasts (i.e. river discharge responds non-linearly to changes in rainfall and varies between catchments). The impact of spatial variability in the optimal forcing combinations for EFAS should be explored further in future research.
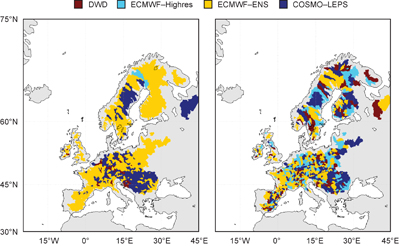
Figure 3 NWP forcing with the maximum contribution to EFAS forecast performance gain per river catchment (a) CRPS (b) value.
Download figure:
Standard image High-resolution image3.3. Which NWP forcing most improves forecast performance when added to an existing configuration?
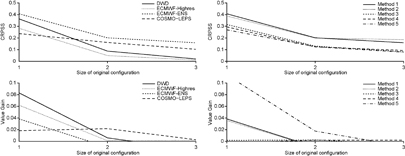
To evaluate which forcing is the most beneficial when added to an existing configuration, the Add One In Comparison (AOIC) method is used. Figure 4 shows the improvements in forecast performance when a forcing is added to an existing configuration. First, it should be noted that these results demonstrate the value of multi-forcing ensembles. With increasingly large configurations the skill and the value continues to increases (i.e. the lines are not horizontal), although this effect is smaller for Relative Value (bottom row) than for CRPSS (top row). This is true for the addition of all forcings and for all optimization methods. This supports the implementation of a multi-forcing framework and suggests it provides an improved predictive distribution than a single forcing approach. It also suggests that the monetary benefit of the EFAS as calculated by Pappenberger et al (2015) would be lower without the full multi-forcing ensemble.
Figure 4 ((a)—left column) Improvements through adding forcings to an existing configuration for Method 1. The top figure shows CRPSSm. The bottom figure shows Relative Value. The higher the values the higher the gain. ((b)—right column) Improvements through adding forcings to an existing configuration for ECMWF-ENS forecast. The top figure shows CRPSS). The bottom figure shows Relative Value. The higher the values the higher the gain.
Download figure:
Standard image High-resolution image
Figure 4(a) (left column) shows the improvements in CRPSSm and Relative Value from adding an additional forcing to an existing configuration (for all optimization methods). As would be expected, the larger the multi-forcing ensemble the less added value an individual forcing has. ECMWF-ENS contributes considerably more in terms of CRPSSm performance than any other NWP model. In terms of relative value gain the picture is less clear, with DWD and ECMWF-Highres adding the most value to the multi model system. This suggests that model diversity is of greater importance for improving the hit rate but ensemble size is more important for improving the CRPS. Figure 4(b) compares the different optimization methods focusing on the ECMWF-ENS forcing. Method 1 and 2 perform similarly, considerably outperforming method 3 and 4 in CRPSSm as well as Relative Value. Additional skill gain in CRPSSm and Relative Value is very similar in a system which uses 3 or 4 forcings (size of original configuration 2 or 3). Given the substantial resource and political costs of adding any additional forcing into a continental scale flood forecasting system in terms of implementation and maintenance, one conclusion from these results could be that adding a 4th forcing is not worthwhile. However given the high correlation in the physics between the ECMWF models, additional diversity by incorporating other NWP forcings remains an attractive option (Hagedorn et al 2012).
4. Conclusions
This work has demonstrated that when evaluating the impacts of scientific and technical improvements to flood early warning systems the correlation between the skill of forecast variables and the value of warnings is not high and an evaluation strategy that considers both components is necessary. This will also be true for other earth system modelling and forecasting systems.
Here a new skill-value strategy has been tested on multi-forcing optimization of the European Flood Awareness System (EFAS). The full multi-forcing ensemble achieves a good flood forecast performance in both skill of river discharge forecasts and value of warnings and this configuration is recommended for operational forecasting and warning at the European Scale, but spatial variations are evident when looking at individual river catchments. Optimization of forecasts based on value rather than skill alters the optimal forcing combination and the forecast performance. Results indicate that a multi-model forcing framework provided an improved predictive distribution over a single model approach. In this evaluation adding more than 2 NWPs to a multi-forcing ensemble only brought small benefits in terms of score values, although, it should also be remembered that achieving diversity in NWP forcing models is also important for improving forecast hits, and the ensemble size is important for improving forecast skill. It should also be noted that the full multi-forcing framework brings the most benefit in forecast performance which indicates that the monetary benefit of the EFAS would be lower without the full multi-forcing ensemble.
Where possible the use of a full suite of skill-value evaluation methods is strongly recommended. Those evaluating modelling and forecasting systems with only one skill based evaluation method due to computational or other resource constraints, should consider the diversity of performances found in this study and that system skill may not reflect system value.
Acknowledgments
The authors wish to acknowledge funding from the 'IMPREX' EC Horizon 2020 project (641811). Open data policy note: The data from the European Flood Awareness System are available to researchers upon request (subject to licensing conditions). Please visit www.efas.eu for more details.