

Abstract
Understanding the environmental drivers of biodiversity persistence and community organization in natural ecosystems is of great importance for planning the conservation of those ecosystems. This comprehension is even more important in severely threatened ecosystems. In this context, we analyzed ant communities in tropical dry forests (TDFs) in Brazil. These forests are embedded within other biomes, such as Cerrado and Caatinga. In this study, we asked whether (i) ant species richness and composition changes between TDFs within different vegetation domains; (ii) whether ant species richness and β-diversity increase north-to-south, possibly related to changes in tree richness and tree density; and (iii) species replacement contributes relatively more to β-diversity than does nestedness. We found that species composition is unique to each TDF within different biomes, and that species richness and β-diversity differ among the vegetation domains, being smaller in the Caatinga. We also found that replacement contributes most to β-diversity, although this contribution is lower in Caatinga than in Cerrado. We show that regional context is the main driver of species diversity, which is likely to be driven by both historical and ecological mechanisms. By analyzing large spatial scale variation in TDF environmental characteristics, we were able to evaluate how ant diversity changes along an environmental gradient. The high levels of species replacement and unique species composition of each region indicates that, to fully conserve TDFs, we need to have various conservation areas distributed across the entire range of vegetation domains in which these forests can be found. Thus, we demonstrate that a landscape-wise planning is urgent and necessary in order to preserve tropical dry forests.
Export citation and abstract BibTeX RIS

Original content from this work may be used under the terms of the Creative Commons Attribution 3.0 licence.
Any further distribution of this work must maintain attribution to the author(s) and the title of the work, journal citation and DOI.
1. Introduction
Ant community structure (i.e. species richness and composition) is determined by various ecological mechanisms that operate over several spatial scales (Lach et al 2010). At the local scale, interspecific interactions (e.g. competition, mutualism), resource availability, and environmental variables are often described as the major drivers of ant community structure (Srivastava 1999, Baccaro et al 2012, Camarota et al 2016). Examples of environmental variables include tree richness, height, and abundance (Ribas et al 2003, Klimes et al 2012, Sousa-Souto et al 2016), variation in canopy coverage (Neves et al 2013), and characteristics of soil structure (Schmidt et al 2013). At larger spatial scales, historical processes of community assembly, landscape configuration and variation in temperature and precipitation (both current and historical) are seen as key factors shaping ant communities (Dunn et al 2009, Jenkins et al 2011, Solar et al 2016).
Tropical dry forests (TDFs) in the Neotropical region have undergone dramatic changes in both geographical distribution and the extent of occupation over geological time (Collevatti et al 2013). Brazilian TDFs currently exist as disjunct fragments within the Cerrado, Caatinga and Atlantic forest biomes (Werneck et al 2011). These TDF fragments have low floristic similarity (Oliveira-Filho et al 2006, Apgaua et al 2014, Banda-R et al 2016), mainly due to environmental characteristics such as temperature and humidity rather than historical fragmentation and isolation (Neves et al 2015, Banda-R et al 2016).
Most studies of ant diversity in TDFs seek to understand the mechanisms that determine local community structure (e.g. Gove et al 2005, Delsinne et al 2007, Zelikova and Breed 2008, Neves et al 2010, Neves et al 2013, Sousa-Souto et al 2016), with few studies examining larger spatial scales (but see Delsinne et al 2010, Silvestre et al 2012, and Marques and Schoereder 2014). High plant richness and density, which are good proxies for habitat heterogeneity (Ribas et al 2003, Neves et al 2014, Leal et al 2016), likely influence insect communities since more heterogeneous habitats have been assumed to provide greater resource availability and variety (Stein et al 2014, Leal et al 2016). Ant community studies in TDFs have explored the effects of environmental heterogeneity on species richness at local scales, mainly in terms of tree richness and density (Neves et al 2010, Sousa-Souto et al 2016), but general patterns of ant community responses to these environmental variables have not been reported. For example, Neves et al (2010) found no effect of tree richness and secondary succession on arboreal ant richness, but observed compositional changes with the advancement of secondary succession. At larger spatial scales, historical processes that characterize local evolutionary history, such as migration events, extinction, and speciation, are seen as strong determinants of ant diversity (Silvestre et al 2012, Marques and Schoereder 2014).
Total diversity in a given region—i.e. γ-diversity—can be divided into at least two components, α-diversity (i.e. the number of species at the local scale) and β-diversity (differences in species assemblage composition among sites, Whittaker 1972, Tuomisto 2010). Among the several ways to mathematically relate α and β-diversities; multiplicative partition of diversity (Whittaker 1972) follows the formula γregion = α × β. Furthermore, β-diversity has two underlying components, namely turnover (hereafter species replacement) and species richness differences (hereafter nestedness). Understanding how diversity is partitioned between α- and β-diversities (Whittaker 1972), as well as how β-diversity is decomposed in its two components (i.e. species replacement and nestedness, Baselga 2010) is crucial to uncover the mechanisms underpinning biodiversity patterns.
In this context, we studied ant communities in TDFs located within three different vegetation domains (Cerrado, Caatinga-Cerrado transition and Caatinga). Considering that TDFs have historically changed their distributions and are now isolated patches within different vegetation types (Pennington et al 2009, Marques and Schoereder 2014, Banda-R et al 2016), and that, besides regional scale, tree species richness and density can be proxies for several aspects affecting ant communities (e.g. resource availability and diversity and climatic features; Sousa-Souto et al 2016), we tested the following hypotheses: (i) ant species richness and composition changes between TDFs within different vegetation domains ; (ii) ant α- (richness) and β-diversities increases north-to-south, which coincides with the gradient of rainfall and of tree richness and density. Finally, as several studies in tropical ant communities have been describing (e.g. Solar et al 2015, 2016, Bishop et al 2015), we expect that (iii) species replacement contributes relatively more to β-diversity than does nestedness.
2. Methods
2.1. Study areas
The study was conducted in tropical dry forests (TDFs) in three regions of Brazil within the Cerrado (hereafter Serra do Cipó, central Minas Gerais), Cerrado-Caatinga transition (hereafter North of Minas Gerais), and Caatinga (hereafter Paraíba) domains (figure 1). TDF vegetation consists predominantly of deciduous trees (≥50% of the trees shed leaves in the dry season), with a continuous canopy and low grass density. According to the Köppen classification, climate in the Serra do Cipó is Cwb (humid subtropical with dry winters and temperate summers); in the North of Minas Gerais and Paraiba, the climate is classified as As (tropical with dry summer) (Álvares et al 2013). Total average rainfall ranges between 700 and 2 000 mm and average annual temperature is 25 °C, with three or more months of drought in which rainfall is less than 100 mm month−1 (Sánchez-Azofeifa et al 2005).
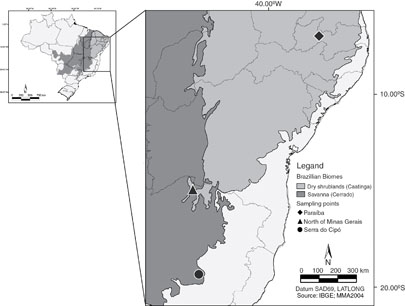
Figure 1 Location and distribution of sampled Tropical Dry Forests within Brazilian vegetational domains. Serra do Cipó (Cerrado)—circle, North of Minas Gerais (Caatinga-Cerrado transition)—triangle and Paraíba (Caatinga)—diamond.
Download figure:
Standard image High-resolution imageThe Serra do Cipó lies in the southern region of the Espinhaço Range, where TDF fragments are on limestone outcrops within the Cerrado domain. The area in North of Minas Gerais includes three protected areas (PAs): the Lagoa do Cajueiro state park, and the Jaíba and Serra Azul Biological Reserves. PA's are part of the Middle São Francisco Valley, a transition region between the Cerrado and Caatinga. The study in Paraíba was conducted at the Fazenda Tamanduá in the Sertão de Piranhas physiographic region, within the Depressão Sertaneja Meridional ecoregion in the Caatinga domain (Velloso et al 2002).
2.2. Ant sampling
Plots (0.1 ha, 20 × 50 m) in different stages of secondary succession were demarcated in each area. We established nine plots in the Serra do Cipó, 15 in the North of Minas Gerais, and 15 in Paraíba. Plots were located at least 100 m apart. Samples were collected at different stages of ecological succession (see Cabral et al 2013, Coelho et al 2012, Madeira et al 2009) in order to cover a broad amplitude of the variables we used to characterize vegetation structure (Yang et al 2015). All samples were collected in the wet season of 2012 between January and May.
In each plot, five sampling points were defined (four at the extremes and one in the center), where we collected ants in epigaeic (foraging on the ground or in soil) and arboreal (foraging in the trees) microhabitats (totalizing 390 pitfall traps: 90 in Serra do Cipó; 150 in North of Minas Gerais and Paraíba). For further analyses, all pitfall traps in a plot were pooled in a single sample to improve site representativeness and reduce detectability issues. Unbaited pitfall traps containing 200 ml of capture solution (detergent + water) were used to collect ants. In epigaeic habitats, traps were buried in the soil with openings at ground level (Bestelmeyer et al 2000). Arboreal pitfalls were installed at a height of 1.30 m in trees with circumference at breast height (CBH) ≥15 cm. The traps remained in the field for 48 hours, after which the material was sent to the laboratory for sorting, assembly and identification of specimens to the lowest possible taxonomic level. Ant species were identified using Baccaro et al (2015). The specimens were deposited in the reference collection of the Laboratório de Ecologia de Insetos at the Universidade Federal de Minas Gerais in Belo Horizonte, Minas Gerais, Brazil.
We acknowledge known limitations of pitfall traps, such as being a passive method that samples primarily actively foraging species (Bestelmeyer et al 2000) and the susceptibility to be influenced by habitat structure, since they can hamper ant locomotion (Melbourne 1999). On the other hand, pitfall traps are among the most popular ant sampling methods and have been successfully employed in many ecological studies with ants (Schmidt and Solar 2010, Ribas et al 2012). Still, the possibility of installing the same trap in the soil and vegetation (Ribas et al 2003) makes pitfall trap sampling suitable for comparisons across strata. Thus, despite the limitations of pitfall traps, this method is suited to our aims, as well as enabling future comparisons with a large number of other studies using the same method.
2.3. Description of vegetation structure
Among the variables that can represent habitat structure, we measured plant species richness (a surrogate for resource variety) and number of trees in each plot (a surrogate for resource availability, table 1). Phytossociological data were obtained from a survey of all trees with diameter at breast height (dbh) ≥5 cm. In order to characterize successional stages, a phytosociological study was undertaken (Yule Nunes, unpublished data) and three successional stages could be distinguished: (1) early regeneration, with high dominance of shrub-like species and scattered trees with a discontinuous canopy; (2) intermediate, with two vertical strata, one with fast-growing trees and another with lianas; and (3) late, composed of three vertical strata, being the first with large trees forming a continuous canopy, the second with juvenile trees of different sizes and the third with typical understorey species. In table 1, we also provide mean annual precipitation for the period between 2000–2012 (Source: INMET—BDMEP—www.inmet.gov.br). In order to provide a more comprehensive description of each site, we also downloaded information about climatic data (Precipitation, Temperature and Radiation) in the study areas from WorldClim (Hijmans et al 2005). We extracted data using the R package raster and data were in a resolution of 30 arc-seconds, using central coordinates for each site.
2.4. Statistical analysis
A species accumulation curve was constructed to compare cumulative species richness and to verify the degree of sampling sufficiency in each area. The number of species was plotted as a function of the number of sampled pitfalls, with 10 000 randomizations performed to generate a confidence interval. A non-parametric estimator (Jackknife 1) was used to estimate total species richness in each TDF.
The influence of the vegetation domains where the TDF is inserted on ant species composition was tested using Permutational Multivariate Analysis of Variance (PERMANOVA, Anderson 2006). P-values were obtained through 999 permutations, using Jaccard dissimilarities. Non-metric multidimensional scaling (NMDS) was used to plot variation in species composition, also using Jaccard dissimilarities (Clarke 1993).
The β-diversity, representing the diversity of differentiation within the plot (i.e. plot heterogeneity) was calculated using Whittaker's formula (Whittaker 1972): β = αplot/αpitfall where αplot is cumulative ant species richness per plot, and αpitfall is average species richness of the five sampling points (pitfall trap) within a plot; in this approach, β-diversity values are mathematically independent of α-diversity values (Jost 2007), which allows comparison of β values among locations with different α-diversity values (Chao et al 2012).
Also, to test which underlying components of β-diversity (species replacement or nestedness) contribute more to differences in within-plot species composition, we decomposed β-diversity for multiple sites as proposed by Baselga (2010) and Baselga and Leprieur (2015). In this analysis the total β-diversity, represented by Sorensen dissimilarity (βSØR), is decomposed into partial contributions of the species replacement (i.e. Simpson dissimilarity βSIM) and nestedness (βSØR − βSIM = βSNE) components. βSØR is a monotonic transformation of Whittaker's β, used in earlier analyses (Baselga 2010). This approach allows us to calculate the relative contribution of each component (%) to total β-diversity.
Generalized Linear Models (GLMs) were run using ant richness per plot (αplot) and β-diversity as response variables. TDF vegetation domains and tree richness and density per plot and interactions were used as explanatory variables in this order, allowing all possible variance to be explained firstly by regional context. If any variance is left to be significantly explained by tree richness and density, we can have more confidence there is still some independent effect of these variables (Crawley 2012). We acknowledge that plots located within each vegetation domains are not fully statistically independent and that some degree of pseudoreplication (sensu Hurlbert 1984) may be present in our sampling design. However, we argue that this was the only way to produce fairly good quality data covering such a large scale (Davies and Gray 2015), keeping a minimum of comparability among TDF sites, such as conservation status, minimum size and successional trajectory (Neves et al 2014, Norden et al 2015). This is a frequent issue in studies dealing with successional stages (Ewers and Pendall 2008, Neves et al 2014, Sousa-Souto et al 2016). In our study specifically, any attempt to intersperse our sampling could have introduced uncontrolled variation in the data, which could lead to spurious successional effects being found in the data.
Full models were constructed and subsequently simplified by removing non-significant explanatory variables until the minimal adequate model was obtained. Residual analysis was conducted to test the suitability of the minimal model for error distribution. Since species richness is a type of count data, we used Poisson errors, correcting for overdispersion (Crawley 2012). Significant minimum models with vegetation domains as the response variable (categorical variable with more than two levels) were subjected to contrast analysis, enabling separation of significantly different levels and lumping of significantly similar levels (Crawley 2012). To provide a more comprehensive understanding of how possible effects could influence ant α and β-diversity, we also made a Pearson correlation plot with all climatic variables from WorldClim, vegetation data, and ant diversity (figure S1 available at stacks.iop.org/ERL/12/035002/mmedia). Finally, we tested whether within plot β-diversity varied among vegetation domains. We used a GLM to test whether the relative contribution (%) of species replacement for β-diversity per plot varied with TDF vegetation domains.
All statistical analyses were performed using the statistical program R v.3.1.1 (R Core Team 2016). Correlation plots were made using the package corrplot v.0.77, analyses of sample sufficiency and species composition were carried out using the package vegan v.2.4 (Oksanen et al 2013), while decomposition of β-diversity was done using the package betapart v.1.3 (Baselga and Orme 2012).
3. Results
In total we sampled 166 ant species distributed in eight subfamilies and 42 genera (table S1). The subfamilies Formicinae and Myrmicinae represent 71.25% of all sampled species, with 84 and 35 species, respectively. The richest genera were Camponotus (24 species), Pheidole (23 species) and Solenopsis (15 species) (table S1).
The TDF in the North of Minas Gerais (Cerrado-Caatinga transition zone) had the highest cumulative species richness (112 species), followed by Serra do Cipó (Cerrado, 76 species), and Paraíba (Caatinga, 40 species). North of Minas Gerais contained 61 exclusive species (i.e. only found in that area), Serra do Cipó contained 40 exclusive species, and Paraíba contained 12 exclusive species. Eight species were common to all three regions: Brachymyrmex sp.4, Camponotus melanoticus (Emery 1894), Camponotus crassus (Mayr 1862), Cephalotes pusillus (Klug 1824), Odontomachus bauri (Emery 1892), Pheidole gr. Diligens sp., Pheidole sp.10 and Pseudomyrmex gracilis (Fabricius 1804).
TDF cumulative species curves tended to stabilize (figure 2). According to the Jackknife 1 estimator, TDF sampling sufficiency was 87.48% in Serra do Cipó (observed richness: 76; estimated richness: 86.88), 73.81% in North of Minas Gerais transition (observed richness: 112; estimated richness: 151.73), and 80.11% in Paraíba (observed richness: 40; estimated richness: 49.43). Finally, the composition of ant species differs among the vegetation domains (figure 3, PERMANOVA: Pseudo-F = 9.12; R2 = 0.34, p < 0.001).
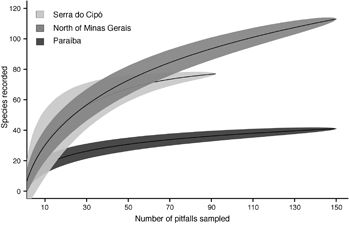
Figure 2 Sample-based species accumulation curves of the total number of ant species collected in TDFs within Serra do Cipó (Cerrado), North of Minas Gerais (Caatinga-Cerrado transition), and Paraiba (Caatinga) regions.
Download figure:
Standard image High-resolution image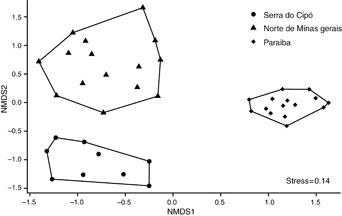
Figure 3 Composition of ant species of three TDFs within Serra do Cipó (Cerrado), North of Minas Gerais (Caatinga-Cerrado transition), and Paraiba (Caatinga) regions. Ordinations were plotted with non-metric multidimensional scaling (NMDS) based on the Jaccard distance of the data (PERMANOVA, p < 0.001).
Download figure:
Standard image High-resolution image3.1. Influence of ecological processes
TDFs among vegetation domains have significantly different plot α and β-diversities (figure 4). Average ant richness per plot was lower in Paraíba TDFs (Deviance = 37.60, df = 36, p < 0.001; figure 4(a)). β-diversity was highest in Serra do Cipó plots followed by the North of Minas Gerais, and lowest in Paraíba (Deviance = 6.54, df = 36, p < 0.001; figure 4(b)). Ant species richness and β-diversity did not have any relationship with tree richness, as well as we found no effects with tree richness, tree density or interactions between tree richness and density and region (Deviance = −2.66, df = 35, p = 0.20 for α-diversity and F3,35 = 0.11, p = 0.97 for β-diversity).
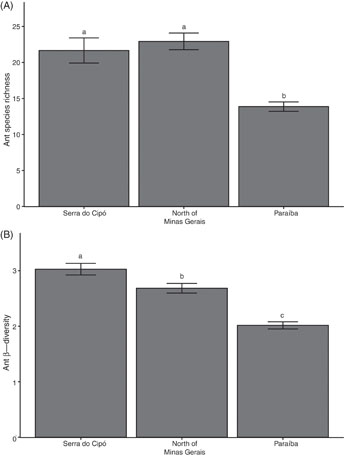
Figure 4 Ant species richness (α) and β-diversity (A, B respectively) of ants sampled in TDFs within three vegetation domains (Cerrado, Caatinga-Cerrado transition and Caatinga biomes). Different letters above bars indicate p < 0.05 (Mean ± SE).
Download figure:
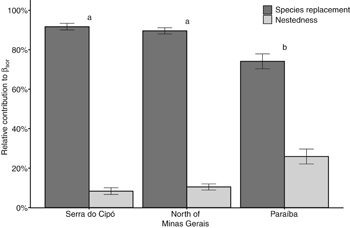
Standard image High-resolution imageSpecies replacement is numerically the primary mechanism that determines the β-diversity among plots in the same region (figure 5). Nonetheless, the average proportional contribution of species replacement within each plot (βSIM) was highest in the Serra do Cipó (91.67%) and in the North of Minas Gerais (89.56%) regions, and lowest in Paraíba (74.11%, p < 0.01; figure 5).
Figure 5 Partition of total ant β-diversity (βSØR) into its components, species replacement (βSIM) and nestedness (βSNE), in TDFs within the three vegetation domains Cerrado, Cerrado-Caatinga transition, and Caatinga, located in central and northern Minas Gerais State, and Paraiba, Brasil, respectively. In the figure, we show values of species replacement and its complementary nestedness component (ther sum accounts for 100% of βSØR).
Download figure:
Standard image High-resolution image
4. Discussion
Ant community structure differed among the study vegetation domains. We provide evidence that these differences may be related to historical and climatic processes at a regional scale and we also discuss the absence of environmental heterogeneity effects. Tropical dry forests in Paraíba, within Caatinga, had the lowest cumulative species richness per plot. Among the processes contributing to these differences in ant species composition and diversity, we can highlight environmental severity (Yang et al 2015) geographic distances among forests and the biological context in which each forest is inserted (Apgaua et al 2014, Neves et al 2015, Banda-R et al 2016).
Tropical dry forests within Caatinga in Paraíba are subject to low annual rainfall, as well as dramatic variation from year to year (see table 1), and at intervals of 10–20 years, a phenomenon known as 'green drought' where annual rainfall is below the historical average (see Velloso et al 2002). This unpredictability of weather conditions in the Caatinga coupled with very low annual rainfall might have negatively influenced the ant diversity in this region. Thus, the abiotic environmental filter in Caatinga should limit species richness, in areas with high environmental severity, mainly due to the lower numbers of species in the regional pool that can cope with stressful conditions (see Yang et al 2015). Differently, tropical dry forests located in the North of Minas Gerais are in a major transitional region between Cerrado and Caatinga tropical dry forests domains (Banda-R et al 2016) as well as the TDFs in Serra do Cipó, which are located within Cerrado. These vegetation domains present lower environmental severity than Caatinga and are also under the influence of species from other vegetation types (e.g. high-altitude grasslands and Atlantic forest).
Table 1. Description of the structural vegetation characteristics (Mean ± SD), altitude, annual precipitation (Mean ± SD and min/max) and geographic coordinates of the TDFs inserted in vegetation domains Cerrado, Transição Cerrado-Caatinga and Caatinga.
| Vegetation domain | Tree richness (number of individuals) | Tree density (individual/ha) | Elevation (m) | Annual precipitation (mm) |
Coordinates | Sampling sites |
|---|---|---|---|---|---|---|
| Cerrado | 24.33 ± 5.02 | 1084.44 ± 215.24 | 964 | 1439.9 ± 278.3 min 954, max 1924 | 19°16'S, 43°37'W | Serra do Cipó |
| Cerrado-Caatinga | 23.47 ± 2.41 | 1226 ± 157.31 | 505 | 982.5 ± 229.7 min 558, max 1296 | 15°16'S, 43°55'W | North of Minas Gerais |
| Caatinga | 9.07 ± 1.07 | 1058.67 ± 119.72 | 270 | 726.1 ± 331.6 min 24, max 1116 | 07°01'S, 37°24'W | Paraíba |
aBase data corresponds to the period between 2000 and 2012. Source: INMET—BDMEP (www.inmet.gov.br).
The evolutionary history of TDFs is marked by episodes of expansion and contraction, and disjunct distribution for long periods (Collevatti et al 2013), exposing TDFs to the influence of distinct vegetational formations over its history (Pennington et al 2009). The unique species composition in TDFs inserted within different vegetation domains was firstly observed by Marques and Schoereder (2014), who showned that more than 65% of variation in ant species composition across TDFs is due to species replacement among vegetation domains, attributing this variation to historical contingency. We argue that the historical component is indeed important, however it must be coupled with the influence of recent ecological conditions inherent from the surrounding vegetation domains, such nesting site availability and colony establishment (e.g. Guimarães et al 2007, Andersen 2008), as well as species interactions outcomes (Cerdá et al 2013, Camarota et al 2016), which are likely to be responsible for the compositional uniqueness we observed in the ant community among vegetation domains.
While we found that species richness, β-diversity and species composition are tightly dependent on the identity of the vegetation domains in which each TDF was inserted, we did not find any relationship between these variables and tree richness or tree density. In a recent comprehensive meta-analysis, Stein et al (2014) found that environmental heterogeneity is a universal driver of species richness across taxa, biomes, and spatial scales. However, the shape of the relationships between environmental heterogeneity and biodiversity depends on environmental severity, with positive effects at either ends of the gradient (Yang et al 2015). Hence, we found that regional context appears to overcome these local effects either by historical contingency (Marques and Schoereder 2014, Banda-R et al 2016) or by embracing multiple local factors that could drive species diversity (Sanders et al 2007).
Species replacement is the component that most contributed to β-diversity in all vegetation domains, and was more important in Cerrado and transition TDFs than in Caatinga TDFs. Areas with greater tree richness also had higher species replacement. Despite the overall high contribution to β-diversity, replacement was lowest in Caatinga. This suggests that environments with lower species richness and less predictable weather conditions favor fewer wildlife species and hence, have increased contribution of nestedness to β-diversity processes in ant communities (Dobrovolski et al 2012, Solar et al 2015).
In general, species composition provides a much more sensitive community metric than species richness for ants (Solar et al 2016). We can offer partial support for this statement with our results. While at the plot scale richness is only different in Caatinga, rarefaction curves show a marked difference in species richness between sites. Regarding species composition, we found that TDFs within each region markedly differ in ant species composition; only eight species were shared among all three vegetation domains. Phytosociological studies in these regions show that floristic composition also differs between TDFs (Banda-R et al 2016). Species composition was more similar between Serra do Cipó and North of Minas Gerais than Paraíba. Despite we have not tested for the specific reasons that could be leading to this pattern, the current disjunct distribution of TDFs, distinct vegetation domains, and regional species pools may explain the lack of shared species (Tscharntke et al 2012, Apgaua et al 2014, Banda-R et al 2016). Since Paraíba is the more distant site in our sampling, this could be responsible for the largest differences observed. An alternative explanation could also be that, by presenting lower species richness, this region has lower probability of sharing species with the other regions, increasing dissimilarity.
The unique species composition of TDFs in each vegetation domain is responsible for much of the overall ant diversity (54% in Cerrado-Caatinga transition zone, 53% Cerrado zone and 30% in Caatinga), which makes exclusive species the rule and shared species the exception in this scenario. Interestingly, the few shared species among all TDFs are broadly-ranged, generalist species that can use different types of resources, prey or habitats. Specifically, Camponotus crassus and Cephalotes pusillus are species that use different types of resources in plants such as extrafloral nectaries, trophobiont insects, flowers and fruits (Costa et al 2016). Odontomachus bauri is a generalist epigaeic predator that feeds on leaf litter invertebrates of varying sizes, with preference for arthropods with a similar body size to its own (Brandão et al 2012). Pseudomyrmex gracilis exhibits strong phenotypic plasticity and is found in a variety of vegetation types, with wide distribution in the Americas (i.e. from Uruguay and Argentina to the United States, Wetterer 2010). In addition to TDFs, these species are found in distant fragments within different vegetation domains that have historically been degraded by human activity, which may favor the presence of generalist species (Montine et al 2014). Therefore, while most of the species present in TDFs located in different vegetation domains, the shared species are widespread and of very low conservation value and reinforce that TDFs are compositionally complementary across their ranges.
Conservation of tropical dry forests should be prioritized since these areas are under threats (Pennington et al 2009, Quesada et al 2009, Portillo-Quintero and Sánchez-Azofeifa 2010). The annual rates of deforestation are the highest among tropical forests (0.96% of the remaining area each year, Whitmore 1997). On a global scale, almost 50% of the TDFs have been converted to other land-uses (Hoekstra et al 2005) and, in Latin America, these rates are as high as 66% (Portillo-Quintero and Sánchez-Azofeifa 2010). Importantly, these rates regard deforestation alone, and do not consider the dire consequences of forest disturbance (e.g. fire and logging, Barlow et al 2016). Given the unique compositional characteristics of TDFs embedded in different vegetation domains, we suggest creating landscape-wise strategies for the development and conservation of areas of TDFs across their entire geographic range, also considering the degree of protection of patches of natural vegetation within different ecoregions.
5. Conclusion
This work demonstrates that TDFs fragments in different vegetation domains significantly differ in ant species composition, accumulated species richness, and α- and β-diversities. Specifically, we found that composition is more markedly different and that α- and β-diversities are lower in vegetation domains that present high environmental severity (e.g. Caatinga). Furthermore, species replacement contributed more than nestedness to β-diversity among TDFs. Thus, the high levels of species replacement and unique species composition of each region indicates that, to fully conserve TDF species diversity, we need to prioritize various conservation areas distributed across the entire range of vegetation domains in which these forests can be found. Taken together, these results provide insights into conservation strategies in Tropical Dry Forests sites.
Acknowledgments
The authors wish to thank L N Perillo, F S Castro, F T Pacelle, L Martins and A M Vieira for their help in the data sampling; Vincenzo A Ellis that kindly revised English grammar and spelling and anonymous referees that provided invaluable suggestions to improve the manuscript. We are indebted to J Delabie, R Feitosa, T S R Silva, R Probst, M Ulysséa for confirming species identifications. We gratefully acknowledge the staff of the Instituto Estadual de Florestas (IEF-MG), ICMBIO and Fazenda Tamanduá for fieldwork and logistical support. We are thankful for the financial support provided by Fundação de Amparo à Pesquisa de Minas Gerais (FAPEMIG), Coordenação de Apoio ao Pessoal de Nível Superior (CAPES) and Conselho Nacional de Desenvolvimento Científico e Tecnológico (CNPq). This study was in partial fulfillment of requirements for the Master degree of L Figueiredo at Universidade Estadual de Montes Claros.