

Abstract
In September 2015, the Volkswagen Group (VW) admitted the use of 'defeat devices' designed to lower emissions measured during VW vehicle testing for regulatory purposes. Globally, 11 million cars sold between 2008 and 2015 are affected, including about 2.6 million in Germany. On-road emissions tests have yielded mean on-road NOx emissions for these cars of 0.85 g km−1, over four times the applicable European limit of 0.18 g km−1. This study estimates the human health impacts and costs associated with excess emissions from VW cars driven in Germany. A distribution of on-road emissions factors is derived from existing measurements and combined with sales data and a vehicle fleet model to estimate total excess NOx emissions. These emissions are distributed on a 25 by 28 km grid covering Europe, using the German Federal Environmental Protection Agency's (UBA) estimate of the spatial distribution of NOx emissions from passenger cars in Germany. We use the GEOS-Chem chemistry-transport model to predict the corresponding increase in population exposure to fine particulate matter and ozone in the European Union, Switzerland, and Norway, and a set of concentration-response functions to estimate mortality outcomes in terms of early deaths and of life-years lost. Integrated over the sales period (2008–2015), we estimate median mortality impacts from VW excess emissions in Germany to be 1200 premature deaths in Europe, corresponding to 13 000 life-years lost and 1.9 billion EUR in costs associated with life-years lost. Approximately 60% of mortality costs occur outside Germany. For the current fleet, we estimate that if on-road emissions for all affected VW vehicles in Germany are reduced to the applicable European emission standard by the end of 2017, this would avert 29 000 life-years lost and 4.1 billion 2015 EUR in health costs (median estimates) relative to a counterfactual case with no recall.
Export citation and abstract BibTeX RIS

Original content from this work may be used under the terms of the Creative Commons Attribution 3.0 licence.
Any further distribution of this work must maintain attribution to the author(s) and the title of the work, journal citation and DOI.
1. Introduction
Public health is significantly and globally affected by outdoor air pollution (WHO 2006), with the European Environment Agency (EEA) estimating that outdoor air pollution is responsible for more than 400 000 premature deaths annually in Europe (EEA 2015b). These impacts are driven primarily by population exposure to fine particulate matter with an aerodynamic diameter of 2.5 μm or less (PM2.5) and, to a lesser extent, ozone, both of which have been associated with an increased risk of premature mortality by epidemiological studies (see the review study by Hoek et al 2013 and the multi-city analysis in WHO 2013b). Road transportation emissions account for approximately 50% of the total health impacts from ambient air pollution in Europe (OECD 2014).
Vehicle emissions standards initially introduced in 1991 (the so called Euro standards) aimed to reduce the air quality impacts of road transportation (European Commission 1991). However, observed reductions in ambient pollution have not been as significant as expected, and the EEA noted that 'emissions in real-life driving conditions are often higher, especially for diesel vehicles, than those measured during the approval test' (EEA 2015b). A partial explanation for this discrepancy came to light in September 2015 when an investigation by Thompson et al (2014) quantified excess emissions from Volkswagen group vehicles, ultimately leading to allegations by the US Environmental Protection Agency (EPA) and admission by VW that certain vehicle models had engines equipped with software designed to reduce emissions during approval testing significantly below levels achieved under actual on-road operation (US EPA 2015).
Consequently, in October 2015 the German Federal Motor Transport Authority (KBA) ordered a mandatory recall of all 2.4 million affected passenger vehicles still in service and stated that they must be modified to comply with European regulations (KBA 2015). Following the KBA order, VW announced that the recall would begin in 2016 with completion originally scheduled for the end of the same year (VW 2015). The first vehicles were recalled at the end of January 2016 (VW 2016). For all three engine sizes affected (1.2 liter, 1.6 liter and 2.0 liter), Volkswagen will update the EA 189 engine software to ensure that on-road emissions stay below the permitted limit. In addition, for the 1.6 liter engine, VW will fit a flow rectifier to the intake duct.
In this study, we estimate excess NOx emissions from affected cars commercialized by the brands of the Volkswagen Group that used the EA 189 1.2, 1.6 and 2.0 liter engines (Audi, Seat, Skoda, Volkswagen) within Germany, calculating health impacts and health costs throughout Europe which have already occurred between 2008 and 2015, in addition to future outcomes under different recall scenarios. We seek to estimate the number of early deaths as well as the total number of life-years lost which are at risk of resulting from excess emissions. Morbidity impacts are not evaluated or estimated.
2. Methods
Excess emissions in this paper are defined as the difference between vehicle on-road NOx emissions and the limit value set by the applicable European Emissions Standard, Euro 5. Even though European Union regulations only require vehicles to meet this standard during the type approval test conducted in the laboratory using the New European Driving Cycle, the intent of the regulation is to limit on-road emissions and achieve real-world air quality improvements (European Commission 2007). In the absence of an official factor to account for the difference between laboratory and on-road testing, we use the regulatory limit as the point of reference for our calculations of excess emissions.
For effects occurring in the future, we first estimate impacts assuming all affected VW vehicles in Germany are modified to bring on-road emissions down to Euro 5 standards by the end of 2016, with a fleet recall occurring at a fixed rate over the course of 2016. We then calculate effects for the counterfactual case that affected vehicles remain in the fleet until their retirement without on-road emissions being reduced to Euro 5 levels. The difference between the counterfactual and recall cases yields the benefits of the recall in terms of avoided excess emissions, health impacts and health costs. The paper also quantifies the impact for a case where the recall is performed at a slower rate and completed by the end of 2017 with the same start date. It should be noted here that future health impacts under one of the 'recall' scenarios correspond to a reduction of on-road emissions to the Euro 5 limit value. While the absolute decrease in NOx emissions which would result from a recall is difficult to estimate, any recall, if carried out, would reduce the average NOx emissions rate from the current estimated value of ∽0.85 g km−1 to some lower value. We take the regulatory limit (0.18 g km−1) as a reasonable minimum value. It is possible to calculate the benefits of smaller reductions as a linear combination of the 'no policy' scenario and the 'recall' scenario. As detailed later in this study, the atmospheric response to excess emissions is essentially linear for the range of perturbations considered.
We augment and extend the modelling capabilities used in Barrett et al (2015) to estimate the impact of excess VW NOx emissions in the US. They used an adjoint-sensitivity-based air quality modeling approach to capture the impacts of spatially disaggregate excess NOx emissions on aggregate PM2.5 and ozone population exposure in the US. Due to nonlinearity associated with differences in population density and distribution, background atmospheric composition and local meteorology, linear scaling of the results calculated by Barrett et al for the US will not necessarily yield an accurate or reliable answer for other countries. In this study we therefore use a chemistry-transport model to capture the impacts of spatially disaggregate excess NOx emissions in Germany on spatially disaggregate PM2.5 and ozone population exposure in Germany and other European countries. The calculated increase in population exposure due to these excess emissions is then converted into policy-relevant metrics of health impacts and costs.
The air quality and health impacts of the VW excess emissions in Germany are computed using spatially-resolved excess NOx emissions estimates. Unless otherwise specified, NOx emissions are reported on an NO2 mass basis, consistent with the standards used in emissions inventories. Excess emissions are estimated from on-road measurements of the affected models, as well as the number of affected cars, and the vehicle kilometers traveled. Their spatial distribution is inferred from the distribution of overall NOx emissions from passenger cars in Germany, obtained from the German Environmental Protection Agency (UBA 2016). A regional chemistry-transport model is used to relate emissions to pollutant concentrations. Concentration-response functions are applied to convert the resultant population exposure to PM2.5 and ozone into health impacts. Given the significant uncertainties in estimating health impacts of air pollution and the associated costs, we use a probabilistic framework which propagates uncertainty through all aspects of the calculation. Public health outcomes are monetized using both the Value of Statistical Life (VSL) and Value of Life Year (VOLY) approach. In this section we describe the uncertainty estimation approach, the excess emissions calculation, the population exposure estimation, health impacts estimation and the monetary valuation of the impacts.
2.1. Uncertainty quantification
Uncertainty in input variables such as vehicle activity and emissions factors (mass of NOx emitted per kilometer driven) is propagated through the analysis by performing a Monte Carlo simulation. For each sample, a random draw is taken for each of the parameters listed in table 1, according to the distributions shown. The total excess emissions from German light-duty VW vehicles is calculated for each sample based on the randomly drawn emissions factor and on the vehicle-kilometers traveled (VKT) growth factor. These two variables and their distributions are discussed in section 2.3. Total population exposure to PM2.5 and ozone is then calculated by interpolating results from the chemistry-transport model GEOS-Chem, described in section 2.4. This includes compensation for bias in the modeled response gradient for both ozone and PM2.5, each drawn as a random variable.
Table 1. Uncertain parameters used in this study when calculating premature mortalities. Uncertainty in monetization is calculated separately.
| Parameter | Central value [95% CI] | Distribution type |
|---|---|---|
| Emissions index (g NOx/L) | 16 [5.0, 28] | Truncated normal (bounds: 3.7, 29) |
| VKT growth rate (2008–2020) | 0.005 [0.003, 0.007] | Triangular |
| VKT growth rate (2020–2040) | 0.003 [0.001, 0.004] | Triangular |
| PM2.5 response bias | +11% [−15%, +91%] | Uniform |
| Ozone response bias | −0.050% [−18%, +35%] | Uniform |
| PM2.5 CRF (risk per 10 μg m−3) | 1.11 [1.05, 1.16] | Triangular |
| Ozone CRF (risk per 10 ppbv) | 1.040 [1.013, 1.067] | Triangular |
The health impacts of variations in exposure to PM2.5 and ozone are calculated by applying concentration response functions (CRFs), as described in section 2.5. For each CRF, the rate of increase in relative risk per unit of exposure is again drawn as a random variable for each sample. The total mortality resulting from the excess emissions for that sample is calculated by summing the premature mortalities calculated for PM2.5 and ozone, assuming independent effects. We perform one thousand independent draws of each variable to yield one thousand independent estimates of the number of premature mortalities and Years of Life Lost (YLL). The rationale for the choice of sample size is presented in the supplementary material (stacks.iop.org/ERL/12/034014/mmedia). The input variables and their distributions are discussed in the following sections and summarized in table 1. In monetizing health impacts, we perform ten additional draws of a distribution of the economic value of statistical life (VSL) and ten draws of a distribution of the Value of Life Year (VOLY), discussed in section 2.6.
Unless explicitly stated otherwise, we report the median value of the output distribution. Data sources and the uncertainties associated with the different parts of our study are detailed in the following subsections.
2.2. Affected vehicle fleet and geographic distribution
An inventory of affected vehicle models in Germany is constructed from publically available sources (Auto, Motor und Sport 2016, ADAC Online Autodatenbank 2016). It comprises cars marketed by the brands of the Volkswagen Group that used the EA 189 engine in its 1.2, 1.6, and 2.0 liter versions (Audi, Seat, Skoda, Volkswagen). We compute the number of affected cars for each relevant model that entered into service each year using annual new registration data published by the German Federal Motor Transport Authority (KBA). In order to obtain estimates for vehicle-kilometers traveled (VKT) by all affected vehicles in each year, the registration data are used as inputs to the Stochastic Transport Emissions Policy (STEP) light-duty vehicle fleet model, developed by Bastani et al (2012). We further calibrate the model using Germany-specific data gathered by the TRACCS project (Papadimitriou et al 2013). A logistic function is used to estimate the vehicle retirement rate.
The total activity of the affected vehicles is expressed in vehicles-kilometers traveled (VKT) per year. The growth rate of this quantity over time is treated as a random variable and drawn from two triangular distributions, one applicable to the years prior to 2020 and one to the years between 2020 and 2040. The total activity for each year and each sample is estimated for each 25 km by 28 km grid cell within Germany using a spatially resolved emissions dataset of NOx emissions from passenger cars, as reported by the German Environmental Protection Agency (UBA 2016).
2.3. Emissions factors for affected vehicles
The estimation of NOx emissions factors (mass of NOx emitted per kilometer driven) for the affected vehicles relies on two sets of on-road measurements. The first set of measurements is from KBA (BMVI 2016) using the Real-world Driving Emissions test cycle, as announced by the European Commission's Technical Committee of Motor Vehicles (European Commission 2015). NOx emission estimates are available for four vehicle models (VW Beetle 2.0L EA 189 Euro 5, VW Golf Plus 1.6L EA 189 Euro 5, VW Passat 2.0L EA 189 Euro 5 and VW Polo 1.2L EA 189 Euro 5). KBA published one measurement per model, yielding four on-road results.
The second set of measurements is from Thompson et al (2014), who tested two vehicles a 2012 Jetta (Vehicle A) and a 2013 Passat (Vehicle B)- on several drive cycles characteristic of different types of driving (urban, rural, highway). Each cycle was driven one or two times for each vehicle, yielding a total of 17 samples.
We combined the results from both sources into a single distribution, composed of 21 samples. Each measured emissions factor expressed in grams of NOx per kilometer is normalized by the fuel economy of the tested car (in liters of fuel per 100 kilometers). A truncated normal distribution of these factors is used to perform the draws for the Monte Carlo simulation method. The lower bound of the truncation corresponds to the Euro 5 limit of 0.18 g km−1 for the average fuel economy of the fleet of affected vehicles. We obtain the emissions factor of each affected model by multiplying its fuel economy (in L/100 km) by the drawn value in 100 g L−1, yielding a value in g km−1, from which we compute the excess emissions factor. This approach assumes that the emissions factors scale linearly with fuel economy, and that the cars that were tested on-road constitute a representative sample of the fleet of affected vehicles. The excess emissions factor for each vehicle is multiplied by the corresponding VKT sample for this vehicle for a given year, and the sum over all vehicles yields the total amount of excess NOx emitted each year.
Although VW have published technical details regarding the modifications to be made to each vehicle as part of the recall, at the time of publication there is no reliable data regarding the effect that these modifications have on the NOx emissions of the affected vehicles. As such, we assume that a recalled vehicle's emissions are brought down to the Euro 5 standard of 0.18 g NOx/km driven.
2.4. Air quality modeling
The GEOS-Chem chemistry-transport model, originally developed by Bey et al (2001) and since continuously developed and updated, is used to calculate the PM2.5 and ozone concentrations. The model domain encompasses most of Europe, covering 15° W – 40° E and 33° N – 61° N. The resolution is 0.25° in latitude and 0.3125° in longitude (approximately 25 km × 28 km). This resolution corresponds to 759 grid cells over Germany.
The GEOS-Chem model has been extensively used at comparable resolutions to capture PM2.5 and ozone impacts at the ground level. Numerous studies have evaluated predicted PM2.5 concentrations against observations in the US (Duncan Fairlie et al 2007, Heald et al 2012, Henze et al 2009, Leibensperger et al 2012, Zhang et al 2012), and in Asia (Brauer et al 2012, 2015, Jiang et al 2015, Kharol et al 2013, van Donkelaar et al 2010, 2015). Barrett et al (2015) used the model over the US domain to predict PM2.5 and ozone concentrations. Protonotariou et al (2012) used the model over the European domain and evaluated the predicted ozone concentrations in Greece.
We use meteorological data from GEOS-FP, provided by the Global Modeling and Assimilation Office (GMAO) at NASA's Goddard Space Flight Center. Boundary conditions for this nested domain are obtained from a global GEOS-Chem run at 4° × 5° resolution, using the same meteorological source. We use the 2013 GEOS-FP data for all simulations. 2013 was a climatologically average year in Europe, with the average temperature 0.08 °C warmer than the 1995–2015 mean, and 0.16 °C below the mean of the period of interest 2008–2015 (NOAA 2016). We use the EMEP anthropogenic emissions inventory for 2012 and note that emissions reductions between 2012 and 2013 associated with other anthropogenic sources are less than 3% (EMEP 2016). Each simulation is run for a 15-month period with the first 3 months used as model spin up, during which the model is run but the output is not included in the analysis, to ensure that initial conditions do not impact the results.
A model simulation using baseline anthropogenic emissions (excluding excess emissions associated with the VW defeat device) is performed to assess the accuracy of the model in calculating PM2.5 and ozone concentrations. Two scenario runs are then performed where a total of 72 and 130 kilotonnes (106 kg) excess NOx emissions are added to the baseline anthropogenic emissions using the spatial distribution described in section 2.3. Excess NOx emissions are input in the air quality model as NO. This is consistent with the fact that NO accounts for more than 80% of NOx emissions from diesel vehicles (Carslaw and Beevers 2005, Yao et al 2005), and that the NOx steady-state in the atmosphere is expected to be reached quickly with respect to the timescale of this study (3 to 30 minutes for NO concentrations of 10 to 1 ppb, following Seinfeld and Pandis 2006). The uncertainty associated with this hypothesis is further discussed in section 4. Differences in the PM2.5 and ozone concentrations between the baseline and scenario simulations are attributed to the computed excess VW emissions. Given that the highest estimate for excess VW NOx emissions is less than 0.8% of the background anthropogenic NOx emissions in Germany, we use a linear approach in estimating the PM2.5 and ozone impacts of intermediate amounts of excess emissions. One additional scenario run with 520 kilotonnes of annual excess NOx emissions was conducted in order to verify the validity of this linear approach. This is further discussed in the supplementary material.
Simulated PM2.5 and ozone model output concentrations over Germany are validated against observations from the European Environment Agency Air Quality e-Reporting dataset for Germany (EEA 2015a), as well as the entire European domain. Similar to Caiazzo et al (2013), the model normalized mean biases are used to account for the uncertainty in predicting PM2.5 and ozone concentrations. They are obtained from the point-to-point comparison between available measurements and the model predictions. The resulting distributions have means of 0.11 and −5.0 × 10⁻⁴ (95% CI: −0.15 to 0.91 and −0.18 to 0.35) for PM2.5 and ozone, respectively. This implies that the model typically overpredicts concentrations of PM2.5 by 11%, and underpredicts ozone by 0.050%. The reciprocals of the biases are used as multiplicative factors to correct the GEOS-Chem model predictions in the uncertainty calculations. Only the results from the comparison with the observations in Germany are used in the uncertainty calculations.
2.5. Health impacts
Population exposure to both annual PM2.5 and one-hour daily maximum ozone concentrations attributable to excess NOx emissions from Volkswagen cars within Germany are calculated using the outputs of the GEOS-Chem air quality model described in section 2.4. The annual average PM2.5 concentrations are obtained from the hourly output of GEOS-Chem for the species that constitute PM2.5 (the GEOS-Chem tracers NH4, NIT, SO4, BPCI, BPCO, OCPI, and OCPO). One-hour daily maximum ozone concentrations during ozone season are obtained from the hourly output for the tracer O3. Population exposure is calculated by multiplying population counts in each grid cell by the annual-average PM2.5 or one-hour daily maximum ozone concentration within that grid cell. The spatial distribution of population in Europe is taken from the LandScan database for 2013 (Bright et al 2014), which is aggregated from a 1 km resolution to the model grid cells. Country-specific population counts are obtained from the UN World Population Prospects Division for each year of the study (UN 2015) and are used to scale the population density distribution. We take into account the current (2016) member states of the European Union and, due to their geographic proximity, Switzerland and Norway. We use the term 'Europe' to refer to these states and note that the United Kingdom is still included in future year analyses irrespective of the date the state leaves the EU.
Epidemiological concentration-response functions (CRFs) are applied to estimate premature mortality resulting from population exposure to each species. Cardiovascular premature mortality from long-term exposure to PM2.5 is calculated using a log-linear CRF, with a relative risk distribution taken from Hoek et al (2013). They find a central relative risk for cardiovascular disease mortality of 1.11 (95% CI: 1.05–1.16) per 10 μg m−3 increase in PM2.5 exposure. Premature mortality due to exacerbation of both asthma and chronic obstructive pulmonary disease (COPD) as a result of exposure to ozone is also calculated using a log-linear CRF, this time applying the relative risk distribution from an American Cancer Society study (Jerrett et al 2009). This CRF has been widely used by previous studies to assess air quality impacts (Barrett et al 2015, Jhun et al 2015). Jerrett et al find a central relative risk of 1.04 (95% CI: 1.013–1.067) per 10 ppb increase in one-hour daily maximum ozone exposure during local ozone season. Country-specific baseline mortality rates for each disease are taken from the World Health Organization global burden of disease database (WHO 2014) and are assumed to remain constant over time. We estimate premature mortality for adults aged 30 and older given that the epidemiological studies are based on a cohort of participants aged 30 years or greater (Jerrett et al 2009, Krewski et al 2009). The age fraction for each country and each year is taken from UN population forecasts (UN 2015). Alternative PM2.5 CRF shapes and parameters, including the integrated exposure-response (IER) function applied in the 2010 Global Burden of Disease study (Burnett et al 2014, Lim et al 2012), a log-linear CRF from an American Cancer Society study (Krewski et al 2009) and an all-cause log-linear CRF reported in Hoek et al (2013), are evaluated to determine the sensitivity of the result to the choice of CRF. We also implemented a log-linear ozone CRF derived from the findings of Turner et al (2015) that link changes in exposure to the annual average of the daily maximum 8-hour average ozone concentrations to changes in mortality from respiratory and circulatory diseases. These results are presented in the supplementary material. In all cases, a cessation lag structure is applied where 30% of the mortalities due to exposure in a given year occur in the first year, 50% occur equally in years 2 through 5, and the remaining 20% occur equally over years 6 through 20, based on US EPA (2004) recommendations.
The relative risk factors for each of the CRFs are treated as independent, uncertain variables. We assume a triangular distribution with mode and 95% confidence interval taken from the corresponding epidemiological study.
We also compute the number of life-years lost for each estimated number of premature mortalities. The number of life-years lost is the product of mortalities in each age group (for adults over 30) with the age group's corresponding standard life expectancy, obtained from UN population forecasts for the appropriate year (UN 2015).
2.6. Monetization of health impacts
Mortality effects are valued using two monetization methods that have been widely used in the literature and by government agencies. A detailed overview is given by OECD (2012). The first method relies on estimates for the monetary value of changes in mortality risk due to PM2.5 and ozone exposure, calculated as the Value of a Statistical Life (VSL). The second uses estimates for the Value Of a Life Year lost (VOLY) due to exposure to PM2.5 and ozone. VSL and VOLY estimates are not additive but describe two different approaches for placing a monetary value on the health impacts of air pollution.
A distribution of VSL estimates for Europe is only available in year 2010 USD (OECD 2012), therefore this distribution is converted to 2015 EUR by accounting for the USD/EUR purchasing power parity, changes in economic growth and inflation. The supplementary material contains detailed information on the conversion. We estimate a lower-bound VSL for 2015 of 1.82 million EUR and a higher bound of 5.48 million EUR, to which we fit a triangular distribution with an adjusted OECD base value of 3.65 million EUR as mode. For other years, we adjust VSL distributions for forecast changes in GDP per capita compared to 2015. The Supplementary Material shows the VSL distributions for all years considered in the analysis. Annual health costs from changes in premature mortality are calculated by multiplying the annual incidences of premature mortality due to excess NOx emissions with a year-specific VSL estimate, assuming the mortality lag structure recommended by the EPA for air-quality impacts (US EPA 2011).
For VOLY, we use a year-2015 mean value of 133 000 EUR per year of life lost, with a standard deviation of 16 000 EUR derived from recommendations by European agencies (EEA 2014, EC4MACS 2012). For other years, we adjust VOLY distributions for forecast changes in GDP per capita compared to 2015 in the same fashion as for the VSL. Annual health costs from life-years lost due to exposure to PM2.5 and ozone in each year and each sample are calculated by multiplying the number of life-years lost by a year-specific estimate for the VOLY drawn from a year-specific normal distribution. Monetization with the VOLY method is therefore sensitive to age, with early deaths in younger age groups resulting in greater estimated costs than if they occur in older age groups.
Total health costs from historical excess emissions during the years 2008 to 2015 are expressed in year-2015 EUR using a social rate of time preference of 3 percent (discount rate), as recommended by the EU ExternE methodology (Bickel and Friedrich 2005) and by the US EPA (US EPA 2014). Total health costs because of additional incidences of premature mortality or life-years lost occurring in future years are expressed in year-2015 EUR with the same social rate of time preference as for historical costs. We follow Bickel and Friedrich (2005) and also calculate results for lower and upper bounds of discount rates as sensitivity analyses (0% and 6%, respectively). These alternative discount scenarios are presented in the supplementary material.
3. Results
We report results for excess emissions, health impacts and health costs for historical excess emissions from the affected fleet as well as for future emissions from this fleet.
3.1. Excess emissions
Based on the drive cycle tests by KBA (BMVI 2016) and Thompson et al (2014), we estimate the overall NOx emissions indices for the affected vehicles to be 16 grams per liter fuel consumed. The associated 95% confidence interval (95% CI) is 5.0 to 28 g L−1. The central estimate is equivalent to 0.85 g km−1 for the given fleet distribution, compared to the Euro 5 standard of 0.18 g km−1. The total excess emissions for the affected fleet over time are shown in figure 1. The emissions factor is multiplied by the fuel economy of each model affected in order to obtain the mass of NOx emitted per kilometer driven.

Figure 1 Annual excess NOx emissions for the affected cars in kilotonnes. The results up to 2015 are estimates of the historical excess NOx emissions and the results from 2016 onward assume no sales of new vehicles from September 2015 on and no recall of affected vehicles. The blue curve represents the median value, and the shaded area the 95% confidence interval.
Download figure:
Standard image High-resolution imageThe total vehicle-kilometers traveled (VKT) by the affected vehicles between 2008 and 2015 is 354 billion km (95% CI: 349 to 360), corresponding to emissions of 240 kilotonnes of NOx (95% CI: 28 to 440) above the total emissions that would have occurred if on-road emissions of all affected vehicles were equivalent to the Euro 5 NOx limit of 0.18 g km−1. In the absence of a recall that brings on-road emissions down to Euro 5 limit values, future emissions from 2016 onward would be 560 kilotonnes of excess NOx emissions (95% CI: 67 to 1100), as a result of total expected future VKT for the affected vehicles from 2016 onward of 838 billion km (95% CI: 823 to 854). If, instead, on-road emissions from all affected vehicles are reduced to Euro 5 standards by the end of 2016, future excess NOx emissions would be reduced to 29 kilotonnes (95% CI: 3.4 to 54). If the recall takes longer and is not complete until the end of 2017, future excess NOx emissions increase to 59 kilotonnes (95% CI: 7.0 to 110).
Figure 2 represents the spatial distribution of the aggregated excess NOx emissions between 2008 and 2015. It is assumed to follow the same spatial pattern as passenger cars NOx emissions, as reported and gridded by UBA for the year 2010 (UBA 2016).

Figure 2 Spatial distribution of the aggregated excess NOx emissions over 8 years (2008 to 2015) in tonnes per km2 based on data provided by UBA (UBA 2016). This figure is at the resolution of the original UBA data, 0.1° × 0.1°. It shows the median value of the estimated aggregate excess emissions, namely 240 kilotonnes. Emission density peaks at 11.4 tonnes/km2. For comparison, the UBA inventory for the year 2010 only reports a total of 230 kilotonnes of NOx emitted from passenger cars, with a peak emission density of 11 tonnes/km2.
Download figure:
Standard image High-resolution image3.2. Exposure and health impacts
For each year within the scope of our analysis and each draw of the Monte Carlo simulation, the linearity assumption allows us to compute the increase in the concentrations of PM2.5 and ozone over Europe, as well as the corresponding increase in population exposure. Figures 3(a) and (b) below present an example of the variation of the concentration of PM2.5 and ozone respectively, corresponding to annual excess emissions of 48 kilotonnes of NOx, the approximate median value for 2013. Figures 3(c) and (d) show the corresponding population exposure to PM2.5 and ozone, respectively, and are obtained by multiplying the concentration of PM2.5 or ozone in each grid cell by the population count in the cell.
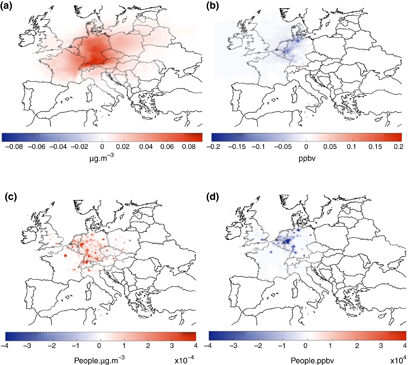
Figure 3 (a) and (b) Increase in concentration of PM2.5 (3a, left) and ozone (3b, right) resulting from the emission of 48 kilotonnes of NOx in a year. (c) and (d) Corresponding increase in population exposure expressed in people (over 30 years old) micrograms per cubic meter for PM2.5 (3c, left) and people (over 30 years old) particles per billion for ozone (3d, right).
Download figure:
Standard image High-resolution imageThe excess NOx emissions result in reduced ozone concentrations in almost all countries impacted by the excess emissions (with the exception of the region of the Alps between Switzerland and Austria). This is attributed to the high concentration of NOx relative to volatile organic compound (VOC) concentrations at these locations. Under these conditions, an increase in NOx emissions inhibits the production of ozone due to the removal of oxidants from the atmosphere via chemical reaction with NOx (Seinfeld and Pandis 2006). These atmospheric conditions are denoted as VOC-limited chemical regimes and have been established for Europe by previous studies (e.g. Beekman and Vautard 2010, Martin et al 2004). In other locations with higher VOC concentrations, it appears that long-range transported NOx from Germany dominates ozone production.
After applying the concentration response functions to the computed population exposures to PM2.5 and ozone, we are able to evaluate the number of premature mortalities that resulted from the estimated excess NOx emissions.
Table 2 summarizes the health impacts associated with excess emissions in Germany and in Europe. It features a retrospective analysis for the period 2008 to 2015 and three prospective scenarios, the first one without a recall of the affected cars, the second one with a recall completed by the end of 2016 and the third one with a recall completed by the end of 2017.
Table 2. Estimated historical and forecast impacts of excess NOx emissions. The median estimates are reported with 95% CI in parentheses. Results after 2016 assume no new sales of affected vehicles. Note that the sums of medians may not equal the median of sums. All values are rounded consistently with the order of magnitude of the standard deviation of the distribution considered.
| Germany | Europe (excluding Germany) | Europe | ||
|---|---|---|---|---|
| 2008 to 2015 estimated impacts | Exposure to PM2.5 |
14 (1.8; 27) | 17 (0.23; 35) | 31 (0.41; 62) |
| Exposure to ozone |
−11 (−13; −2.1) | −4.2 (8.1; −0.50) | −16 (−30; −1.8) | |
| Early deaths | 500 (54; 1200) | 660 (71; 1600) | 1200 (130; 2800) | |
| Number of life-years lost | 5600 (610; 14 000) | 7700 (830; 19 000) | 13 000 (1400; 32 000) | |
| Mortality costs (VSL) |
1.5 (0.17; 3.7) | 2.0 (0.23; 4.8) | 3.5 (0.40; 8.5) | |
| Mortality costs (VOLY) |
0.80 (0.088; 1.9) | 1.1 (0.12; 2.6) | 1.9 (0.21; 4.9) | |
| Forecast impacts from 2016 assuming no recall | Exposure to PM2.5 |
34 (4.4; 67) | 44 (0.57; 87) | 77 (10; 150) |
| Exposure to ozone |
−27 (−52; 3.2) | −11 (−21; −1.3) | −38 (−73; −4.5) | |
| Early deaths | 1200 (130; 3000) | 1600 (180; 4000) | 2900 (310; 7000) | |
| Number of life-years lost | 14 000 (1500; 34 000) | 19 000 (2100; 46 000) | 33 000 (3600; 80 000) | |
| Mortality costs (VSL) |
3.8 (0.44; 9.4.) | 5.1 (0.58; 12) | 8.9 (1.0; 22) | |
| Mortality costs (VOLY) |
2.0 (0.22; 4.8) | 2.7 (0.30; 6.6) | 4.6 (0.52; 11) | |
| Benefit of a recall completed by the end of 2016 | Exposure to PM2.5 |
32 (4.2; 63) | 41 (0.54; 82) | 74 (9.6; 150) |
| Exposure to ozone |
−26 (−49; −3.1) | −10 (−20; −1.2) | −36 (−69; −4.3) | |
| Early deaths | 1200 (130; 2800) | 1600 (170; 3800) | 2700 (300; 6600) | |
| Number of life-years lost | 13 000 (1400; 32 000) | 18 000 (2000; 44 000) | 31 000 (3400; 76 000) | |
| Mortality costs (VSL) |
3.6 (0.42; 8.8) | 4.8 (0.55; 12) | 8.4 (0.97; 21) | |
| Mortality costs (VOLY) |
1.9 (0.20; 4.5) | 2.5 (0.28; 6.2) | 4.4 (0.49; 11) | |
| Benefit of a recall completed by the end of 2017 | Exposure to PM2.5 |
30 (4.0; 60) | 39 (0.51; 78) | 69 (9.1; 140) |
| Exposure to ozone |
−25 (−47; −2.9) | −9.7 (−18; −1.2) | −34 (−65; −4.1) | |
| Early deaths | 1100 (120; 2700) | 1500 (160; 3600) | 2600 (280; 6200) | |
| Number of life-years lost | 12 000 (1400; 30 000) | 17 000 (1900; 42 000) | 29 000 (3200; 72 000) | |
| Mortality costs (VSL) |
3.4 (0.39; 8.3) | 4.5 (0.52; 11) | 7.9 (0.91; 19) | |
| Mortality costs (VOLY) |
1.7 (0.19; 4.2) | 2.4 (0.27; 5.8) | 4.1 (0.46; 10) |
aExposure is in million of people over 30 years old times µg/m−3 (or times ppbv for ozone). bMortality costs are expressed in billion 2015 EUR.
The benefits of a recall completed at a constant rate over the course of 2016 are obtained by comparing the scenario assuming that all affected cars are driven during their whole lifecycle without any modification to the scenario where all cars are brought down to the Euro 5 standard by the end of 2016. We also computed the benefit of a recall completed by the end of 2017. The mortality reductions from reduced ozone exposure amount to approximately 10% of the aggregate estimates shown in this table.
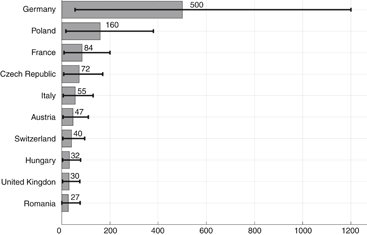
Figure 4 presents detailed estimates for the number of early deaths occurring in the ten countries that were most affected by excess emissions released between 2008 and 2015. The results for other European countries, as well as the distribution of the number of life-years lost per country, are presented in the Supplementary Material.
Figure 4 Number of premature mortalities due to excess NOx emissions released in Germany between 2008 and 2015 in the ten most affected countries. The numerical values correspond to the median estimate in each case. The solid bars represent the 95% confidence intervals.
Download figure:
Standard image High-resolution image
3.3. Health costs
Monetized health impacts of the excess NOx emissions are shown in table 2. Costs calculated using the VOLY method are approximately 50% lower on average than those calculated using the VSL, with an average estimate of 11 life-years lost per premature mortality. This difference is due to the prevalence of cardiovascular and respiratory disease in the older population, resulting in the majority of air-quality-related mortalities occurring in higher age brackets with lower life expectancies (in terms of life-years remaining).
Using the VOLY method, we find that past excess emissions have already caused median health costs of 1.9 billion EUR, and that median additional costs of 4.6 billion EUR are expected under a 'no recall' scenario. 95% of these costs are avoided if the recall is completed by the end of 2016; this is reduced to 90% if the recall is not completed until the end of 2017. The costs presented here do not take into account non-mortality impacts such as new cases of chronic bronchitis or increased hospital admissions, but these are expected to be small relative to costs associated with premature mortality (Barrett et al 2015).
Regardless of the valuation method used, we find that the majority of monetary damages are incurred outside of Germany, with approximately 60% of all mortality costs exported to other countries within the area of interest. This implies that there might also be significant health costs within Germany due to diesel cars operating outside of Germany which are not accounted for in this study.
4. Discussion and conclusion
We compare our results to an existing study by Oldenkamp et al (2016) which estimates Europe-wide health impacts of VW excess emissions using a simplified modeling approach. The authors calculate point estimates for health impacts from spatially unresolved, constant relationships between excess emissions and mortality impacts. Using this approach, the authors link estimated historical excess NOx emissions of 491.7 kilotonnes to 5000 early deaths, and estimated future emissions in the absence of vehicle modifications of 802.2 kilotonnes to an additional 8200 early deaths. We use a chemistry-transport model to estimate spatially resolved population exposure in each European country as a result of the additional NOx emissions in Germany. Using this approach yields an estimate for premature mortality per unit of excess emissions that is 50% lower than the value used in Oldenkamp et al (2016), i.e. 5.1 vs 10.2 early deaths per kilotonne of excess emissions.
In the case of the US, Barrett et al (2015) report median excess NOx emissions of 36.7 kilotonnes for 2008 from 2015 from 482 000 affected cars sold, leading to 59 additional early deaths at the median. Similarly, Oldenkamp et al (2016) found 33.8 kilotonnes of excess NOx over the same period, yielding 59 premature mortalities. Holland et al (2015), found 45.1 kilotonnes of NOx and 46.1 mortalities. In our study, we find that while the number of VW cars sold in Germany is 440% higher than the number sold in the US, excess emissions in Germany are 540% higher than in the US, which is a result of annual kilometer driven per vehicle in Germany being 19 percent higher than in the US. We us note however that our estimate is for the average diesel vehicle in Germany whereas Barrett et al (2015) compute the annual mileage of an average American vehicle.
Further comparing the results of these studies to our results, we find that each unit of NOx emitted in Europe results in 5 times as many premature mortalities (per capita) as in the US. This difference can be explained by the combination of Europe's greater population density and its more NOx-sensitive background conditions. A study by Koo et al (2013) found that in Europe, a combination of high ammonia emissions and relatively low sulfur emissions results in a higher sensitivity of population-weighted PM2.5 to NOx emissions than any other region in the world apart from Eastern China, where population densities are comparable to or greater than Europe. This aspect is discussed further in the Supplementary Material.
4.1. Limitations
Some sources of uncertainty in this study have not been quantified. The fleet model does not account for possible differences in distance traveled by vehicle model considered. Vehicle kilometers traveled for a given year are assumed to depend only on the year and the age of the vehicle. However, we note that the TRACCS report (Papadimitriou et al 2013) distinguished between four categories of diesel passenger cars (small, lower-medium, upper-medium, executive) and found no significant differences among these categories in terms of vehicle kilometers traveled, when controlling for year and vehicle age (less than 5% for the average vehicle). We also assume that the spatial distribution of the excess NOx emissions and population remains constant over time.
The excess NOx emissions are input into the air quality model as pure NO. While it is usually considered that NO accounts for more than 80% of NOx emissions from diesel vehicles (Carslaw and Beevers 2005, Yao et al 2005), it appears that the NO2 to NOx ratio in primary emissions from diesel vehicles is increasing over time (Alvarez et al 2008). However, the NOx steady-state is reached in about 3 to 30 minutes for ambient NO concentrations of 10 ppb to 1 ppb respectively (Seinfeld and Pandis 2006), which means that the initial NO2 to NOx ratio is not expected to significantly influence PM2.5 production. Ashok et al (2013) have shown in the case of aviation that the maximum sensitivity of population PM2.5 exposure to the NO2 to NOx ratio in emissions was 2.75%. Since PM2.5 is the main driver of the health impacts estimated in this study, we do not expect our results would vary significantly if we modified the NO2 to NOx ratio in the primary emissions. As for ozone, the fact that excess emissions are input as pure NO results in increased nighttime titration of ozone. However, we find that this does not occur during daylight hours due to the high background ozone concentrations. Since the ozone health impact metrics are based on exposure to 1-hour daily maximum and 8-hour daily maximum ozone concentrations which occur during the daylight hours, the calculated ozone impacts are insensitive to the primary NO2 to NOx ratio.
We assume the toxicity of different PM species to be equal, consistent with standard practice. However, it is worth noting that the particle composition of PM2.5 is suspected to influence the related health impacts, as pointed out by Hoek et al (2013) and WHO (2013b). Since NOx emissions impact ammonium nitrate most strongly, any differential toxicity of ammonium nitrate relative to the basket of urban PM for which CRFs are derived is not captured. The standard GEOS-Chem chemical mechanism does not include a detailed secondary organic aerosol model, and these compounds are therefore not included in our health impact assessment.
Although some epidemiological studies have been published which find a link between increased exposure to NO2 and premature mortality independent of exposure to other pollutants, there remains substantial disagreement with regard to the specific health outcomes affected and their magnitude. If we include the health impacts of changes in exposure to NO2 due to VW excess emissions following the recommendations of the HRAPIE group (WHO 2013a), we find that excess NOx emissions in Germany released between 2008 and 2015 caused 1300 (95% CI: 160 to 2800) additional premature mortalities due to exposure to NO2, including 1200 in Germany. The associated health costs are estimated to be 2 billion EUR (median VOLY estimate). Future emissions in the absence of modification of affected cars are expected to cause 3200 additional premature mortalities from exposure to NO2 in Europe (including 2800 in Germany) and 5.2 billion EUR in associated health costs. Including NO2 impacts would approximately double the total impacts estimated earlier, with Germany bearing the great majority of this additional burden. It should also be noted that NO2 is a precursor to ozone and secondary particulate matter (these effects are accounted for in our study).
When using a CRF derived from the findings of Turner et al (2015), we observed greater reductions in mortality due to reduced ozone exposure than our central estimate (derived from Jerrett et al 2009). Integrated excess emissions over the period 2008 to 2015 are estimated to have averted 28 premature mortalities (95% CI: 1.7 to 85) with the Jerrett et al 2009 CRF, while the Turner CRF predicts 78 avoided mortalities (95% CI: 0.28 to 640). The total impacts in Europe of past excess emissions (from exposure to both PM2.5 and O3) using the Turner CRF as the central estimate would then be 1000 premature mortalities (95% CI: 93 to 2700). This result is to be compared to the 1,200 mortalities obtained with our central CRF (95 % CI: 130 to 2800). Using the Turner CRF as the central ozone estimate, we find that future emissions in the absence of any modification to the affected cars are predicted to cause 2600 (95% CI: 230 to 6700) additional premature mortalities in Europe. This is to be compared to 2900 (95% CI: 310 to 7000) additional premature mortalities estimated with the Jerrett CRF as our central ozone estimate. In conclusion, changing our central estimate for ozone-related health impacts from Jerrett et al (2009) to Turner et al (2015) yields 10% lower mortality estimates. The Supplementary Material provides results obtained with different PM2.5 CRFs.
In addition, our assessment does not include morbidity impacts, which would increase the health costs of the estimated excess emissions but typically account for less than 10% of total health costs associated with air quality impacts (US EPA 2011). It should also be mentioned here that although the epidemiological studies used here and in the Supplementary Material are widely used in the literature (Barrett et al 2015 for instance), they represent only a small portion of the health literature on PM2.5 and ozone and mortality.
We also note that no potential environmental benefits of excess NOx emissions are included in the analysis. An example could be the reduced use of diesel exhaust fluid in the selective catalytic reduction, which could lead to a lower risk of ammonia leakage, a phenomenon which has been known to contribute to the PM2.5 health impacts of the road transportation sector at approximately equal magnitude as NOx (Dedoussi and Barrett 2014).
Finally, we note that the assessment of model performance and the corresponding correction by reciprocal biases use the baseline scenario and the officially reported emissions data. These might not fully account for real on-road emissions, and this issue might introduce a second-order effect that is not accounted for. However, given the magnitude of the perturbation (less than 0.8% of total NOx emissions), this effect is not expected to alter our results significantly.
4.2. Wider implications
In January 2016, and following orders by the KBA (2015), VW started to recall affected vehicles with the aim of reducing their NOx emissions to an as-yet unspecified level. The modification costs per car have been reported to amount to 60 EUR, excluding the value added tax (FAZ 2016). We assume that the vehicle modification can be completed within 1 hour, including time required to travel to and from the modification site. Applying an average value-of-time of 40 EUR per hour (Korzhenevych et al 2014), modification of one vehicle incurs a total cost of approximately 100 EUR. The overall cost of the recall would then be 240 million EUR. This estimate does not include other costs such as increased fuel expenses or social costs of additional carbon emissions if the vehicle modification results in a reduction in fuel economy. Assuming that the modification reduces on-road emissions to the Euro 5 standard, the total cost of the recall amounts to 5% of the median 4.4 billion EUR health costs (using the VOLY approach) which we estimate will be avoided if the recall is completed by the end of 2016. Our analysis suggests that the recall will remain net beneficial as long as the per-vehicle cost is below 1800 EUR.
Although this analysis was centered on Volkswagen-manufactured cars operated in Germany, NOx emissions from diesel vehicles in excess of the existing standards constitute a broader and ongoing issue in the European Union. On-road measurements have shown that vehicles from several other manufacturers emit more NOx than the applicable limits (Carslaw et al 2011, Franco et al 2014, BMVI 2016), despite the absence of any identified measures intended to circumvent emissions tests. These discrepancies have motivated the development of on-road emissions testing procedures (Weiss et al 2013, European Commission 2015) which were approved by the European Council in February 2016. The VW vehicles modeled in this study comprise 2.6 million of the 13 million diesel passenger vehicles operating in Germany in 2012 (Eurostat 2016). Consequently, there will be additional health impacts due to excess emissions from vehicles produced by other manufacturers that are not accounted for in our study. In addition, there were a total of 86 million diesel passenger vehicles operating in the EU28 in 2010 (Papadimitriou et al 2013), making excess diesel NOx emissions a public health concern for all of Europe. On the modeling side, current road transport NOx inventories are also likely to be affected, if they are based on measurements from laboratory test cycles (e.g. EEA 2013), given that emissions from real-world driving conditions could be significantly different than those measured during a laboratory test cycle (Franco et al 2014).
Acknowledgments
We would like to thank the German Umweltbundesamt, in particular Mr Stefan Feigenspan and Mr Michael Kotzulla, for their valuable help in obtaining data on the spatial distribution of NOx emissions in Germany.