
Abstract
Northern sub-Saharan Africa (NSSA) has a wide variety of climate zones or biomes, where albedo dynamics are highly coupled with vegetation dynamics and fire disturbances. Quantifying surface albedo variations due to fire disturbances on time scales of several months to several years is complex and is made worse by lack of accurate and spatially consistent surface albedo data. Here, we estimate the surface albedo effect from wildfires in different land cover types in the NSSA region using Moderate Resolution Imaging Spectroradiometer (MODIS) multi-year observational data (2003–11). The average decrease in albedo after fires at the scale of 1 km MODIS footprint is −0.002 02 ± 0.000 03 for woody savanna and −0.002 22 ± 0.000 03 for savanna. These two land cover types together account for >86% of the total MODIS fire count between 2003 and 2011. We found that only a small fraction of the pixels (≦̸10%) burn in two successive years and about 47% had any fire recurrence in 9 years. The study also derived the trajectories of post-fire albedo dynamics from the percentages of pixels that recover to pre-fire albedo values each year. We found that the persistence of surface albedo darkening in most land cover types in the NSSA region is limited to about 6–7 years, after which at least 99% of the burnt pixels recover to their pre-fire albedo. Our results provide critical information for deriving necessary input to various models used in determining the effects of albedo change due to wild fires in the NSSA region.
Export citation and abstract BibTeX RIS

Content from this work may be used under the terms of the Creative Commons Attribution 3.0 licence. Any further distribution of this work must maintain attribution to the author(s) and the title of the work, journal citation and DOI.
1. Introduction
Numerous studies in the sub-Saharan Africa region have provided useful insights on potential climatic impacts due to changes in the radiative properties of the surface associated with desertification and deforestation (e.g. Charney 1975, Nicholson et al 1998, Xue and Shukla 1993, Lare and Nicholson 1994). However, questions still remain over the magnitude and duration of the changes in surface characteristics that are capable of inducing noticeable effects on climate (Fuller and Ottke 2002). This study seeks to improve our understanding of fire impacts on surface albedo in the northern sub-Saharan Africa (NSSA) region.
Sub-Saharan Africa is one of the most fire-prone regions of the world with most burning occurring during the dry season (e.g. Roberts et al 2009). Wildfires in this region are closely related to the seasonal rainfall variability. Most burning north of the equator is observed between November and February, when the Inter-Tropical Convergence Zone (ITCZ) is south of the equator. Then, fire activity drops between March and July due to increasing rainfall associated with the arrival of the ITCZ (Cahoon et al 1992). Similarly, south of the equator, most burning is observed between May and October during the dry period (Barbosa et al 1999). These fires occur more frequently in the savannas, and according to Barbosa et al (1999), 51% of the African savanna burns every 2 years, while other vegetation types show a lower fire frequency, once or twice every 8 years. The burning frequency is generally higher in the north than south of the equator (Barbosa et al 1999, Roberts et al 2009).
Wildfires can significantly alter surface albedo and can create a positive radiative forcing by changing the amount of solar radiation absorbed in the climate system (e.g. O'Halloran et al 2012, Randerson et al 2006). Wildfires cause other effects such as changes in the carbon mass balance in terrestrial ecosystems, as well as the production of carbonaceous aerosols and trace gases that can enhance or offset the effects of changes in albedo (Randerson et al 2006, Andersen et al 2003). In Africa, wildfires are a key player in terrestrial ecosystems disturbance (e.g. Goldammer and de Ronde 2004). They directly influence the albedo of a surface through a number of short- and long-term effects (e.g. Pinty et al 2000, Govaerts et al 2002). On shorter timescales, the blackened surface following a fire can lead to some short-lived warming of the surface due to its lower albedo (Govaerts et al 2002). The long-term effects of biomass burning on albedo can be related to the widespread replacement of low albedo forests with croplands and grasslands that have higher albedo. So albedo may recover from resprouting vegetation within a few months in a tropical grassland, but require decades in a boreal forest (Randerson et al 2006). However, this dependence of albedo recovery on vegetation type is difficult to quantify properly owing to a large spatial and temporal variability due to other factors such as seasonal changes in vegetation cover, rainfall, and intensification of land use as measured by population density (Fuller and Ottke 2002). The complex linkage of surface albedo dynamics with changes in climate and human activities constitutes an important problem that deserves attention.
This study is a part of an interdisciplinary effort investigating the effects of intense biomass burning on the declining regional water resources as exemplified by the drying of Lake Chad (Le Houérou 1996) in a region that comprises a wide range of vegetation and climatic zones over a relatively narrow latitudinal belt (0–20°N). The interdisciplinary study seeks to assess surface, atmospheric and water cycle processes in the region through remote sensing and modelling approaches that integrate research, systems engineering, and applications expertise to best make the connections between various identified processes and phenomena. Such an approach ensures concrete results for societal benefits and climate assessments. Here, we focus on three science questions:
- (i)How does surface albedo change due to biomass burning?
- (ii)How long do these changes in surface albedo persist following fire?
- (iii)How might these changes contribute to radiative forcing?
We will address questions (i) and (ii) in this study, while (iii) will be left for future work. The remainder of this paper is organized into three main sections. Section 2 describes the methods used in the analysis of the moderate resolution imaging spectroradiometer (MODIS) albedo time series, albedo gap filling, and determination of albedo change and recovery. Section 3 describes the spatial-temporal extent of vegetation fires in NSSA (cf figure 1), and albedo change and recovery following fire activities for different land cover types in the NSSA region. Section 4 concludes with a summary of the study.
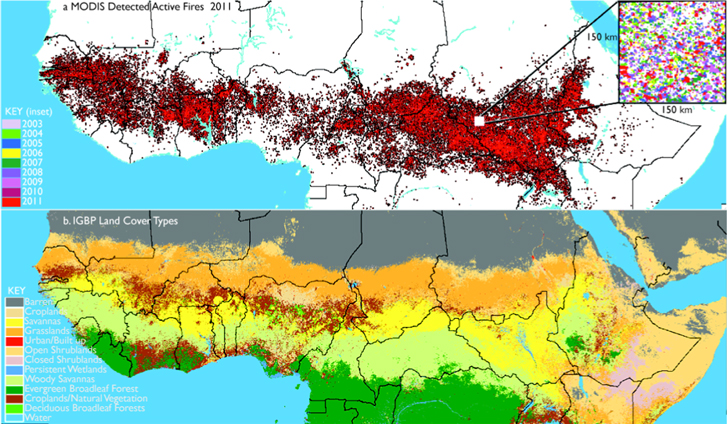
Figure 1. (a) Spatial distribution of MODIS detected fires in 2011. A similar pattern was observed for each year during 2003–11. The inset shows fire distribution for all the years (2003–11) over a small area, 150 km × 150 km in Southern Sudan. Most fires occurred in the savannas and grasslands. (b) Spatial distribution of the main types of land cover in the Northern sub-saharan Africa. Barren or sparsely vegetated lands occupy the largest area (25%), followed by woody savannas and grasslands, each at 15% (cf section 3.1).
Download figure:
Standard image High-resolution image2. Data and methods
2.1. MODIS albedo
Satellites are ideal for providing observations needed for description of surface albedo on a global scale, but we must contend with issues such as uncertainty of the measurements due to atmospheric effects, inadequate sampling (spectral, spatial and temporal), and directionality of these measurements. The global MODIS (Collection 5) albedo product, MCD43A3, (https://lpdaac.usgs.gov/products/modis_products_table/, 1 September 2012) combines measurements from both Terra and Aqua satellites to retrieve directional hemispherical reflectance (black-sky albedo) and bihemispherical reflectance (white-sky albedo) at local solar noon as both spectral (seven narrow spectral bands, MODIS channels 1–7; http://modis.gsfc.nasa.gov/about/specifications.php, 1 September 2012) and three broadband (0.3–0.7 μm, 0.7–5.0 μm, and 0.3–5.0 μm) quantities.
The albedo is derived from the bidirectional reflectance-distribution function (BRDF) model parameters that are retrieved from all high-quality, cloud-free, atmospherically corrected surface reflectance, acquired sequentially over a 16 day period at a spatial resolution of 500 m. The 16 day interval provides an appropriate trade-off between the availability of sufficient angular samples and the temporal stability of the surface (Schaaf et al 2002, Wanner et al 1997). However, the assumption of stability becomes more tenuous during periods of strong phenological change such as vegetation green-up, senescence, harvesting, or even snowfall or meltdown, when surface characteristics change abruptly. The synergistic use of MODIS observations from both Terra and Aqua offers an opportunity to increase the angular sampling, and helps to improve the coverage and quality of global BRDF and albedo retrievals (Salomon et al 2006). Note that Terra has a descending equatorial crossing time of 10:30 a.m., while Aqua has an ascending orbit with a 1:30 p.m. equatorial crossing time. High quality retrievals are obtained during periods of intermittent clear-sky observations by overlapping processing of the data such that retrievals are attempted every 8 days (based on all clear sky observations over the 16 days). However, during long periods of clear sky conditions, the 8 day overlapping introduces an autocorrelation between retrievals, since some of the observations wind up being used in more than one period of retrieval (Schaaf et al 2002).
We used high-quality white-sky broadband albedo (0.3–5.0 μm), provided within the MODIS BRDF and albedo quality product (MCD43A2), to assess the impact of biomass burning on surface albedo. The white-sky albedo is derived from BRDF measurements, integrated over both incoming and outgoing hemispheres, and does not depend on the illumination and atmospheric conditions. Oftentimes, the high quality retrievals contain significant data gaps (Gao et al 2008), especially in periods of significant cloud cover, where insufficient angular sampling leads to a magnitude inversion (rely on a priori BRDFs based on recent high quality MODIS retrievals at that location as a first guess and adjusting these by the available observations) rather than a full-model inversion (Schaaf et al 2002). A full model inversion is attempted only when at least seven cloud-free observations of the surface are available during a 16 day period, and the directional observations adequately sample the view/illumination geometry.
2.2. Gap filling method and validation
As described in section 2.1, MODIS albedo time series contains data gaps where albedo is not retrieved because of problems such as low data quality, persistent or cloud contamination, and poor illumination conditions, which lead to insufficient angular sampling and a lower accuracy on BRDF and albedo. To address the resulting data gap problem, we developed a simple algorithm for producing temporally smoothed and spatially complete MODIS white-sky albedo data set. This gap-filling algorithm first examines each pixel time-series for data gaps and then assigns it one of the five categories determined by the number of consecutive data gaps k in the time-series (k = 1, or 2, or 3, or 4, or ⩾4 gaps). Note that the largest data gap (four consecutive missing observations) represents a temporal gap of about a month and the albedo is assumed to be stable or changes slowly except during the transition period. For classes with gaps k = 1,..., 4, the missing values are determined from equation (1):

where  is the missing albedo value on a Julian day,
  ,
,  is the last existing albedo value in the time series, and
  the first albedo value in the time series after the gap. While a majority of the missing values are determined from equation (1), the method does not work well when there are more than four consecutive missing values in a time series. In this case, an attempt is made to use neighbouring pixels to estimate the missing albedo value within a small window defined by 11 × 11 MODIS 500 m pixels around the missing value, and having the same land cover type as defined by the MODIS Land Cover product (MCD12Q1). If there are no pixels of the same land cover type as the missing value in the selected window, the algorithm progressively increases the search-window size to 31 × 31, or 61 × 61, or 121 × 121, while automatically continuing the search until a suitable albedo match is found. If the algorithm finds no pixels within the maximum search distance (121 × 121 MODIS 500 m pixels), the missing value is replaced by a long-term average albedo derived from the 2003–11 MODIS albedo of each land-cover type in the entire study region. This approach ensures that every gap is filled with an albedo value that has similar characteristics as the missing pixel and impacted by the same weather systems.
To verify the efficacy of the gap filling algorithm to MODIS measurements, we tested the gap filling method by masking a part of the 'observed' data, which were randomly selected from different land cover types, and applied the gap filling method on these observations and then determined the accuracy of the gap filling method. Table 1 shows average errors (%; (estimated—observed)/observed), where absolute values range from 0.02–2.90% (1-gap), 0.02–5.53% (2-gaps), 0.12–12.90% (3-gaps), and 0.02–21.13% (4-gaps). The errors were small for barren, grasslands and open shrubland, but increase with gap length for savanna, crop/natural vegetation, and deciduous broadleaf forests. The gap-filling method performs well, but generally underestimates the albedo values.
Table 1. Average gap-filling error in albedo for different land cover types in the NSSA.
| N = 600 pixels; error (%) | ||||
|---|---|---|---|---|
| MODIS Tile: h-20, v-07 | 1-gap | 2-gaps | 3-gaps | 4-gaps |
| Barren/sparsely veg. | −0.15 | 0.02 | 1.32 | 0.02 |
| Savanna | −1.73 | −2.92 | −7.32 | −15.5 |
| Woody savanna | −1.93 | −5.53 | −12.9 | −21.13 |
| Grassland | −0.47 | −1.22 | −1.45 | −1.7 |
| Open shrubland | −0.02 | 0.82 | 1.37 | −0.43 |
| Crop/nat. vegetation | −1.45 | −3.6 | −8.93 | −13.71 |
| Closed shrub | −1.26 | −1.28 | 0.12 | −9.44 |
| Cropland | −0.98 | −0.45 | −5.79 | −10.94 |
| Deciduous broadleaf | −2.9 | −5.25 | −12.19 | −17.41 |
To check the robustness of our gap-filling approach, we applied it to MODIS measurements over a different region in the Southern Great Plains (SGP), Central Facility (36.60°N, 97.48°E), Oklahoma, USA. The SGP was selected because the site has coincident airborne surface reflectance measurements from NASA's Cloud Absorption Radiometer (CAR; Gatebe et al 2003, King et al 1986). The airborne data were acquired during the 2007 Cloud and Land Surface Interaction Campaign (CLASIC'07) on 24 June 2007. MODIS data cover a period of 32 days, centred around 24 June 2007 (day-of-the-year, DOY, 175). That period was dominated by cloudy skies and heavy rainfall in the region, resulting in a lot of missing albedo values (Román et al 2011) that had to be filled to create a good dataset to evaluate the gap filling method. Thus, we used the coincident retrievals from CAR to conduct first-order evaluation of the gap filled approach (cf table 2; figure 2, MODIS albedo2). We also compared our method to the MODIS temporally smoothed and spatially continuous albedo method by Gao et al (2008) (cf table 2; figure 2, MODIS albedo1). Note that we used the full expression for all retrievals from aircraft (CAR) and MODIS gap filled approaches (albedo1 and albedo2), as described in Román et al (2010). Although MODIS albedo values are systematically biased low against aircraft/CAR albedo and tower based albedo by about 15–20%, the two gap-filling methods (albedo1 and albedo2) agree to within 4–5% (cf table 2), but the new approach is simpler and uses mainly the most recent values on either side of the gap and land cover to fill the missing values. On the other hand, MODIS gap filling approach (Gao et al 2008) is much more rigorous and normally fit at least 18 months to adequately capture the phenology and bridge a gap. These systematic differences should have little or no impact on the determination of albedo change due to fires.
Table 2. Accuracy and uncertainty values resulting from a 32 day comparison between airborne (CAR) and satellite-derived (MODIS) albedos using two different gap-filling approaches.
| a. All Days | 10°≦̸SZA ≦̸45° (n = 289) | 45°≦̸SZA ≦̸75° (n = 193) | ||||
|---|---|---|---|---|---|---|
| DOY 159–190 | Aircraft/(CAR) | MODIS/albedo1 | MODIS/albedo2 | Aircraft/(CAR) | MODIS/albedo1 | MODIS/albedo2 |
| Accuracy | 0.0042 | −0.0286 | −0.0333 | −0.0096 | −0.0495 | −0.0570 |
| Uncertainty | 0.0082 | 0.0296 | 0.0341 | 0.0184 | 0.0526 | 0.0589 |

Figure 2. Comparisons between albedos (15 min intervals) derived from airborne CAR, tower-based measurements, and satellite MODIS using two different gap filled approaches over the CART site on 24 June 2007 during CLASIC field campaign. The difference between daily average MODIS and aircraft/tower albedo varies from 15–20% (cf table 2).
Download figure:
Standard image High-resolution image2.3. Determination of albedo change due to fires
We estimated changes in the albedo after vegetation fires for 11 major land ecosystem types in Africa that were derived from the annual MODIS Land Cover product (MOD12Q), Collection 5 (Friedl et al 2010), using the IGBP classification scheme. Barren or sparsely vegetated lands occupy a large area of the study region, 25%, followed by woody savanna, 15%, grassland, 15%, savanna, 11%, open shrubland, 11%, evergreen broadleaf, 10%, cropland or natural vegetation, 8%, closed shrubland, 2%, cropland, 2%, persistent wetland, 0.6%, deciduous broadleaf and others, ∼0.003%. Since most fires (99%) were reported in seven of the land cover classes: savanna (37.7%), woody savanna (48.7%), grasslands (4.8%), cropland or natural vegetation (5.6%), evergreen broadleaf (0.7%), open shrubland (0.7%) and croplands (0.9%), we will focus our analysis on these land cover types.
The albedo change caused by biomass burning was determined at the pixel level for each land cover type using the 2003–11 MODIS albedo data record in the entire NSSA region on a monthly basis. A pixel was considered burned when an active fire was reported in the MODIS Level-3, 8 day daily active fire product (MOD14A2) at the 1 km grid cell, assuming all the fire detection confidence levels (low-confidence fire, nominal-confidence fire, or high-confidence fire). The decision to consider fires in all confidence classes was meant to ensure that we have sufficient statistical samples for the less fire-affected land cover types, especially during the non-fire season months. Overall, the low-confidence cases accounted for <5% of all the MODIS fires detected during 2003–11 for most of the land cover types, and therefore, had little influence on the albedo perturbation estimates. The study focuses more on the albedo changes during the fire season and assumes that all 4 × 500 m MODIS albedo pixels burn for each 1 km active fire pixel detection. Here, we define the average albedo change  due to vegetation fires for a particular land cover type c as:

where,  is the albedo of a pixel before fire was observed by MODIS and
  is the albedo of the burned pixel, 24 days after fire was reported. Note that the 24 days were chosen to minimize autocorrelation caused by the 16 day data processing interval for the MODIS albedo product, which is produced every 8 days.
2.4. Estimation of albedo recovery
We used post-fire surface changes to describe post-fire recovery in different ecosystems. This was deduced from the time it took albedo to return to within 5% of its pre-fire value based on the post-fire albedo time series. This approach is illustrated in figure 3, where a time series of albedo of a burnt pixel is compared to the albedo of a control pixel. The control was selected from neighbouring pixels of the same land cover type, which showed similar albedo characteristic patterns over an extended period of time (at least 2 years prior to the fire event). Note that the interval between data points in figure 3(a) is 8 days. Figure 3(b) shows the same data, but zooming into the fire period in order to show details of the albedo recovery after the fires. Our algorithm computed the recovery period as the amount of time it took the burnt pixel to recover to within 5% of the pre-fire albedo. The 5% threshold was arbitrary, but it helped to deal with cases where a sudden increase occurred as the albedo approached the pre-fire value. For both pixels, the pre-fire albedo values exhibit a seasonal trend consistent with the vegetation phenology changes from senescence to green-up. The corresponding post-fire albedo values follow a similar trend, but the control pixel shows consistently lower values after the fire is detected (gray-shaded region in figures 3(a) and (b)). Since the points represent albedo every eight days, the recovery period in this case takes 288 days or less than a year. Figure 3(c) shows a plot of albedo time series of both burned and unburned savanna pixels over a longer period (8 years) to further illustrate how this approach works. In this case fire was detected on 26 June 2006 and the recovery took about 1 year and a 3 months, and so the albedo had recovered by 8 October 2007.

Figure 3. (a) An example of albedo time series of a burned savanna pixel (red line) and its corresponding control pixel (blue line) beginning 10 Feb 2005 to 2 Feb 2008. The gray-shaded area represents mostly the post-fire period. (b) Same as (a), but zooming into the post-fire period. The control pixel mimics the burned pixel without fire. Fire was detected on 26 June 2006 and its effect on albedo lasted for about 288 days. (c). Time series to show the pattern over a longer period. In this case fire was detected on 26 June 2006. Albedo was fully recovered by December 2007.
Download figure:
Standard image High-resolution image3. Results
3.1. Spatial-temporal extent of vegetation fires in the NSSA
In the NSSA region, most fires are detected south of the Sahara desert almost across the whole region from west to east (figure 1(a)). Some areas such as Southern Sudan appear to be more fire-prone than others, as nearly every square km of land seems to have been affected by fire at least once between 2003 and 2011 (cf figure 1(a): inset). During that 9 year period, with approximately two overpasses by Terra every 24 h (once during the day and once at night), the total MODIS active fire-pixel count at 1 km resolution in the entire NSSA region is about 2.2 million, with an annual average of about 11% of the total fire count. Indeed, this confirms that Africa has one of the highest frequencies of fire occurrence of fire per land area than any other continent (cf Ichoku et al 2008). The occurrence of wildfires is more frequent in the savannas (woody savanna and savanna), which account for >86% of the total MODIS fire count between 2003 and 2011 (table 4, column 2 and figure 1(b)). Hence, the spatial-temporal extent of vegetation fires in sub-Saharan Africa is widespread, and the disturbance rates from year to year remain uniform based on MODIS fire count between 2003 and 2011. We note that these fire statistics are likely an underestimate of the actual fire activity, since smaller and cooler fires are probably missed due to the relatively high thresholds used in the MODIS global fire detection algorithm (Giglio et al 2003, Justice et al 2002).
Because the frequency with which fire returns to a given ecosystem is an important component of its fire regime and influences albedo perturbation, we also determined the ratio of the number of pixels that burned at successive intervals (1–8 years; starting with pixels that burned in 2003) to the total number of pixels that burned in 2003 in each land cover type. Figure 4(a) shows results of this analysis, where only about 10% of the savanna pixels that burned in 2003 burned again after 1 year and the number decreases almost linearly in subsequent years. A total of 47% pixels burned again by 2011. The evergreen broadleaf shows a different pattern, where there is a peak between the third and fourth year, and a second peak seems to be forming after the eighth year. A total of 15% of the evergreen broad leaf pixels that burned in 2003 had burned again by 2011. Figure 4(b) shows the fire count ratios for the other land cover types. Note that the total numbers of pixels that burned again differs in each case in 9 years (woody savanna, 40%; grasslands, 35%; open shrubland, 28%; cropland, 34%; and cropland or natural vegetation, 27%). In the following sections, we are going to look at the results of albedo perturbation and the albedo recovery.

Figure 4. Ratio of the number pixels that burned at successive intervals (1–8 years; given that the pixel burned in 2003) to the total number of pixels that had burned in 2003 for different land cover types. For savanna, ≦̸10% of the pixels that burned in 2003 burned again in 2004 and a total of 47% of the pixels burned at least twice within a period of 9 years.
Download figure:
Standard image High-resolution image3.2. Albedo perturbation caused by biomass burning
It is important to critically examine the impacts of fire-induced albedo perturbation and recovery. Table 3 shows the average albedo values of different land cover types before fire was reported. We averaged the pre-fire values in each pixel in a given month for the period 2003–11. Table 4 shows the albedo change as derived from equation (3) for each of the land cover types. The standard deviation in each case represents the temporal and spatial variability of the albedo or albedo perturbation. The albedo change caused by fires varies by ecosystem type as depicted in figure 5 and table 4. Some ecosystems show large values of the standard deviation partly because of post-fire changes in surface albedo associated with dissipation of charcoal and ash, and vegetation regrowth over the 24 days period used to calculate monthly post-fire albedo change (cf Amiro et al 2006, Jin and Roy 2005). All land cover types show a decrease in albedo after fires, except for croplands, which show an increase after fire probably related to the exposure of the underlying soils with higher albedo (Hoffa et al 1999). For the majority of the land-cover types, the albedo darkening is probably related to the deposition of charcoal and ash, or vegetation growth. While fires reduce or darken the surface albedo as observed during the fire season (figure 5), there are cases where the monthly albedo perturbations show an increase especially during the northern hemisphere summer months (cf table 4). Higher spatio-temporal variability in the albedo during these months could account for greater uncertainty in characterizing the undisturbed albedo. Quantifying the albedo perturbation during these months is further hampered by the relatively few fire events.
Table 3. Average monthly albedo of pixel from MODIS (2003–11) before fire was reported.
| Land cover | Jan | Feb | Mar | April | May | June | July | Aug | Sept | Oct | Nov | Dec |
|---|---|---|---|---|---|---|---|---|---|---|---|---|
| Savanna | 0.135 ± 0.004 | 0.147 ± 0.002 | 0.159 ± 0.002 | 0.160 ± 0.005 | 0.162 ± 0.005 | 0.158 ± 0.005 | 0.151 ± 0.013 | 0.143 ± 0.019 | 0.135 ± 0.014 | 0.147 ± 0.003 | 0.130 ± 0.003 | 0.130 ± 0.002 |
| Woody savanna | 0.128 ± 0.004 | 0.137 ± 0.002 | 0.148 ± 0.003 | 0.151 ± 0.005 | 0.155 ± 0.005 | 0.157 ± 0.007 | 0.145 ± 0.014 | 0.147 ± 0.019 | 0.137 ± 0.009 | 0.144 ± 0.002 | 0.130 ± 0.002 | 0.126 ± 0.003 |
| Evergreen broadleaf | 0.123 ± 0.003 | 0.127 ± 0.002 | 0.140 ± 0.006 | 0.140 ± 0.005 | 0.138 ± 0.005 | 0.148 ± 0.008 | 0.140 ± 0.014 | 0.138 ± 0.009 | 0.140 ± 0.017 | 0.130 ± 0.014 | 0.130 ± 0.007 | 0.120 ± 0.006 |
| Grassland | 0.155 ± 0.007 | 0.165 ± 0.004 | 0.175 ± 0.004 | 0.180 ± 0.006 | 0.187 ± 0.012 | 0.189 ± 0.012 | 0.166 ± 0.015 | 0.158 ± 0.012 | 0.155 ± 0.017 | 0.161 ± 0.006 | 0.145 ± 0.003 | 0.151 ± 0.004 |
| Open shrubland | 0.167 ± 0.006 | 0.184 ± 0.006 | 0.195 ± 0.015 | 0.193 ± 0.011 | 0.201 ± 0.004 | 0.209 ± 0.016 | 0.219 ± 0.032 | 0.228 ± 0.054 | 0.183 ± 0.022 | 0.164 ± 0.009 | 0.155 ± 0.008 | 0.164 ± 0.007 |
| Crop/nat. vegetation | 0.155 ± 0.003 | 0.162 ± 0.003 | 0.171 ± 0.003 | 0.176 ± 0.007 | 0.178 ± 0.007 | 0.174 ± 0.006 | 0.157 ± 0.014 | 0.161 ± 0.017 | 0.152 ± 0.011 | 0.157 ± 0.003 | 0.151 ± 0.004 | 0.155 ± 0.003 |
| Cropland | 0.155 ± 0.004 | 0.164 ± 0.006 | 0.170 ± 0.004 | 0.172 ± 0.004 | 0.167 ± 0.006 | 0.170 ± 0.015 | 0.157 ± 0.014 | 0.144 ± 0.017 | 0.146 ± 0.018 | 0.160 ± 0.008 | 0.148 ± 0.006 | 0.152 ± 0.004 |
Table 4. Fire frequency and albedo change due fires from MODIS (2003–11) for different land cover types in the NSSA.
| Albedo change (×10−3) | |||||||||||||
|---|---|---|---|---|---|---|---|---|---|---|---|---|---|
| Fire count (%) | Jan | Feb | Mar | Apr | May | Jun | Jul | Aug | Sep | Oct | Nov | Dec | |
| Savanna | 37.73 | −2.0 ± 3.5 | −3.7 ± 4.3 | 0.7 ± 5.0 | 1.3 ± 3.5 | 1.7 ± 3.5 | 5.1 ± 4.8 | 1.2 ± 8.1 | −0.5 ± 9.8 | 0.5 ± 6.0 | 4.2 ± 4.8 | 0.1 ± 2.6 | −3.1 ± 3.4 |
| Woody Savanna | 48.69 | −1.1 ± 3.7 | −3.0 ± 4.0 | −0.9 ± 3.4 | −0.1 ± 2.5 | 0.2 ± 2.5 | 1.9 ± 5.1 | 3.8 ± 15.0 | −0.3 ± 10.4 | 3.2 ± 7.4 | 3.3 ± 3.7 | 2.4 ± 2.8 | −2.1 ± 3.2 |
| Evergreen broadleaf | 0.71 | 2.0 ± 3.4 | −4.9 ± 7.2 | 0.4 ± 6.1 | −1.4 ± 5.9 | −1.2 ± 8.7 | −2.3 ± 12.0 | 7.5 ± 18.9 | −0.7 ± 14.5 | 5.9 ± 16.0 | −0.2 ± 15.0 | 2.1 ± 4.9 | −2.4 ± 4.3 |
| Grassland | 4.78 | −0.8 ± 2.8 | −3.0 ± 4.1 | −0.5 ± 3.8 | 1.9 ± 3.9 | −2.3 ± 3.7 | 3.7 ± 6.9 | 2.4 ± 14.3 | 4.4 ± 12.5 | −1.4 ± 4.9 | −0.8 ± 3.2 | 0.1 ± 3.4 | −0.6 ± 3.7 |
| Open shrubland | 0.67 | 0.0 ± 3.1 | −2.0 ± 3.8 | −0.3 ± 4.5 | 1.2 ± 5.2 | −0.4 ± 3.5 | 7.6 ± 7.1 | 9.6 ± 10.4 | −6.3 ± 12.3 | −1.6 ± 6.3 | −0.7 ± 2.6 | 1.5 ± 3.2 | −1.5 ± 3.2 |
| Crop/nat. vegetation | 5.59 | −0.2 ± 2.4 | −2.6 ± 3.0 | 0.5 ± 4.6 | 0.5 ± 3.0 | −0.6 ± 4.0 | 1.6 ± 7.3 | 2.1 ± 14.1 | −1.8 ± 15.2 | 0.2 ± 6.5 | −0.5 ± 1.6 | 1.1 ± 3.3 | −0.7 ± 2.8 |
| Cropland | 0.89 | 1.1 ± 3.8 | −3.2 ± 3.7 | 1.0 ± 6.0 | 2.0 ± 4.5 | −3.0 ± 5.2 | 0.5 ± 7.6 | −1.8 ± 13.0 | −1.9 ± 16.7 | 0.6 ± 6.0 | −0.3 ± 3.3 | 3.1 ± 5.0 | 1.0 ± 2.3 |
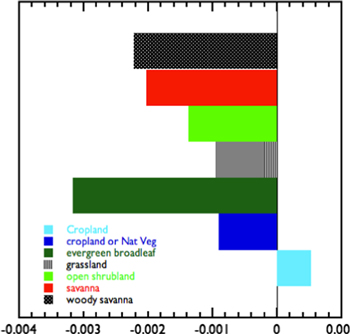
Figure 5. Albedo perturbation during the fire season (November–March).
Download figure:
Standard image High-resolution imageThe satellite-derived albedo perturbations in this study are several orders of magnitude smaller compared to points or tower measurements immediately following a fire. For example, Beringer et al (2003) reported a drop of about 42% immediately following a fire. Large differences are to be expected for comparisons of satellite data with the point or tower measurements owing to the greater than 1 km scale of the satellite footprint, which in many cases may integrate signal from both burned and unburned areas in different proportions within each pixel. Jin and Roy (2005) report albedo changes up to a factor of 10 larger than the averages reported in table 4 in a study of satellite data for Australian savannas. This difference might be attributable to limited geographical coverage (Africa, 0–20°N versus Australia north of 26.5°S) and/or the large statistics considered in our study (9 years versus 1 year). Govaerts et al (2002) estimate albedo changes from all daylight Meteosat-5 data acquired during January and December in 1996 over sub-Saharan Africa range from 5% to 8% of the unburned albedo. The corresponding values for savannas surfaces in table 4 are slightly smaller than the lower end of the Govaerts et al (2002) range. We note that the derived surface albedo perturbation in the Govaerts et al (2002) is the hemispherical integration of the BRF for a given position of the Sun fixed at 30°, estimated within the Meteosat radiometer visible (VIS) band running approximately from 0.4 μm up to 1.1 μm. Therefore, these differences between the two studies are to be expected.
3.3. Post-fire albedo recovery
The post-fire albedo recovery is important for the radiative forcing estimates and for modeling post-fire albedo dynamics (both seasonal or annual). Table 5 and figure 6 summarize the post-fire albedo recovery in terms of percentage of pixels that recover to pre-fire values for burn events that took place in 2003 tracked cumulatively at 3 month intervals over a period of 7 years for the land cover types investigated. At each step, we normalized by the total number of tracked pixels in their respective land cover types. The albedo recovery after fires progresses rapidly within the first year, with the savannas leading in recovery rate (>77%), and the evergreen broad leaf showing the least recovery (58%). By the end of the second year after fires, over 80% of the burnt pixels for all the biomes recover to their pre-fire albedo. For the savannas, where 86% of burning takes place, the recovery of the burnt pixels exceeds 99% after 5 years. The persistence of surface albedo darkening (or brightening, where applicable) is limited to about 6–7 years, when at least 99% of the burnt pixels recover to their pre-fire albedo for all land cover types. A very basic fitting of the data reveals that the percentage of pixels that recover to their pre-fire albedo values can be described by a simple exponential function:

where,  is the % albedo recovery after t years for any land cover type c, and 'a' is a constant (∼50). This simple function explains the observed percentage of pixels that recover to their pre-fire albedo values for a particular land cover type (e.g. savanna, woody savanna, cropland, cropland or natural vegetation, and open shrublands), where the function predicts a minimum recovery of about 50% within the first 3 months after fire. However, it overestimates the recovery of the other land cover types (e.g. evergreen broad leaf) by about 30% within the first 3 months after the fire. It is very clear from this analysis that the percentage of pixels that recover to their pre-fire albedo values, as determined from satellite data, provides another perspective on how fast the albedo recovers over various land-cover types in the NSSA region. However, in order to apply these results to radiative forcing and modeling studies of post-fire albedo dynamics, a relationship with actual albedo recovery (both seasonally and annually) has to be established and validated. That task is beyond the scope of the current study, but need to be developed in future.
Table 5. Post-fire albedo recovery after every three months.
| No of burnt pixels with full-albedo recovery (%) | |||||||
|---|---|---|---|---|---|---|---|
| Yrs | Savanna | Woody savanna | Grassland | Cropland | Cropland nat. veg | Evergreenbroadleaf | Open Shrubland |
| 0.25 | 49.25 | 41.18 | 34.47 | 24.58 | 45.94 | 25.46 | 35.92 |
| 0.49 | 55.47 | 44.61 | 43.71 | 49.49 | 53.61 | 33.72 | 43.69 |
| 0.74 | 60.94 | 53.06 | 51.35 | 62.63 | 62.12 | 45.87 | 54.13 |
| 0.99 | 77.93 | 81.77 | 73.02 | 71.38 | 79.79 | 58.26 | 64.32 |
| 1.23 | 83.71 | 88.01 | 76.87 | 77.10 | 82.39 | 64.91 | 69.17 |
| 1.48 | 84.13 | 88.21 | 77.45 | 79.12 | 83.17 | 67.20 | 71.60 |
| 1.73 | 84.64 | 88.49 | 78.91 | 82.32 | 84.15 | 70.87 | 75.49 |
| 1.97 | 87.99 | 91.99 | 88.73 | 85.35 | 88.17 | 75.92 | 79.61 |
| 2.22 | 92.00 | 94.17 | 90.25 | 87.21 | 91.10 | 78.90 | 82.52 |
| 2.47 | 92.18 | 94.21 | 90.47 | 87.88 | 91.16 | 79.59 | 83.01 |
| 2.71 | 92.31 | 94.33 | 90.91 | 89.56 | 91.62 | 81.42 | 84.71 |
| 2.96 | 93.21 | 95.49 | 94.11 | 91.58 | 94.28 | 84.40 | 87.62 |
| 3.21 | 95.75 | 96.83 | 94.98 | 93.43 | 95.19 | 86.70 | 89.81 |
| 3.45 | 95.88 | 96.90 | 95.56 | 94.44 | 95.52 | 88.07 | 91.26 |
| 3.70 | 95.93 | 96.99 | 95.78 | 95.45 | 95.78 | 89.91 | 92.96 |
| 3.95 | 96.20 | 97.31 | 97.16 | 96.46 | 96.56 | 91.51 | 94.42 |
| 4.19 | 97.71 | 98.26 | 97.96 | 97.14 | 97.21 | 93.35 | 95.15 |
| 4.44 | 97.76 | 98.30 | 98.11 | 97.31 | 97.40 | 94.04 | 95.87 |
| 4.68 | 97.83 | 98.34 | 98.11 | 97.98 | 97.60 | 94.95 | 96.84 |
| 4.93 | 98.06 | 98.55 | 98.55 | 98.15 | 98.05 | 95.18 | 97.09 |
| 5.18 | 99.35 | 99.30 | 99.20 | 98.65 | 98.64 | 96.10 | 98.06 |
| 5.42 | 99.39 | 99.32 | 99.27 | 98.99 | 98.64 | 96.33 | 98.30 |
| 5.67 | 99.41 | 99.36 | 99.27 | 98.99 | 98.64 | 96.33 | 98.30 |
| 5.92 | 99.50 | 99.47 | 99.71 | 99.16 | 98.77 | 96.79 | 99.03 |
| 6.16 | 99.87 | 99.90 | 99.93 | 99.66 | 99.48 | 97.71 | 99.76 |
| 6.41 | 99.88 | 99.91 | 100.00 | 99.83 | 99.55 | 97.94 | 100.00 |
| 6.66 | 99.88 | 99.91 | 100.00 | 100.00 | 99.94 | 97.94 | 100.00 |

Figure 6. Percentage of pixels burned in 2003 that has recovered by each subsequent year tracked over a period of 7 years for different land cover types in northern sub-Saharan Africa. Points are plotted every 90 days.
Download figure:
Standard image High-resolution image
4. Summary and conclusions
The extent of wildfires in Africa can be seen clearly from a map of active fire detected by satellite sensors such as the MODIS aboard Terra and Aqua at their times of overpass under relatively cloud-free conditions. We found that the spatial-temporal extent of vegetation fires in sub-Saharan Africa is widespread, and the disturbance rates from year to year remain uniform based on MODIS fire count between 2003 and 2011. We also found that only a small fraction of the pixels (≦̸10%) burn twice in two successive years and ≦̸47% in 9 years.
We estimated the change of surface albedo due to fires over different land cover types in the NSSA using long MODIS time series for the period of 2003–11. We found a decrease in albedo over most land cover types due to fires (e.g. woody savanna (−0.002 02 ± 0.000 03) and savanna (−0.002 22 ± 0.000 03), which accounted for >86% of the total MODIS fire count between 2003 and 2011. Evergreen broadleaf had a larger reduction (−0.003 17 ± 0.000 03) than the savanna, but accounted for only about 0.7% of the total fire count. The observed monthly albedo perturbation in each month for various biomes in NSSA is variable, while the largest values were observed in July, probably caused by uncertainties due to rapidly changing albedo associated with the peak growing season. During the fire season the albedo decrease is correlated with peak fire count of most of the investigated land cover types (e.g. savanna), possibly related to post-fire albedo darkening due to dissipation of charcoal and ash, or vegetation regrowth. However, for very few land cover types (e.g. croplands), there is albedo increase that is correlated with peak fire count, probably related to the exposure of the underlying soils with higher albedo.
The study demonstrates a simple method for deriving the trajectories of post-fire albedo dynamics from satellite data that is consistent and widely available. The percentage of pixels that recover to their pre-fire albedo values provide some insights on how fast the albedo recovers over various land-cover in the NSSA region. The persistence of surface albedo darkening (or brightening, where applicable) is limited to about 6–7 years. The albedo recovery after fires can be described by a simple exponential function, regardless of vegetation type.
Our results can provide critical information for deriving necessary input to various models used in the different aspects of the broader interdisciplinary research in determining the regional atmospheric heating rates due to biomass burning and effects on the radiative forcing and feedbacks in the NSSA region. They can also be useful in the land-surface models to determine the effects of albedo changes due to fires on soil moisture budget, evapotranspiration, infiltration, and runoff, all of which govern the land-surface component of the water cycle. Our surface albedo change results can be ingested in atmospheric models, where they can serve as part of the essential input parameters based upon which radiative energy budget estimates are made, both at the surface and at the top of the atmosphere. As such, these models can better characterize the effects of change in surface albedo due to fires on the atmospheric heating rates of the black carbon aerosols emitted by fires, which can affect the atmospheric component of the water cycle through the interaction of radiation with surface albedo and the aerosol indirect radiative effects on clouds. Furthermore, information on the spatial and temporal dynamics of the post-fire albedo recovery will be important in modelling the medium- to long-term climate impacts of fires in the NSSA region.
Acknowledgements
This research was supported by the Science Mission Directorate of the National Aeronautics and Space Administration as part of the Interdisciplinary Studies (IDS) program headed by Dr Jack Kaye, and conducted through the Radiation Sciences Program under Dr Hal B. Maring. We also acknowledge support from NASA's Terrestrial Ecology Program managed by Dr Diane Wickland.