
Abstract
Estimates of global thunderstorm activity have been made predominately by direct measurements of lightning discharges around the globe, either by optical measurements from satellites, or using ground-based radio antennas. In this paper we propose a new methodology in which thunderstorm clusters are constructed based on the lightning strokes detected by the World Wide Lightning Location Network (WWLLN) in the very low frequency range. We find that even with low lightning detection efficiency on a global scale, the spatial and temporal distribution of global thunderstorm cells is well reproduced. This is validated by comparing the global diurnal variations of the thunderstorm cells, and the currents produced by these storms, with the well-known Carnegie Curve, which represents the mean diurnal variability of the global atmospheric electric circuit, driven by thunderstorm activity. While the Carnegie Curve agrees well with our diurnal thunderstorm cluster variations, there is little agreement between the Carnegie Curve and the diurnal variation in the number of lightning strokes detected by the WWLLN. When multiplying the number of clusters we detect by the mean thunderstorm conduction current for land and ocean thunderstorms (Mach et al 2011 J. Geophys. Res. 116 D05201) we get a total average current of about 760 A. Our results show that thunderstorms alone explain more than 90% in the variability of the global electric circuit. However, while it has been previously shown that 90% of the global lightning occurs over continental landmasses, we show that around 50% of the thunderstorms are over the oceans, and from 00-09UTC there are more thunderstorm cells globally over the oceans than over the continents. Since the detection efficiency of the WWLLN system has increased over time, we estimate that the lower bound of the mean number of global thunderstorm cells in 2012 was around 1050 per hour, varying from around 840 at 03UTC to 1150 storms at 19UTC.
Export citation and abstract BibTeX RIS

Content from this work may be used under the terms of the Creative Commons Attribution 3.0 licence. Any further distribution of this work must maintain attribution to the author(s) and the title of the work, journal citation and DOI.
1. Introduction
The atmospheric global electric circuit (GEC) is a global analogue between a simple electric circuit with resistors, batteries, capacitors, and wires, and the electric fields and currents measured in the Earth's atmosphere (Siingh et al 2007, Rycroft and Harrison 2011). The conductive Earth and ionosphere produce an Earth–ionosphere wave guide (EIWG) analogous to a spherical capacitor, where the Earth's surface is negatively charged from lightning strokes and corona currents below thunderstorms, and the atmosphere is positively charged with ions originating from radioactive decay near the surface, cosmic rays at higher altitudes and the Sun above 60 km, with maximum conductivity in the ionosphere (Williams 1992, 2009, Price 1993, Rycroft et al 2000, Markson 2007). The ionospheric potential of 250 kV between the ionosphere and the surface drives vertical fair weather currents, measured at about −1.5 pA m−2 at the Earth's surface (Rycroft et al 2000, 2008, 2012, Bennett and Harrison 2008). However, the ionospheric potential, the vertical conduction currents, and the vertical electric field at the Earth's surface do not decay with time, and almost a hundred years ago it was hypothesized that thunderstorms play a significant role in maintaining the GEC, acting as the generators in the circuit (Wilson 1921, Whipple 1929, 1938, Ogawa 1985, Aplin et al 2008, Rycroft et al 2008). Concurrently, Earth's vertical electric field (potential gradient) at the surface, which is measured at about −130 V m−1 (Williams 2009, Rycroft et al 2012) was shown to have a distinct diurnal variation independent of measuring location, showing a minimum at 03UTC and a maximum around 19UTC. This variation was initially measured aboard the geophysical survey vessel of the Carnegie Institution of Washington (1909–1929) (Whipple 1929, 1938, Harrison 2013), and was later coined as the Carnegie Curve.
If indeed thunderstorms are the main driver of the GEC, then the Carnegie Curve reflects the time of maximum and minimum thunderstorm activity around the globe. This paper supports the claim that thunderstorm activity is the predominant driver of the GEC diurnal variation. Wilson (1921) was the first to state that electrified clouds (thunderstorms and shower clouds) contributed significantly to the fair weather fields and to the GEC. In the 1920s Whipple used the diurnal variation in thunderdays (the only global data available at that time), along with assumptions made about the audible distance of thunder and thunderstorm density (Whipple 1929, 1938) to show that the diurnal variations of thunderstorms around the globe matched fairly well the observed Carnegie Curve, representing the GEC. A later trial used cloud cover as an indicator for thunderstorm activity (Trent and Gathman 1972). Recent developments in satellite lightning detections techniques have contributed to a more accurate assessment of thunderstorms' role in the GEC. Optical instruments aboard satellites like the Lightning Imaging Sensor (LIS) aboard the Tropical Rain Measuring Mission (TRMM) (Kummerow et al 1998, Christian et al 2003), and the optical transient detector (OTD) aboard MicroLab-1 satellite (Boccippio et al 2000), were used to evaluate the diurnal cycle of thunderstorms (Williams et al 2000, Bailey et al 2007, Mach et al 2011, Blakeslee et al 2014). However, satellites do not provide spatially and temporally continuous global observations, since each measurement is taken only during a 90 s interval at a specific location. The studies mentioned above investigated the variations in both flash density and the number of storms. Bailey et al (2007) showed that 'global lightning is well correlated in phase but not in amplitude with the Carnegie Curve.' According to Mach et al (2011), who used combined satellite-aircraft data, the diurnal variation in thunderstorms (by definition with lightning) explains 87% of the global current in the GEC, with 13% from shower clouds (with no lightning). Consistent with this result, Blakeslee et al (2014), who added an additional aircraft data set, found slightly revised contributions of 83% from thunderstorms and 17% from electrified shower clouds (ESCs). In an additional sensitivity exercise relevant to this paper, Mach et al (2011) claim an increase in the contribution to the GEC to about 30% from shower clouds without lightning by applying three times (3x) the contribution of shower clouds inferred in their analysis, resulting in a 'best fit' in a root mean square percentage difference sense between the Carnegie Curve and their results (although all the results fall within the error bounds of both Carnegie and their data).
The definition of ESCs is problematic in previous studies due to the limited observation time of the storms. In Liu et al (2010), Mach et al (2011), and Blakeslee et al (2014) a combination of aircraft overflight data and low Earth orbiting satellites were used to separate ESCs from thunderstorms with lightning. Since the observation time for both aircraft and satellite was 1–2 min, storms with lightning occurring once every few minutes (weak thunderstorms) would be labeled ESCs while they actually were thunderstorms. In many regions of the globe thunderstorms can have lightning discharges at intervals of more than a few minutes, especially at the growing and decaying stage of storms, and especially ocean thunderstorms (Petersen et al 1996, Altaratz et al 2001). In this study we integrate over 1 h of World Wide Lightning Location Network (WWLLN) data, and hence our thunderstorm clusters are assumed to include all the ESCs defined in previous studies using satellite and aircraft observations. Obviously, true ESCs with no lightning cannot be detected by WWLLN, by definition.
Although we now have good estimations of lightning flash density around the globe (Christian et al 2003), a basic answer to the age-old question; 'How many active thunderstorms are there at any given moment?' remains uncertain. The answer was first evaluated in the 1920s with an estimation made by Brooks (1925). His estimation was based on the maximum audible sound distance of thunder, which he assumed to be 13 km, and on statistics stating that there are on average 16 thunderdays per unit area per year. Using these assumptions Brooks calculated that globally there should be 1800 active storms per hour distributed around the planet. This approach is susceptible to overestimations: land and ocean have the same number of thunder days, audible distance of thunder, and underestimations: a thunderday has only one thunderstorm, and a small number of stations in Africa and South America were deployed then. Later Gish and Wait (1950) relied on the GEC model to estimate the 'world population of thunderstorms'. They integrated the fair-weather current over the area of the Earth and divided it by the current measured above individual thunderstorms. This yielded 1275–2200 thunderstorms per hour depending on the current value used, which have been re-estimated every couple of years as more advanced measurements take place (Gish and Wait 1950, Rycroft et al 2000, 2012, Markson 2007, Mach et al 2011, Blakeslee et al 2014, Hutchins et al 2014). In addition, refinements of the GEC model, stating that fair-weather regions make up 99% of Earth's surface, contribute to re-evaluating this number (Rycroft et al 2000).
While this paper was in review, a similar thunderstorm clustering paper was independently published also using the WWLLN data (Hutchins et al 2014). While they used a different clustering scheme, the results are quite similar, supporting the findings of this paper. However, the parameters used for their clustering scheme are quite different, influencing the global number of clusters detected.
2. Methods
The WWLLN is currently comprised of 70 stations (as of October 2013) distributed unevenly worldwide (Virts et al 2013) and is based on a time of group arrival (TOGA) algorithm in the very low frequency (VLF, 3–30 kHz) radiation band (Barr et al 2000, Price 2008, Rakov 2013a). The network is capable of detecting radio waves primarily from cloud to ground lightning (CG) at distances of thousands of kilometers from each station (Hutchins et al 2012, Rudlosky and Shea 2013, Virts et al 2013). These CG flashes are known to make up only about 25% of total lighting activity (with this fraction being latitude dependent) (Price and Rind 1993, Rakov 2013b). While not known exactly, the WWLLN's detection efficiency improves with time, as more and more stations are being added (Hutchins et al 2012). As of 2011 the network is able to locate strokes with better than 5 km and greater than 10 μs accuracy, having an estimated detection efficiency of about 11% for all CG flashes and more than 30% for flashes with peak current higher than 130 kA (Rodger et al 2009, Abarca et al 2010, Hutchins et al 2012, Virts et al 2013).
One important aspect of using VLF data to detect global lightning is the different propagation characteristics between day and night. Due to changes in the EIWG more absorption of VLF waves occurs during daytime relative to nighttime. Hence, one needs to be careful looking at diurnal variations in lightning statistics due to the different detection efficiencies during day and night. Although this difference in the detection efficiency impacts the detection of individual strokes and flashes, we assume that normal sized thunderstorms themselves are efficiently detected when integrating over a one hour period (Abreu et al 2010, Hutchins et al 2012, 2014), whether WWLLN sees one or one hundred flashes in a storm (see below). However, this day–night difference in VLF propagation may impact the diurnal detection efficiency of the thunderstorm clusters as well, impacting our results below.
The WWLLN provides data from the early 2000s, but for the purpose of global analysis of thunderstorms, the number of stations, their distribution, and detection rates only became useful in 2006 (Rodger et al 2006). Consequently, the analysis in this paper includes data from the years 2006–2012. However, this does not imply that since 2006 we detect all thunderstorm clusters around the globe. The true detection efficiency of the network is still unknown and we assume that there are many small weak thunderstorms that are missed. In fact, in supplemental figure S1 we show that the detected thunderstorm clusters increase every year between 2006 and 2012, with no leveling off of the number of clusters. Hence, we are still far from reaching the true number of thunderstorms on Earth, and we will likely need many more VLF sensors to cover the planet before we can detect the real number of storms. The implication of this is that all estimates in this paper supply a lower bound on the global thunderstorm number. In addition, without additional information we assume that these missed storms have the same spatial and temporal distribution as the larger detected clusters. The implications of this assumption will be discussed later.
In order to convert WWLLN strokes (figure 1(a)) to thunderstorm cells, the data were first converted to a density matrix with a global resolution of 0.15° × 0.15° and temporal resolution of an hour (due to the typical thunderstorm cell life cycle and spatial size). The pixel resolution had to be bigger than WWLLN's spatial accuracy, yet small enough to capture single cell storms; hence, it dictated a pixel size of 0.15° × 0.15°. The data were analyzed with Matlab's imaging technique using binary image operations. A binary value of 1 was assigned to every cell that contained at least a single lightning detection, while the rest were set to 0. Zero-cells bordering two opposing 1-cells, i.e. both of their North and South edges, or both of their East and West edges, were transformed into a 1-cell, thus forming a sequence. This correction was necessary to overcome WWLLN's detection and location limitations. Without it, very close yet different clusters that might belong to the same thunderstorm would frequently populate the results.
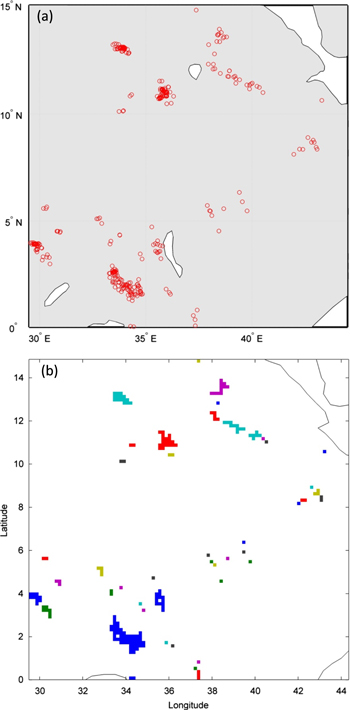
Figure 1. Thunderstorm data in East Africa on 01/09/2011, 16-17UTC: (a) WWLLN detections (total of 318 strokes). (b) Thunderstorm clusters (total of 45) calculated from WWLLN data. Color is meant to aid distinguishing between different storm cells and has no other physical meaning.
Download figure:
Standard image High-resolution imageThe labeling of the binary clusters implemented an operation known as connected component labeling (Hoshen and Kopelman 1976). The algorithm then scans through the global grid utilizing a 3-by-3 lookup table that examines all four neighboring (and bordering) pixels and finds the connected components. The search is done in a column-wise fashion (top to bottom and progresses left to right). If a 1-cell has zero occupied neighbors then it is assigned a new label. If the cell has one occupied neighbor, then it receives its neighbors' label. If the cell has more than one occupied neighboring cells, then the lowest-numbered cluster label of the occupied neighbors is used as the label of the subject cell. All the pixels in the first binary cluster are labeled 1 and those in the second as 2 etc. This operation is also known as the union-find technique. Figure 1(b) shows a graphic representation of the thunderstorm clusters over East Africa (the different colors are meant to distinguish between different clusters). A 'reality check' between the WWLLN thunderstorm clusters and independent satellite infrared (10.8 μm) images (Meteosat satellite) of clouds was also performed (figure 2). In general, the cold thunderstorm tops (yellow) are larger than the WWLLN clusters. There are two reasons for this: the cold clouds also include cirrus clouds, which generally do not produce lightning, and the size of a thunderstorm clusters is very much dictated by the grid size used. The discrepancy in location, where a WWLLN cluster is found and a cloud is not, is mainly due to the re-gridded smoothing (averaging of temperature) from 0.03° × 0.03° to 0.15° × 0.15°, which was made in order to overlay the thunderstorm clusters. When re-examining the cells locations with the inherent resolution of the satellite images small cloud clusters do appear to match the location of WWLLN's clusters. Nevertheless, it is expected that lightning may occur adjacent to cloudy pixels and not necessarily under the cloud deck.

Figure 2. 01/09/2011, 16-17UTC: an example for the relationship between WWLLN based thunderstorms (blue), and cold (T < 234 K) cloud clusters (yellow). The overlap between them is shown in light blue.
Download figure:
Standard image High-resolution image3. Results
In order to perform a diurnal estimation, thunderstorm clusters were calculated globally for every hour during these six years. Figure 3 shows a global map of the thunderstorm clusters (only those larger than 1° × 1°) for the spring and autumnal equinoxes of 2012. The color represents the universal time of the clusters during the day, showing the progression of thunderstorm activity around the globe. The thunderstorm activity peaks around 08UTC in Asia, around 14UTC in Africa, and around 20UTC in the Americas.
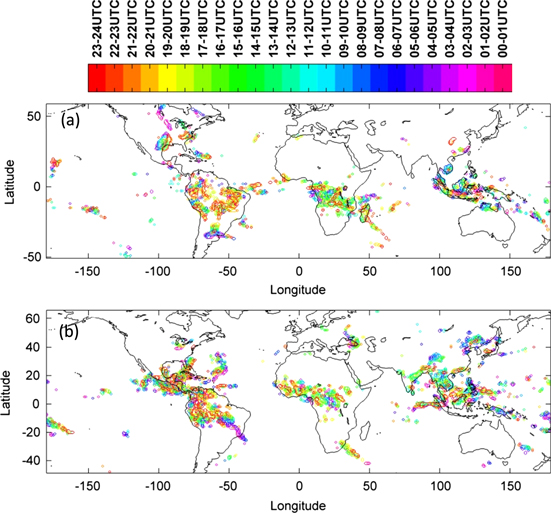
Figure 3. Diurnal map (color coded by global time) of intense (minimum cluster size of 1° × 1° and minimum of 10 lightning strikes per hour) global thunderstorm clusters: (a) 20/03/2012, (b) 22/09/2012.
Download figure:
Standard image High-resolution imageAfter analyzing more than 60 million clusters for the 7 year period, it was possible to produce an annual mean diurnal curve of the lightning detections and the cluster detections (figure 4).
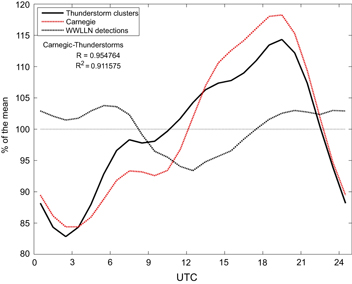
Figure 4. The diurnal variability in Earth's electric field at the surface (Carnegie Curve, dashed red), stroke density as detected by the WWLLN (dashed black), and calculated thunderstorm clusters (bold black).
Download figure:
Standard image High-resolution imageThere are three parameters to take into consideration while comparing the diurnal variation in the number of thunderstorms with the Carnegie Curve: the peak-to-peak variation, the time of minimum and maximum and the calculated correlation coefficient. Since the original Carnegie measurements between 1914 and 1929, there have been several versions of the Carnegie Curve. We choose to use the most recent estimation by Harrison (2013) taking into account 82 undisturbed fair weather days. We find (figure 4) that while there is no foreseeable agreement between WWLLN's stroke density (dashed black line) and the Carnegie Curve (dashed red line), the 7 year annual mean diurnal variation in the calculated number of thunderstorms (full black line) closely resembles the Carnegie Curve. It matches in overall structure, with a peak-to-peak variation of a little more than 30% from min to max. Furthermore, there is a good agreement in the time of minimal (03UTC) and maximal (19UTC) activity, with the thunderstorms slightly (less than 30 min) proceeding the Carnegie Curve. The relationship between the two curves was further investigated by calculating the highly significant linear correlation coefficients: R = 0.95, R2 = 0.91. The three local maxima described by Whipple (1929) can also be observed in the thunderstorm cell curve, resulting from late afternoon thunderstorm activity in Asia (08UTC), Africa (14UTC) and the Americas (19UTC). Once again we need to note that we are missing many of the smaller weaker thunderstorms (see figure S1) and our working assumption is that these missed storms would have a similar spatial and temporal distribution as the larger detected clusters. However, if this assumption is incorrect and there is a different diurnal cycle for the weaker missed storms, this would impact the agreement between the Carnegie Curve and the real total number of thunderstorms.
Next, the thunderstorm variation was separated according to land and ocean contributions (figure 5). It is evident that over land (green line) there is a significant correlation (R = 0.96, R2 = 0.93) between the diurnal variation of continental thunderstorms and the Carnegie Curve. Additionally the time of minimum and maximum land activity is in agreement with the Carnegie Curve.
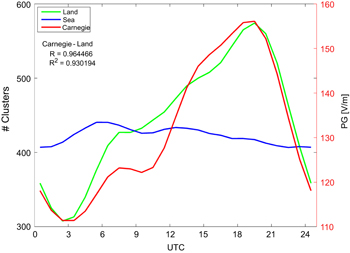
Figure 5. The diurnal variability in Earth's electric field at the surface (Carnegie Curve, red), calculated thunderstorm clusters over land (green), and over sea (blue).
Download figure:
Standard image High-resolution imageMaritime thunderstorms (figure 5, blue line) display a much smaller variation about the mean in relation to the Carnegie Curve and the continental thunderstorms. This flat diurnal response of ocean storms was also assumed by Whipple (1929). Oceanic storms have about a 5% variation about the mean, with maximum activity at 05UTC. The maximum activity is likely reflecting central Pacific thunderstorms. However, while oceanic thunderstorms produce only 10% of global lightning (Christian et al 2003) ocean thunderstorms make up around 50% of the total global number of thunderstorms. In addition, from 00UTC to 09UTC the globe is dominated by oceanic thunderstorms. This is in agreement with Blakeslee et al (2014) and Hutchins et al (2014).
In terms of absolute numbers, the average number of global storms occurring at any given moment over land is 447 and over ocean is 423. However, the global number of thunderstorm cells has increased from 2006 to 2012, as more WWLLN sensors were deployed (see supplementary figure S1). For the most recent year of analysis (2012) around 1050 cells were detected, varying from around 840 storms at 03UTC to 1150 storms at 19UTC. Of this, 532 are continental storms, while 518 are oceanic storms. This number is a lower bound that likely will be significantly increased in the future as more stations are added to the WWLLN network. For comparison, Mach et al (2011) found 61% of all storms providing current to the GEC occur over the continents, with 39% over the oceans.
For true comparison with the Carnegie Curve, the clusters need to be converted to currents flowing in the GEC. To estimate the current generated in the global circuit from these storms, we use the statistics of current per storm from Mach et al (2011), and Blakeslee et al (2014). However, in our study we consider all storms as thunderstorms. From Mach et al (2011), thunderstorms make up 77% of land storms with an average current output of 1 A each, while ESCs represent 23% of the land contribution with an average current output of 0.13 A. Ocean thunderstorms represent 42% of the ocean contributions with an average current output of 1.7 A, while ESCs provide 58% of the ocean contribution with a mean current of 0.41 A. This yields a mean current for land storms of (1 A × 0.77 + 0.13 A × 0.23) = 0.80 A, while ocean storms have (1.7 A × 0.42 + 0.41 A × 0.58) = 0.95 A. Using these two numbers in figure 5 we get figure 6 showing the storm-generated currents in the global circuit. Our calculations estimate a total current of about 358 A over land, and 402 A over ocean, and globally around 760 A. If we would use only 2012 for the estimate of the global currents (see figure S1), the value would be 918 A.

Figure 6. The diurnal variability in Earth's electric field at the surface (Carnegie Curve, red), together with the estimated diurnal variability of the currents in the GEC based on the thunderstorm clusters (black).
Download figure:
Standard image High-resolution image
4. Discussion
The diurnal variation of global thunderstorm activity shows a wide maximum during the time period between 14UTC and 20UTC, and a minimum at 03UTC (in agreement with Whipple (1929)). These variations reflect maximum thunderstorm activity in Asia–Australia, Africa–Europe, and the Americas (Price 1993). The maximum variation in the number of thunderstorms occurs at 19UTC, concurring with the Carnegie Curve peak. Though global satellite observations had shown maximum flash rate above Africa, which peaks at about 14UTC, in agreement with Williams et al (2000), the variation in the number of storms plays a more significant role than the variations in lightning activity in the GEC. Why does the global lightning activity peak around 14UT (peak activity in Africa) while the global thunderstorm clusters and GEC currents peak around 19UT (peak activity in South America)? This is a fundamental question that still needs answering. However, the difference lies in the nature and development of thunderstorm cells (the generators) and the nature and development of the lightning discharges within these generators. While lightning is maximum during the mature phase of thunderstorms, the lifetime of the thunderstorm cell and charged layers in the storm can be much longer, with the cumulonimbus cloud decaying hours after the peak lightning activity. But perhaps more important is how the conduction currents above cumulonimbus clouds vary as a function of lightning activity. Mach et al (2011) have shown that the total lightning activity in storms is not strongly related to the total currents flowing upwards above storms. In fact, storms with few lightning had similar conduction currents to very active storms. Could the African storms be less frequent, or have smaller areas than South American storms, while having larger lightning frequencies? This would give Africa the lead on lightning activity, but South America would win on currents generated into the GEC. More research is needed on this interesting topic. This discussion is also related to the difference in phase between the Carnegie Curve and the global Schumann resonance curves (Price and Melnikov 2004).
There are two fundamental ideas that explain the global variability in diurnal thunderstorm activity. The radiative hypothesis attributes thunderstorm response to the diurnal passage of the Sun and the asymmetric ocean–land structure (Williams and Stanfill 2002, Williams et al 2002, Siingh et al 2011). The aerosol hypothesis sets two different regimes: clean oceanic and polluted continental. According to the aerosol hypothesis maritime clouds experience active coalescence and rain out in the warm portion of the cloud, with hardly any electrification. On the other hand, 'dirty' clouds start out with diffusional droplet growth of many too-small-to-rain droplets, but end up reaching the mixed phase region and catalyze charge separation as ice particles (Williams et al 2002, Williams and Stanfill 2002, Williams 2005, Bell et al 2009, Stevens and Feingold 2009). It is likely that both processes play a role in determining the spatial and temporal variability of tropical thunderstorms.
The findings in this paper reaffirm WWLLN's ability to detect lightning producing thunderstorms (Abreu et al 2010, Hutchins et al 2012), since with only about 10% lightning detection efficiency, a good match is found between the calculated thunderstorm clusters, thunderstorm currents and the Carnegie Curve. Even though our findings of the absolute number of thunderstorms is less than previously estimated (Brooks 1925, Gish and Wait 1950, Mach et al 2011, Blakeslee et al 2014), it is more than that found by Hutchins et al (2014), and it is clear that the absolute number presented here is a lower bound estimation. This is due to the fact that the number of storms is sensitive to the number of sensors in the network, which has not yet reached saturation (see supplemental material).
These results are similar to those of Liu et al (2010), Mach et al (2011), and Blakeslee et al (2014), except for the definition of ESCs. ESCs are defined as electrified clouds with no lightning. Such clouds can also drive currents in the global circuit if their fields are large enough, and they may have a significant global coverage. In these previous studies, due to the limited sampling time of storms (1–2 min) any storm with no lightning during 1–2 min was labeled an ESC. However, it is well known that weaker thunderstorms around the globe may not have such a high lightning frequency, and observing a storm for longer periods may result in detecting a few individual flashes. Any storm with lightning (even 1 flash per hour) is by definition a thunderstorm. Hence, in our analysis of storm clusters integrated over a 60 min period, storms with even one WWLLN flash are regarded as a thunderstorm with lightning, and not an ESC. Hence, in this study we do not separate ESCs and thunderstorms, and regard all clusters with lightning as thunderstorms. However, we do separate land and ocean storms. We should point out that the historic Carnegie Curve also has its own intrinsic variability (Harrison 2013), and we do not expect our curves from 2006 to 2012 to agree perfectly with data obtained in the 1920s.
As mentioned earlier, the propagation of VLF waves in the atmosphere is strongly influenced by the ionospheric characteristics during day and night. Could this impact the diurnal variations of the clusters? It is very likely that the lightning detection is influenced by the day and night variability of the EIWG. However, when integrating over one hour of data, we will often detect at least one WWLLN flash if a thunderstorm exists. Since we are not counting the number of flashes, as long as the WWLLN network detects a single flash per grid box, we will register the thunderstorm. Hence, we do not suspect that our diurnal variation in thunderstorm clusters is influenced significantly by the day–night changes in the waveguide. This was investigated by Jacobson et al (2006) where they compared the thunderstorm detection of WWLLN against the LASA lightning network in the Southwest United States. However, that study was for larger thunderstorms, and it is possible that many smaller weaker thunderstorms will be missed by our clustering algorithm. If this is so, will these smaller missed clusters impact the diurnal variations of the global currents, or do they have the same diurnal phase as the larger detected storms? Will there be a regional bias in detecting the smaller clusters due to the uneven distribution of the WWLLN sensors, with us missing more small storms in Africa than Asia? How are these missed storms distributed between land and ocean, even though it appears ocean storms show larger peak currents (Fullekrug et al 2002, Virts et al 2013, Said et al 2013), and hence may be easier to detect from the same distance? More research is needed on these topics.
5. Conclusions
In this study we have shown that it is possible to use global lightning detection networks, with relatively low detection efficiencies, to determine the location, time and variability of global thunderstorm cells. We have developed a methodology of using lightning data in a clustering scheme to determine the number of global thunderstorms as a function of time and space. We have verified our methodology by comparing the diurnal variability of our thunderstorm cells with the well accepted Carnegie Curve that represents the diurnal variations of the GEC.
Our results show that thunderstorms alone (with lightning) can explain more than 90% of the variability in the GEC. The variations in the number of thunderstorms (and currents) on the diurnal cycle is ∼30% peak-to-peak, similar to the Carnegie Curve (∼35%). We find that little more than 50% of the storms occur over the continents, while little less than 50% of the storms occur over the oceans. Our results also show that during a significant portion of the day (9 h continuously) there are more thunderstorms over the oceans than over the land areas. It is possible that electrified non-thunderstorms (not detected by WWLLN) have a different diurnal cycle to the Carnegie Curve (Liu et al 2010), and may therefore impact the diurnal variability of the GEC differently to the thunderstorms. However, we have no way to detect globally the ESCs at this moment. But given the estimated global currents calculated using the thunderstorm clusters alone, we have shown that the thunderstorms (with lightning) are the dominant driver of the GEC, as others have also shown (Mach et al 2011, Blakeslee et al 2014).
Thunderstorm cells are related to many extreme weather events such as hurricanes, flash floods and wild fires, and as the WWLLN aims to provide real-time analysis, thunderstorm clusters may be used for nowcasting such events (Kohn et al 2011). Such a warning system would especially prove useful in areas where there are no advanced lightning location networks, radars and no other advanced meteorological measurements (Price 2008, 2013). Nowcasts that utilize the thunderstorm cell data could help save lives by early detection of flash floods in remote regions of the globe.
Acknowledgments
The authors wish to thank the World Wide Lightning Location Network (http://wwlln.net), a collaboration among over 50 universities and institutions for providing lightning location data used in this paper.