
Abstract
This letter presents a summary of a phenomenological study of the response of the polar stratosphere to strong solar energetic particle (SEP) events corresponding to ground level enhancements (GLEs) of cosmic rays. This work is focused on evaluation of the possible influence of the atmospheric ionization caused by SEPs upon formation of aerosol particles in the stratosphere over polar regions. Following case studies of two major SEP/GLE events, in January 2005 and September 1989, and their possible effects on polar stratospheric aerosols, we present here the results of an analysis of variations of the daily profiles of the stratospheric aerosol parameters (aerosol extinction for different wavelengths, as well as Ångstrom exponent) for both polar hemispheres during SEP/GLE events of July 2000, April 2001 and October 2003, which form already five clear cases corresponding to extreme and strong SEP/GLE events. The obtained results suggest that an enhancement of ionization rate by a factor of about two in the polar region with night/cold/winter conditions can lead to the formation/growing of aerosol particles in the altitude range of 10–25 km. We also present a summary of the investigated effects based on the phenomenological study of the atmospheric application of extreme SEP events.
Export citation and abstract BibTeX RIS

Content from this work may be used under the terms of the Creative Commons Attribution 3.0 licence. Any further distribution of this work must maintain attribution to the author(s) and the title of the work, journal citation and DOI.
1. Introduction
Possible indirect effects of solar variability on climate are quite poorly understood (see a recent review by Gray et al (2010)) which leaves room for intensive debate and speculation. One of the least understood mechanisms is related to energetic particles and their atmospheric effects (Carslaw et al 2002, Bazilevskaya et al 2008, Usoskin and Kovaltsov 2008). This effect is highly debated. The proposed theoretical mechanisms for such an effect still remain illusive and qualitative, with two main mechanisms proposed to explain the possible influence of energetic particles on atmospheric aerosols and clouds: the ion induced/mediated nucleation of cloud condensation nuclei (Kazil et al 2008, Yu 2010), and the effect of the vertical electric current (Tinsley 2008, Harrison and Ambaum 2013). On the other hand, observational evidence is inconclusive and controversial. For example, direct in situ (Kulmala et al 2010) and in vitro (Kirkby et al 2011) experiments suggest no directly observable effect in tropospheric conditions. Direct statistical studies are highly controversial, claiming the global effect (Svensmark et al 2009), or disproving (Erlykin et al 2009, Calogovic et al 2010) or limiting it to a regional scale (Voiculescu et al 2006, Voiculescu and Usoskin 2012). Therefore, important questions regarding firstly the very existence and secondly the magnitude of the effect, and particularly the fraction of aerosol particles affected, are still open. Here we present an empirical case study of the possible effect caused by cosmic rays upon polar stratospheric aerosols, based on a case study of strong solar energetic particle (SEP) events. SEP events provide a good opportunity to study the possible effect of energetic particles on atmospheric aerosols, because they provide a nearly instantaneous injection of energetic particles into the polar atmosphere. This is an extension and summary of a series of previous studies of isolated SEP events (Mironova et al 2008, 2012, 2013), which suggested a weak effect observable only in the polar winter stratosphere.
The result of this study sheds new light on possible physical mechanisms for natural variations of the polar aerosol content and can be an important indirect link relating solar variability to climate.
2. Effects of energetic particles on the low and middle atmosphere
The main source of ionization of the ambient air in the Earth atmosphere below approximately 50 km is cosmic rays. Cosmic rays (CRs) are highly energetic charged particles (mostly protons) with energies from about 107 up to 1020 eV (Dorman 2004) coming to the Earth atmosphere from outer space. High energy particles originate mostly from outside the solar system and are called galactic cosmic rays (GCRs). The high energy of such particles allows them to produce, in the Earth atmosphere, secondary particles through collisions with atomic nuclei in air, leading to a nuclear–electromagnetic cascade in the atmosphere. This leads to ionization of the ambient air with the maximum of ionization at an altitude of 12–15 km, called the Pfotzer maximum (Usoskin and Kovaltsov 2006, Usoskin et al 2010). Another source of energetic protons which also play a role in additional ionization of the Earth atmosphere can be traced to the Sun. During sporadic events, solar energetic particles (SEPs) can be produced in such eruptive solar processes as solar flares and coronal mass ejections. A special class of SEP events is called ground level enhancement (GLE) where an essential addition to GCRs can be observed even at the ground level, implying high energy of SEPs (about 1 GeV) sufficient to initiate atmospheric cascade. A GLE event is typically identified as an increase of count rate of neutron monitors. On the other hand, an increasing level of ionization appears in the lower layers of the atmosphere, especially in the polar region. For the strongest GLE events, an increase of the atmospheric ionization rate by orders of magnitude is expected in the polar stratosphere (Usoskin et al 2011). Here we focus on case studies of such events, considering their effect on the properties of the polar atmosphere.
It is important to notice that the maximum of the atmospheric ionization appears in the polar stratosphere. A typical ion pair production rate by GCRs in this region is about 15 × 104 g−1s−1, but it can vary with the intensity of cosmic ray flux. During strong SEP/GLE events atmospheric ionization can increase essentially in this region for hours–days due to the effect of SEPs. However, such events often appear together with so-called Forbush decreases, namely reduction of GCR flux for days–weeks, due to propagating interplanetary disturbances, leading to decreased ionization. Thus, the two effects may partly compensate each other, but their ratio depends on the location as well as on the parameters of the SEP event. As analyzed by Usoskin et al (2011), the only region of the atmosphere where the increase of SEP-induced ionization may significantly exceed the negative effect of Forbush decreases is the polar stratosphere. In order to clarify the effect of strong GLEs we consider here the nine strongest GLE events recorded during solar cycles 22 and 23, as presented in table 1 and compare the ionization effects of these events with the normal undisturbed ionization rate in the atmosphere.
Table 1. Computed ionization effect of GLE events, ordered according to the magnitude I100 of the cosmic ray induced ionization (CRII) due to SEPs at an atmospheric depth of 100 g cm−2 (modified after Usoskin et al (2011)). At an atmospheric depth of 300 g cm−2 the effect in most cases is suppressed by the accompanying Forbush decrease. The formal GLE number, the date, and the strength (maximum 5 min increase in % of NM count rate) are given in the first three columns. Daily mean ionization due to SEPs at atmospheric depths of 100 and 300 g cm−2 is given in units of 104 g−1 s−1 as I100 and I300, respectively. Relative CRII effects c (see Usoskin et al (2011) for definition) at 100 and 300 g cm−2 atmospheric depths are also shown. All values are given for the polar atmosphere.
| Date | GLE No. | NM increase | I100 | I300 | c100 | c300 |
|---|---|---|---|---|---|---|
| 29 September 1989 | 42 | 404 | 84.7 | 5.81 | 653 | 125 |
| 24 October 1989 | 45 | 162 | 60 | 3.47 | 479 | 67 |
| 19 October 1989 | 43 | 92 | 59.9 | 3.16 | 448 | 68 |
| 20 January 2005 | 69 | 5400 | 51.8 | 2.92 | 285 | 35 |
| 14 July 2000 | 59 | 59 | 23.8 | 1.36 | 168 | 20 |
| 15 April 2001 | 60 | 237 | 20.4 | 1.16 | 130 | 16 |
| 22 October 1989 | 44 | 193 | 19.7 | 1.13 | 140 | 9 |
| 29 October 2003 | 66 | 35 | 12.8 | 0.71 | 53 | −11 |
| 28 October 2003 | 65 | 47 | 9.67 | 0.557 | 57 | 8 |
Table 1 includes the GLE events of July 2000, April 2001 and October 2003 analyzed here as well as the GLEs of September 1989 and January 2005 analyzed earlier (Usoskin et al 2011, Mironova et al 2008, 2012, 2013).
The ionization effect of the GLE of 20 January 2005 was analyzed in great detail by Usoskin et al (2011). During the event the additional ion production rate was about 50 × 104 g−1 s−1 at an atmospheric depth of 100 g cm−2 (height about 16 km), while the background cosmic rays induced ionization (CRII) due to GCRs was about 20 × 104 g−1 s−1 in the same polar altitude range during the studied period of time. This implies a factor of 2.5 enhancement in the ionization rate at that height due to SEPs with respect to the background ionization level due to GCRs in the same altitude range. This led to a relative enhancement of CRII, at altitude higher than 15 km, of 285% due to the GLE event compared to the normal level, see table 1. The effect of this GLE in the upper troposphere (9 km height or 300 g cm−2) was suppressed but still visible, see table 1. The effect of this GLE on the polar stratospheric aerosol was analyzed by Mironova et al (2008, 2012).
A series of consequent GLEs during September–October 1989 also led to enhanced numbers of ion pairs produced in the polar stratosphere. During the GLE of 29 September 1989 the ionization rate in the polar atmosphere at 100 g cm−2 (16 km) was computed as about 85 × 104 g−1 s−1, while the background CRII by GCRs at the same altitudes during the period under investigation was just about 13 × 104 g−1 s−1. This implies a factor of eight enhancement in the ionization rate at that height due to SEPs with respect to the background ionization level due to GCRs in the same altitude range. The relative enhancement at an altitude of about 100 g cm−2 exceeded 400% for SEP events during October 1989 and 600% during September 1989, see table 1. The ionization effects in the upper troposphere at 9 km were also somewhat suppressed but still noticeable, see table 1. The effect of these GLEs on the polar stratospheric aerosol was studied by Mironova et al (2013).
During the GLE of 14 July 2000 (a.k.a. the Bastille day event) the additional ionization at an altitude of 100 g cm−2 due to SEPs was about 25 × 104 g−1 s−1, while the background ionization level during July 2000 was about 15 × 104 g−1 s−1. Therefore, the relative ionization effect was smaller than in the previous cases, less than a factor of two, but still essential, see table 1.
For the GLE of 15 April 2001 both the level of ionization and the background ionization were similar to those for the GLE of 14 July 2000. Thus, the ionization effect of this GLE is similar to that of the GLE of July 2000.
On the other hand, the series of GLEs of 28–29 October 2003 (a.k.a. the Halloween event) was quite different from the other GLEs analyzed here. The ionization effect for these GLEs was suppressed, at an altitude of 100 g cm−2, by Forbush decreases of GCRs (Usoskin et al 2011), see table 1. The background level of ionization during October 2003 was about 20 × 104 g−1 s−1. The additional ionization due to SEPs was about 10 × 104 g−1 s−1, namely less than the normal ionization rate during this month at an altitude of 100 g cm−2.
It is important to notice that we limit our investigation to consideration of the strongest GLEs. We separately consider the GLEs of 14 July 2000 and 15 April 2001 and for comparison take the GLEs of 28–29 October 2003, where the ionization effect of the GLEs was suppressed compared with the level of ionization by GCRs. Other GLEs (Usoskin et al 2011) were weaker and their expected atmospheric effect is also smaller. Here we analyze and summarize the effect of these GLEs on the polar stratospheric aerosol.
3. Remote sensing of the atmospheric aerosol content during GLE events
For our analysis of the atmospheric effects of GLEs we use the POAM III data which makes it possible to compare data sets for both northern and southern polar stratospheres during the period of time under investigation. The POAM III instrument was developed by the Naval Research Laboratory for measurements of the vertical distribution of atmospheric ozone, water vapor, nitrogen dioxide and aerosol extinction in the polar stratosphere. This instrument uses the solar occultation technique to measure atmospheric transmission along the line of sight between the spacecraft and the Sun that passes through the atmospheric layers. POAM III was launched in March 1998 and stopped its operation in December 2005 (http://wvms.nrl.navy.mil/POAM/). The data cover the southern polar hemisphere at the spacecraft's sunset and the northern polar hemisphere at the spacecraft's sunrise. The latitude of the observations repeatedly varies slowly with time with an approximately semi-annual period.
POAM III measured solar extinction in nine channels, covering the spectral range from approximately 350 to 1020 nm. From the collected data it is possible to retrieve profiles of O3, NO2 and H2O concentration, as well as wavelength-dependent aerosol extinction. In our investigation we use data from the POAM III retrieval technique version 4 (https://eosweb.larc.nasa.gov/). These data include vertical profiles of aerosols and trace constituents in the polar atmosphere such as the ozone concentration in the range of about 10–60 km, nitrogen dioxide concentration for 20–40 km, aerosol extinction at six wavelengths (353, 442.2, 603, 779, 922.4 and 1018 nm) for 5–25 km and water vapor for 5–45 km. All the measured profiles have a vertical resolution of 1–2 km (Lumpe et al 2002, Randall et al 2001). The profiles of temperature, pressure and potential vorticity, for the altitude range 0–60 km, are adopted from the UK Met Office (UKMO—www.metoffice.gov.uk/). These profiles are interpolated to the given location and time of the POAM III measurements.
4. Variations of the aerosol properties during July 2000
As mentioned above, the POAM III satellite covered both polar regions during July 2000. For the northern hemisphere POAM III data were obtained in the latitude band 54°N–57°N, whereas for the southern hemisphere between 65°S and 71°S. Let us first analyze the southern hemisphere data set, where it was polar night with the absence of solar UV radiation. In contrast, the northern hemisphere was in summer, where solar UV radiation is present even in polar regions during this period.
4.1. Southern polar region
One of the parameters of the middle atmosphere that can be affected by cosmic ray ionization is related to the aerosol particles (Arnold 2006, Kazil et al 2008, Pierce and Adams 2009, Snow-Kropla et al 2011). Aerosol production by ion-induced nucleation in the polar atmosphere can be limited by the concentration of small ions or condensible vapor. Therefore the enhanced ion production rates associated with a GLE event can enhance the rate of formation/nucleation of new and/or already present particles in the polar lower stratosphere (Mironova et al 2008, 2012, 2013). Let us consider the profiles of aerosol extinction for wavelengths 353, 603 and 1018 nm during the period under investigation, as presented in figure 1. Figure 1 shows daily and altitudinal variations of the aerosol extinction during July 2000. Color bars present variation of aerosol extinction for different wavelengths. Here one can see an increase of aerosol extinction in various wavelengths just after 14 July 2000 in altitudinal ranges from 18 to 25 km. The increase is more apparent in the aerosol extinction at 353 nm and less so at 1018 nm. This suggests that an aerosol layer had been formed after 14 July, likely as a result of the increasing rate of cosmic ray induced ionization rate in the polar regions during the GLE on the same day. A more detailed analysis of the aerosol variation based on investigation of the Ångstrom exponent calculated for all six wavelengths of the POAM III dataset is shown in the upper panel of figure 2. The Ångstrom exponent (α) corresponds to the log–log slope of the aerosol extinction as a function of wavelength. Here we calculated the best-fit value of α using all six wavelength channels of POAM III. Because of noisy extinctions in each channel, the Ångstrom exponent calculated for only a pair of aerosol extinctions is unstable. The use of the weighted fitting produces a robust and stable value which is not much affected by uncertainties in the individual channels. It reflects the size distribution of the scattering particles, so that larger α corresponds to smaller particles and vice versa. For example, cloud droplets have large sizes and thus would yield α values of about zero. In the framework of the standard idealistic Mie theory, some estimates on the particle size can be made. However, here we consider only possible qualitative changes in the features of the scattering particles, since any quantitative values depend on the underlying assumptions on unknown parameters.

Figure 1. Altitudinal and temporal variations of the aerosol extinction during July 2000 for the southern polar region. (a), (b), (c) Altitudinal profiles of aerosol extinction for wavelengths of 353 nm, 603 nm and 1018 nm, respectively.
Download figure:
Standard image High-resolution image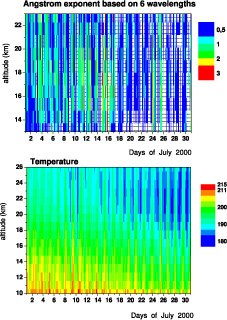
Figure 2. Altitudinal and temporal variations of Ångstrom exponent and temperature (K) over the southern polar region during July 2000. Upper panel: altitudinal and temporal variations of Ångstrom exponent based on six wavelengths (shaded areas indicate no data available). Lower panel: altitudinal and temporal variations of the temperature.
Download figure:
Standard image High-resolution imageAs addressed above, the upper panel of figure 2 corresponds to variations of the size of aerosol particles over July 2000. In the first part of the month, values of the Ångstrom exponent vary between roughly 1 and 2, indicating the presence of fine aerosol particles. A noticeable increase in the values of α from ≈ 1.5 to 3 is observed after 14 July 2000, corresponding to a sudden increase of the ion production rates in that region. This change began on 15 July 2000 and suggests that the effective size of scattering particles somewhat decreased. This can be interpreted as possible production (or growth from below the detection threshold) of ultrafine particles, probably along with simultaneous increase of the total aerosol mass. This feature was persistent for some days, and then an increase of the aerosol size is implied by the Ångstrom exponent dropping to ≈ 0. Such a low value of α indicates a sudden increase of the effective aerosol size up to several hundred nm or more (comparable to the wavelength range of the POAM III experiment), i.e. to the size of ice particles forming clouds at this height.
Here we also analyze variations of the meteorological conditions in the southern polar region during July 2000, which can be characterized as the middle polar winter. Altitudinal and temporal variability of the temperature is plotted in the lower panel of figure 2. One can see that the southern polar atmosphere was cold enough during July 2000. The temperature varied between 215 K and 180 K, depending on the altitude and time. At higher altitudes above 16 km, the temperature was quite stable at about 190 K with some decrease to 180 K mostly in the second half period of month. This change can explain a decrease in the aerosol Ångstrom exponent to ≈ 0 which would mean formation of polar stratospheric clouds, which are dependent on decrease of the temperature below 190 K.
On the other hand, computations of CRII rate, see table 1, suggest that the atmospheric ionization was greatly enhanced during the day of 14 July 2000 in the stratosphere of the polar region, covered by the POAM III data. In particular, the CRII rate was nearly doubled during that day at altitudes higher 16 km, where the aerosol extinction changes were observed.
4.2. Northern polar region
As mentioned above, the POAM III satellite covered both polar regions during April 2000. POAM III sunrise data sets were obtained in the latitude band from 54°N to 57°N. July is the middle of the local summer in the northern hemisphere, were solar radiation is present during this period of time.
The results of analyzed POAM III data over the northern polar region are presented in figure 3. The upper panels of the figure show daily and altitudinal variations of the aerosol extinction at two wavelengths of 353 nm and 1018 nm. The lower panels show variations of the Ångstrom exponent and temperature during July 2000. Color bars show the changes of investigated parameters. Here one can see greater variability of the aerosol extinctions at both wavelengths and the Ångstrom exponent during all days of July 2000 in comparison with the southern hemisphere. On the other hand, the temperature was higher here, varying between 212 and 236 K, compared to the winter southern polar stratosphere. Therefore the atmospheric conditions were quite different in the two hemispheres.

Figure 3. Altitudinal and temporal variation of aerosol extinction, Ångstrom exponent and temperature (K) during July 2000 over the northern polar region. Upper panels: aerosol extinction at wavelengths of 353 and 1018 nm. Lower panels: Ångstrom exponent and temperature.
Download figure:
Standard image High-resolution imageIt is worth mentioning that there is no clear signature of the GLE event of 14 July 2000 here. No notable changes are connected to the GLE event, in contrast to the southern hemisphere. However, the temperature is much higher here than that observed in the southern hemisphere. Moreover, the presence of solar UV could also smear out an event picture.
5. Variations of aerosol properties during April 2001
The next interesting period is April 2001. Here we can compare the responses of the polar stratospheric parameters for the GLEs of 15 April 2001 and 14 July 2000. As mentioned above, these GLEs were quite similar to each other in the sense of ionization. During the GLE of 15 April 2001, the additional ionization due to SEPs was 20 × 104 g−1 s−1, and the relative effect was smaller than that for the GLE of 14 July 2000, but still high, see table 1. The background level of ionization during April 2001 was about 15 × 104 g−1 s−1. Thus, the relative enhancement of ionization in that region was by a factor of less than two. However, the occurrence of a GLE in a different season (mid-spring/fall) can help in disentangling different effects (SEP versus UVI and local meteorology).
Sunrise POAM III data sets during April 2001 were obtained in the latitude band 61°N–65°N, whereas sunset data were taken between 74°S and 85°S.
Figure 4 shows daily and altitudinal variations of the temperature and Ångstrom exponent, based on all six wavelength channels of POAM III, during April 2001. The color bars present variations of the investigated parameters. One can see here that the temperature in the southern polar region was gradually decreasing throughout the month of April. In the northern polar region the situation is roughly the opposite, with the temperature gradually increasing. All these changes are related to the seasonal effect and increase/decrease of UV in the polar hemispheres. However in both cases the temperature was high, above 195 K. The Ångstrom exponent during April 2001 was also varying essentially (from 0 to 4) with no apparent changes connected with the GLE of 15 April 2001.
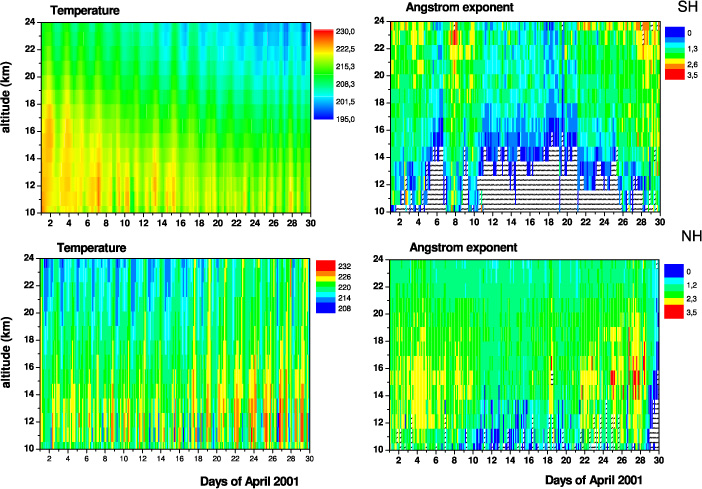
Figure 4. Altitudinal and temporal variations of Ångstrom exponent and temperature (K) during April 2001. The upper/lower panels show the temperature and Ångstrom exponent over the southern/northern polar regions, respectively.
Download figure:
Standard image High-resolution image6. Variations of aerosol properties during October 2003
During October 2003 two GLEs were detected, see table 1. Because of their proximity in the time domain, we will study them as a single event. The GLE of 28–29 October 2003 was quite different from the other GLEs studied here. The additional ionization due to SEPs at 100 g cm−2 was smaller than the background ionization by GCRs in October–November 2003. We note that it occurred at the Borealic fall (Australic spring), and an analysis of the aerosol content during that period is interesting to compare with other seasons. Moreover, since the event was weaker than the other GLEs analyzed we would like to check whether this affects the results. Since the event took place near the turn of two months, we analyze the period of 15 October to 17 November here, rather than a calendar month.
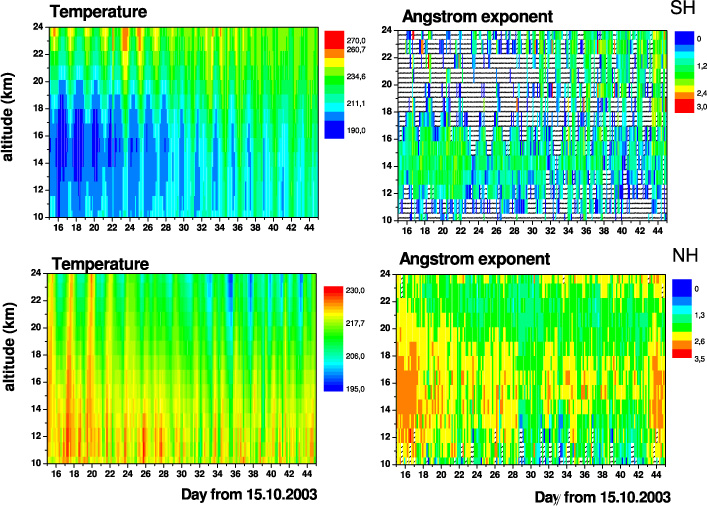
Sunrise POAM III data sets from 15 October to 17 November 2003 were obtained in a latitude band from 64°N to 70°N, whereas sunset data were taken between 65°S and 80°S. Figure 5 shows daily and altitudinal variations of the temperature and Ångstrom exponent, based on all six wavelength channels of POAM III, during the month beginning on 15 October 2003. The color bars present variations of the investigated parameters. One can see in figure 5 that the temperature in the southern polar region at an altitude about 16 km was decreasing down to 190 K from 16 October to 22 October. During the days of 28–29 October the temperature was about 200 K, which is too high for formation of polar stratospheric clouds. In the northern polar hemisphere the temperature was even higher in the same altitude range, about 215–220 K during all the investigated period of time. The Ångstrom exponent during October–November 2003 was also varying essentially (from 0 to 4), but with no visible changes connected with the GLEs of 28–29 October 2003, see figure 5.
Figure 5. Altitudinal and temporal variations of Ångstrom exponent and temperature (K) during the month from 15 October 2003. Upper/lower panel: temperature and Ångstrom exponent over the southern/northern polar regions, respectively.
Download figure:
Standard image High-resolution image
7. Summary and conclusion
Here, we summarize the results of empirical studies of several strong GLE events and their possible effect on the polar aerosol content.
The homogeneous data set of aerosol parameters in the polar stratosphere, provided by POAM III, gives a unique possibility to analyze the responses of the profiles of aerosol content during the strong GLEs of July 2000 and April 2001, as well as the GLE of October 2003.
In agreement with our earlier findings (Mironova et al 2012, 2013), we report a minor possible effect related to additional ionization during the strong GLE event in July 2000. The maximum response of the Ångstrom exponent was observed one day after the GLE of 14 July 2000 in the altitude range of about 100 g cm−2 (about 16 km height). The observed decrease of the Ångstrom exponent implies that, shortly after the GLE, new particle formation and/or growth of preexisting ultrafine aerosol particles took place. The effect was observed only in the southern polar stratosphere, during the local winter, with the temperature sufficiently low to allow formation of polar stratospheric clouds. No effect was observed in the northern hemisphere (local summer) with high stratospheric temperatures.
No effect was found for the weaker events of April 2001 and October 2003 that took place during the spring/fall seasons. It is worth mentioning that the polar stratospheric temperature was above the polar stratospheric cloud formation threshold during these events.
As a summary of the phenomenological study of the atmospheric response of the behavior of aerosol particles to strong SEP events, which includes both the results presented here and in earlier studies (Mironova et al 2008, 2012), we propose that noticeable changes in aerosol content, as a response to enhanced ionization in the polar lower stratosphere (15–20 km height), can be observed only during the polar night, under winter cold conditions, in regions where the ambient temperature is below the threshold (about 190 K) for polar stratospheric cloud formation. No effect was found if the temperature was above the threshold. In order to make sure that the observed phenomenon is not a typical mid-winter/summer stratospheric effect due to, e.g. a change in insolation of the polar atmosphere or stratospheric nighttime chemistry related to UVI (Enghoff et al 2012), we have checked the period of mid-summer/winter (January and July) for other years (1998–2003) using POAM data (Mironova et al 2012, Randall 2010) and found no similar phenomena outside the periods of GLE events.
Thus, we conclude that a combination of at least two factors can lead to an observable enhancement of stratospheric aerosols: (1) an essential, at least by a factor of about two, increase of the ionization rate in the region, and (2) winter season without UV and with low temperature sufficient for formation of polar stratospheric clouds. We note that the observed effect is small and limited to the polar stratosphere, even for extreme GLE events, and is unlikely to directly affect regional climate. On the other hand, it provides a clear case example to study possible mechanisms of outer space influence upon atmospheric properties.
Acknowledgments
The provision of the POAM III data by a public service of the United States Naval Research Laboratory (NRL) is acknowledged. Support from the Academy of Finland is gratefully acknowledged. IM is also supported by grant RFBR N13-05-01063. This work was performed in relation with the following international Programs: CAWSES-II and COST ES1005. We thank the anonymous referees for useful comments and suggestions that led to essential improvement of this letter.