Abstract
Wind power, a renewable energy source, can play an important role in electrical energy generation. Information regarding wind energy potential is important both for energy related modeling and for decision-making in the policy community. While wind speed datasets with high spatial and temporal resolution are often ultimately used for detailed planning, simpler assumptions are often used in analysis work. An accurate representation of the wind speed frequency distribution is needed in order to properly characterize wind energy potential. Using a power density method, this study estimated global variation in wind parameters as fitted to a Weibull density function using NCEP/climate forecast system reanalysis (CFSR) data over land areas. The Weibull distribution performs well in fitting the time series wind speed data at most locations according to R2, root mean square error, and power density error. The wind speed frequency distribution, as represented by the Weibull k parameter, exhibits a large amount of spatial variation, a regionally varying amount of seasonal variation, and relatively low decadal variation. We also analyzed the potential error in wind power estimation when a commonly assumed Rayleigh distribution (Weibull k = 2) is used. We find that the assumption of the same Weibull parameter across large regions can result in non-negligible errors. While large-scale wind speed data are often presented in the form of mean wind speeds, these results highlight the need to also provide information on the wind speed frequency distribution.
Export citation and abstract BibTeX RIS

Content from this work may be used under the terms of the Creative Commons Attribution 3.0 licence. Any further distribution of this work must maintain attribution to the author(s) and the title of the work, journal citation and DOI.
1. Introduction
Wind power, a renewable energy source, has the potential to reduce greenhouse gas emissions and local air pollutants associated with the burning of fossil fuels. The wind energy market is growing rapidly, with a capacity of roughly 1.8% of global electricity demand in 2009, and could exceed 20% by 2050 with ambitious efforts (Wiser et al 2011). It has been reported that wind energy can supply several times present world electricity consumption (Hoogwijk et al 2004, Archer and Jacobson 2005, Zhou et al 2012).
Accurate estimation of wind energy, especially for large areas, is important in both the science community for energy related modeling and the policy community for decision-making (Zhou et al 2012). Evaluating the wind energy potential over large areas involves large data sets and associated computational requirements. It is useful, therefore, to represent wind speed through probability density functions with a few key parameters. For example, Jowder (2006) compared the Weibull and Rayleigh functions in fitting the wind speed frequency distribution in Kingdom of Bahrain. As summarized by Carta et al (2009), a number of various probability density functions such as Weibull, gamma, lognormal, and Rayleigh have been used to represent wind frequency distribution (Kaminsky 1977, Mihelić-Bogdanić and Budin 1992, Lun and Lam 2000, Seguro and Lambert 2000, Tar 2008, Chellali et al 2012).
The Weibull distribution function has been widely used in the analysis of wind energy resources because of its good performance and few parameters (Kaminsky 1977, Lun and Lam 2000, Chellali et al 2012). A number of methods have been developed to estimate Weibull parameters (Seguro and Lambert 2000, Weisser 2003, Akdağ and Dinler 2009, Costa Rocha et al 2012, Saleh et al 2012). The maximum likelihood, graphic, moment, Chi-square, and regression methods are commonly used in fitting wind speed frequency distribution using the Weibull function (Seguro and Lambert 2000, Dorvlo 2002, Akdağ and Dinler 2009). The performance of these methods varies with study area, experiment, and evaluation rules (Akdağ and Dinler 2009). Akdağ and Dinler (2009) compared graphic, maximum likelihood, and moment methods, and proposed a new power density (PD) method, which we use below.
Although the frequency distribution of wind speed has been extensively studied in various regions, an improved understanding of its spatial variation at the global level is still lacking. As we will show below, the statistical properties of the global wind speed data, in addition to mean wind speed information, are also of importance for wind energy evaluation and development. As we verify below, wind speed variability can be usefully summarized in most areas by the parameters of a Weibull distribution. Such analysis will lead to better understanding of wind speed data and also help the comparison between different wind speed datasets, including reanalysis datasets such as those examined in this work. In this work, we estimate spatially explicit Weibull parameters over global land areas and investigate the reliability of these estimates, spatial and temporal trends, and implications for wind power estimates.
2. Method and data
2.1. Method
The Weibull function is widely used due to its simplicity and ability to closely mirror the distribution of observed wind speeds. The probability density function f(x;λ,k) of a Weibull random variable x is given by,

where k is the Weibull shape parameter, λ is the scale parameter. Physically, the scale parameter (λ) is proportional to the mean wind speed, while the shape parameter (k) determines the width of the distribution, with narrower speed distributions for higher k values.
The mean wind speed can be written as:

where  is the mean of wind speed, and Γ is the gamma function.
In this study, we chose the power density (PD) method developed by Akdağ and Dinler (2009) to estimate the Weibull parameters. They found that the PD method can produce accurate estimates of Weibull parameters with less computation, and we find this to be the case here, and it might be better than graphic, maximum likelihood, and moment methods (Akdağ and Dinler 2009). For application in wind energy studies, this method is also more suitable given its focus on wind power density. In addition, the Weibull parameters can be easily estimated if only power density and mean wind speed are known.
According to the PD method by Akdağ and Dinler (2009), the Weibull k parameter can be estimated as,

where Epf is the energy pattern factor. The energy pattern factor is based on the mean of wind speed cubed  and the cube of mean wind speed
  as below,

With the Weibull shape parameter (k) estimated from equation (3), the scale parameter (λ) can be determined from equation (2).
2.2. Wind speed data
Several types of wind speed datasets are available to evaluate global wind resources. These datasets are distinguished by differences in their methodology and spatial and temporal resolution (Wiser et al 2011, Zhou et al 2012). After evaluation of a number of global datasets, in this study we use 10 m wind speeds from the NCEP climate forecast system reanalysis (CFSR) (Saha et al 2010, Zhou et al 2012). While wind turbines operate at higher heights (Drechsel et al 2012), we use 10 m height wind speed because it is generally available from many datasets, allowing comparison. It is not clear, however, if the character of wind speed statistics would change with height, or if such changes would accurately be captured by reanalysis methodologies. This could be a topic of future work.
The CFSR reanalysis data has a spatial resolution of 0.3125° lat/lon and provides hourly values of wind speed for the time period from 1980 to 2009. The PD method is also useful for this large dataset because binning and solving linear least squares or iterative procedures are not necessary. Zhou et al (2012) identified some biases such as the underestimation of wind potential at wind class 5 and higher in this data set, however, and we return to this issue in the discussion.
3. Results
3.1. Global wind speed distribution
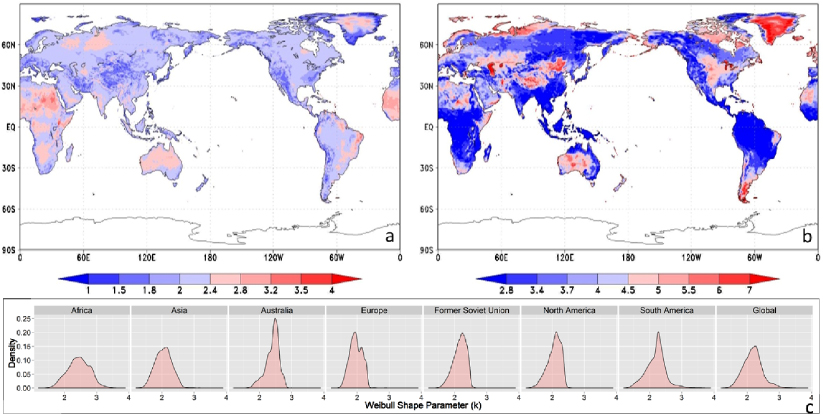
Wind speed frequency distribution, in terms of the Weibull shape parameter (k), shows large spatial heterogeneity at the global level (figure 1(a)). The value of the shape parameter is larger than 2 in large portion of global land area (figure 1(c)). It also varies across regions1 regarding magnitude and distribution (figure 1(c)). Regions of Africa and Australia generally show large shape parameter with a peak around values of 2.4, and Africa also shows largest regional variation (90% range of 1.9–3.0) within region. A large shape parameter indicates a narrower frequency distribution. Therefore, wind speeds in these areas, at least in this data set, are relatively stable compared to regions with a lower shape parameter. As a key parameter impacting wind energy estimation, this large spatial heterogeneity should be borne in mind when evaluating the wind energy using mean wind speed.
Figure 1. Weibull shape parameter k (a), scale parameter λ (b), and histogram of the Weibull shape parameter in seven regions and globally (c). A large shape parameter indicates a narrower distribution compared to a lower shape parameter.
Download figure:
Standard image High-resolution imageThe spatial variation of the Weibull scale parameter (λ) shows a pattern similar to the mean wind speed (figure 1(b)). The scale parameter is a function of the mean wind speed and Weibull k (equation (2)) and is determined largely by the mean wind speed, as Γ(1 + 1/k) shows a narrow range from 0.88 to 0.92 for shape parameter varying from 1.5 to 4 as observed in this study at the global level. The Weibull wind speed distribution is completely characterized by the mean wind speed and shape (k) parameter. The sensitivity of wind power to mean wind speed has been discussed in Zhou et al (2012). For these reasons the following analysis will focus on the Weibull shape parameter.
3.2. Evaluation
To understand the reliability of Weibull distribution in fitting time series wind speed data, we evaluated accuracy using three metrics: R2, root mean square error (RMSE), and power density error (PDE) (%). High R2 and low RMSE values indicate a good fit between the data and the Weibull distribution in terms of wind speed. A low PDE value denotes good performance of the Weibull distribution in representing power density. These metrics can be expressed as (Akdağ and Dinler 2009),


where N is the number of bins (here, N is 100 for wind speed from 0.1 to 10 m s−1 with bin width of 0.1 m s−1), xi and yi are the frequencies of calculated wind speed data from Weibull distribution and reanalysis time series data, Pdw is the power density calculated from Weibull distribution, and Pdts is the power density calculated from hourly reanalysis data.
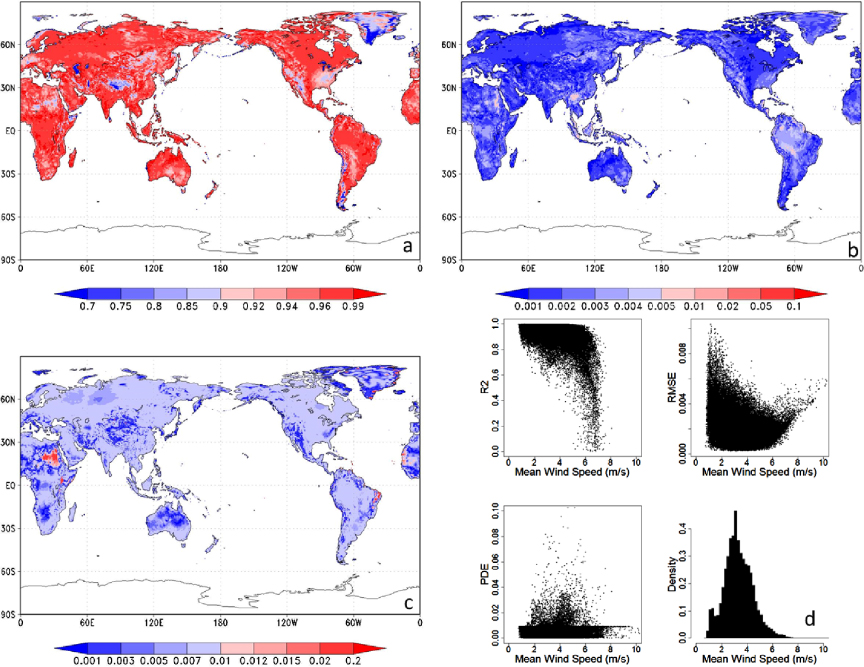
According to all three metrics, Weibull distribution estimated using the PD method fits the data well (figure 2). Most areas at the global level show a R2 better than 0.93 (figure 2(a)). In terms of RMSE, still, most areas show a low value indicating the high reliability of the fitted Weibull distribution (figure 2(b)). Power density errors (PDE%) are under 1% over most parts of the globe (figure 2(c)). In areas with large shape parameter values such as northeastern part of Africa, the Weibull distribution does not capture the reanalysis wind speed data quite well. This may indicate that the wind speed frequency distribution here is too complex to be fitted by the Weibull distribution. Tuller and Brett (1984) find, for example, that areas with frequent calm periods or asymmetric wind patterns are less likely to be fitted by a Weibull distribution. Alternatives for such regions include a bimodal probability distribution, proposed for La Ventosa, Mexico (Jaramillo and Borja 2004), or the general probability distribution presented by Ramírez and Carta (2006). A sector-wise fitting method might improve the estimation of a Weibull distribution in those (relatively few) areas not well fitted by a Weibull distribution, especially in the areas with a bimodal probability distribution (Achberger et al 2002).
Figure 2. Evaluation of a fitted Weibull distribution using the PD method: R2 (a), RMSE (b), PDE (c), and their relationship to mean wind speed (d).
Download figure:
Standard image High-resolution imageThe performance of the Weibull distribution and associated parameters shows a relationship with mean wind speed in terms of R2 (figure 2(d)). Grid cells with higher mean wind speed tend to have lower R2 magnitude while RMSE and PDE are distributed more evenly over the range of wind speeds. The results indicate that the two-parameter Weibull distribution is not necessary more biased in more economically viable wind areas (large speed) compared to low wind speed areas in terms of wind power density, at least when fitted using the PD method, although the R2 magnitude in terms of wind speed tends to decrease in these areas.
3.3. Decadal and seasonal trends
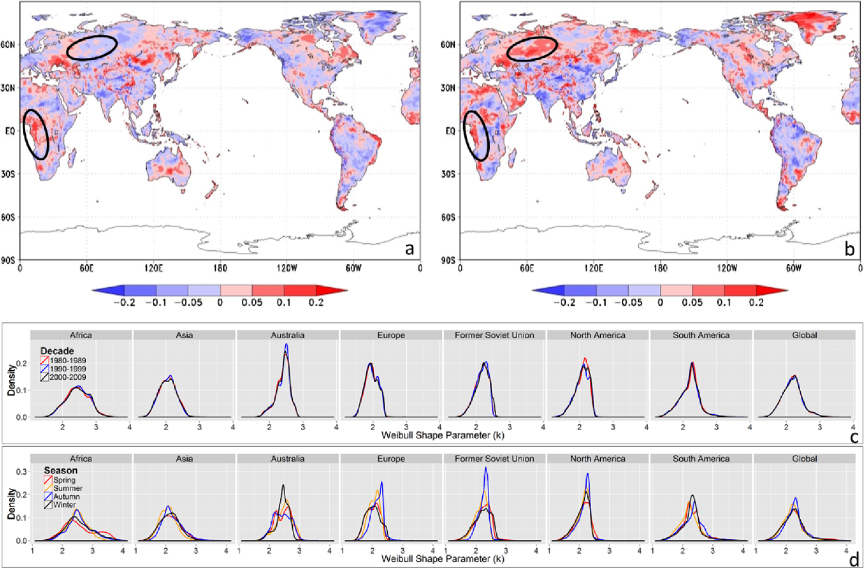
The wind speed distribution shows small temporal changes over 10-year periods. Compared to the base time period (1980–1989), the shape parameter is somewhat different in 1990–1999 and 2000–2009 in space (figures 3(a) and (b)). Some areas, for example, the west coast of Africa, show a consistently increasing trend, while other areas such as Eastern Europe, show an inversed pattern in 1990–1999 and 2000–2009 (figures 3(a) and (b)). At any given point in space, changes of order 0.1 of the k parameter are common, and it reaches up to 0.2 (99% range at the global level). The change of shape parameter of the Weibull distribution will have different impacts on the wind energy potential in areas with different mean wind speed, as discussed in section 3.4 on implications. When evaluated at the regional level, the k parameter shows a small difference over these three periods (figure 3(c)).
Figure 3. Decadal change of Weibull shape parameter compared to 1980–1989: 1990–1999 (a), 2000–2009 (b), and decadal (c) and seasonal (d) change at the regional level. The ovals show two example areas discussed in the letter.
Download figure:
Standard image High-resolution imageSeasonal2 changes in the wind speed distribution are larger than the decadal changes over 1980–2009 (figure 4). This is to be expected, as weather patterns vary in a consistent manner by season. While there are some consistent differences by season, these are smaller than the spatial differences. At a given point in space the k value can vary by more than 1.0 (99% range at the global level) between seasons. When evaluated at the regional level, the change of k parameter varies greatly among regions (figure 3(d)). For example, in the Former Soviet Union, the Weibull k shows a large variation across seasons while in Asia the distribution of the Weibull k is consistent across four seasons. The seasonal changes in wind shape parameter at the grid and regional level are both much smaller than the changes seen across space.
Figure 4. Seasonal patterns of the shape parameter of the Weibull distribution: spring (a), summer (b), autumn (c), and winter (d).
Download figure:
Standard image High-resolution imageThe relatively small variations in wind statistical properties over time, as compared to much larger spatial, and often seasonal, changes, are consistent with the common industry practice of using at least one year of direct measurement data to characterize potential wind turbine sites (MEASNET 2009).
3.4. Implications
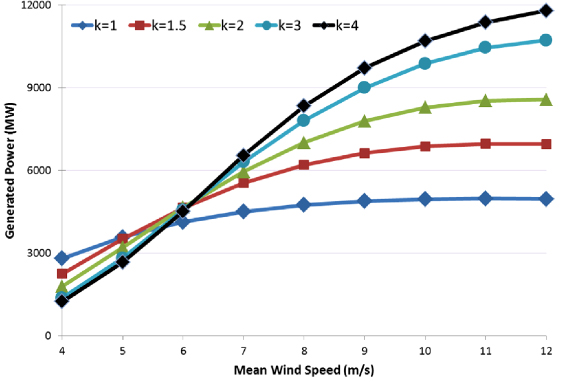
Power generation for the same mean wind speed can be very different for different Weibull shape parameters (figure 5). There are a number of factors influencing actual power production including different turbine power curves and others such as turbine height and turbine density. As an illustrative calculation, we compared wind power generated from a reference 1.5 MW GE turbine (GE 2009) for a range of mean wind speeds from 4 to 12 m s−1 by varying the Weibull shape parameter. When mean wind speed is large (greater than about 6 m s−1), the wind power generated with a small shape parameter (<2) is smaller than the case of the commonly assumed Rayleigh distribution (Weibull k = 2), while wind power generation with a large shape parameter (>2) is larger as compared to Rayleigh. The opposite is true when the mean wind speed is smaller than 6 m s−1. This motivates us to investigate the possible bias of wind power estimation at the global level with the commonly used Rayleigh distribution (Hoogwijk et al 2004).
Figure 5. Wind power from an example 1.5 MW reference turbine (see text) generated with different shape parameters for mean wind speeds from 4 to 12 m s−1.
Download figure:
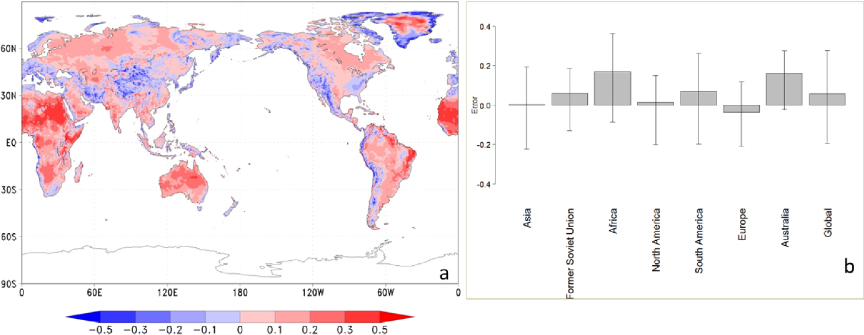
Standard image High-resolution imageWind power is under- or over-estimated by using mean wind speed and k = 2, Rayleigh distribution (figure 6). The bias (under- or over-estimation) is calculated as the percentage difference between the energy produced using a Rayleigh distribution and a Weibull distribution with calculated k. At the global level, wind power was overestimated by an average of 6%, varying from underestimation by 20% (5% quantile) and overestimation by 30% (95% quantile). At the regional level and globally, wind energy is generally overestimated by assuming k = 2 except in Europe. The largest overestimation occurs in Africa and Australia, with an average of more than 15%, and the overestimation can even reach more than 35% (95% quantile) in Africa. The average bias is smallest in Asia and Europe, but it can still be overestimated by 10%–20% (95% quantile) in Europe and Asia. The bias in the estimation of wind power varies greatly in space because of the large spatial heterogeneity of the Weibull shape parameter. We see that bias due to an assumption of k = 2 becomes larger at smaller scales: while only 6% globally this increases to 15% in certain continental-scale regions, and up to 30–35% in smaller areas. The larger the deviation of shape parameter from 2, the higher possible bias in the estimation of wind power. Some caution is advised in these areas when analyzing wind power using a Rayleigh distribution (e.g. Hoogwijk et al 2004), although any potential error in this respect has to be weighted against the quality of the wind speed, or even reanalysis, data.
Figure 6. Possible bias in estimation of wind energy potential using the Weibull shape parameter (k = 2) at the grid (a) and regional level (b). The 5% and 95% quantile ranges across all grid cells in a region are included in (b).
Download figure:
Standard image High-resolution image4. Discussion and conclusions
In this study, we estimated the shape and scale parameters of the Weibull distribution for wind speed frequency at the global level using the power density method and reanalysis wind speed data. To the extent that the reanalysis data provides an accurate statistical representation of wind speeds, these results indicate that the Weibull function can accurately represent the frequency distribution of wind speeds in most areas. The Weibull shape parameter, k, shows large spatial heterogeneity from 1 to 4, while the decadal and seasonal changes are much smaller. Given the relatively low inter-decadal change, it is likely reasonable to estimate the wind power using data series of less than a decade in terms of wind speed frequency. However, more importantly, the commonly assumed Rayleigh distribution, with Weibull shape parameter of 2, should be used carefully for wind energy analysis. This also implies that mean wind speed alone does not supply sufficient information for the analysis of wind power, and that its use may introduce non-negligible bias in many areas: information on the distribution of wind speed is also needed. We find that, in most areas, specification of the mean wind speed and Weibull k parameter would be sufficient to characterize wind speed for wind resource estimation.
These findings need to be taken as indicative, however, because the accuracy of global reanalysis datasets in terms of near-surface wind speeds is not well quantified. Zhou et al (2012), for example, found a substantial underestimation of wind speeds in the United States by the CFSR data used here. Evaluation of global datasets in terms of wind speed, power density, and implications for wind power production, is needed. The implications for wind power of mis-specifying the Weibull k parameter, are smaller at a global level than most other uncertainties involved in wind resource estimates, but can be comparable to other uncertainties at continental or smaller regions (Zhou et al 2012). A high priority is the development of methodologies that allow the impact of small-scale terrain features to be included in global wind resource datasets. Also, at smaller scales, the spatial and temporal patterns of the Weibull k parameter may change due to mesoscale and microscale effects. These effects deserve further investigation, especially in regional studies.
These results also suggest that Weibull parameters would also be a useful way to compare the statistical properties of different wind datasets, such as the reanalysis dataset used here. It would also be of substantial benefit to compare the statistical properties of reanalysis datasets to observations. Given the spatial heterogeneity found in this work, such comparisons will, however, be complicated by the different spatial scales involved. Observations are generally at a collection of specific points, while model datasets are average values over a, often relatively large, grid cell. Analysis using a hierarchy of models with different resolutions would be useful to determine how discrete observations can be used to evaluate if reanalysis, and more spatially detailed wind resource models, accurately capture wind statistical properties.
As global wind data improves, the statistical properties of that data will need to be examined. It will be particularly important to focus on the statistical properties of the higher wind areas, which are of greatest relevance for wind energy development. While better wind speed data will be needed for wind energy analysis, we find here that the available data indicates that the statistical properties of wind fields are likely to vary quite substantially over space, and that not accounting for this variation can result in biases in estimates of wind potential.
Acknowledgments
The authors are grateful for research support provided by the Global Technology Strategy Project and the Integrated Assessment Research Program in the Office of Science of the US Department of Energy. The Pacific Northwest National Laboratory is operated for DOE by Battelle Memorial Institute under contract DE-AC05-76RL01830. The authors would like to thank Larry Berg and anonymous reviewers for constructive comments and suggestions, and the many colleagues and organizations that shared data used in this project. The views and opinions expressed in this letter are those of the authors alone.
Footnotes
- 1
We group globe into seven regions according to the commonly defined seven continents with Antarctica removed and with the Former Soviet Union separated from Eurasia. They are Africa, North America, South America, Europe, Australia, Former Soviet Union, Asia, and the Former Soviet Union.
- 2
Northern Hemisphere season names are used in this letter.

