
Abstract
Efforts to reduce the environmental impacts of transportation infrastructure have generally overlooked many of the efficiencies that can be obtained by considering the relevant engineering and economic aspects as a system. Here, we present a framework for quantifying the burdens of ground transportation in urban settings that incorporates travel time, vehicle fuel and pavement maintenance costs. A Pareto set of bi-directional lane configurations for two-lane roadways yields non-dominated combinations of lane width, bicycle lanes and curb parking. Probabilistic analysis and microsimulation both show dramatic mobility reductions on road segments of insufficient width for heavy vehicles to pass bicycles without encroaching on oncoming traffic. This delay is positively correlated with uphill grades and increasing traffic volumes and inversely proportional to total pavement width. The response is nonlinear with grade and yields mixed uphill/downhill optimal lane configurations. Increasing bicycle mode share is negatively correlated with total costs and emissions for lane configurations allowing motor vehicles to safely pass bicycles, while the opposite is true for configurations that fail to facilitate passing. Spatial impacts on mobility also dictate that curb parking exhibits significant spatial opportunity costs related to the total cost Pareto curve. The proposed framework provides a means to evaluate relatively inexpensive lane reconfiguration options in response to changing modal share and priorities. These results provide quantitative evidence that efforts to reallocate limited pavement space to bicycles, like those being adopted in several US cities, could appreciably reduce costs for all users.
Export citation and abstract BibTeX RIS

Content from this work may be used under the terms of the Creative Commons Attribution 3.0 licence. Any further distribution of this work must maintain attribution to the author(s) and the title of the work, journal citation and DOI.
1. Introduction
Ground transportation is responsible for nearly 30% of the primary energy consumption and 27% of the greenhouse gas (GHG) emissions in the United States [1]. Related infrastructure also results in significant material movement—every $1 million investment in roadway construction requires 9 × 10⁴ tonnes of aggregate and 3.3 × 10³ tonnes of cement [2]. In an effort to try to reduce these burdens, numerous life cycle assessments (LCAs) have been performed over the past decade to understand how specific technological choices contribute to emissions, energy consumption, and materials use. These studies have tended to focus on either the design or the use phase of the road [3]. Design generally involves the selection of a material, e.g., concrete or asphalt, or specification of roadway width and configuration [4]. Use entails a variety of other processes including vehicle selection or roadway maintenance [5]. Even though these studies have identified many obvious opportunities for environmental improvement, there is little evidence to suggest that they have provided deep reductions in material use or emissions.
A principal limitation of many published analyses is that they consider technological options for ground transportation narrowly and evaluate only specific elements of the design or use of roadways at once. An asphalt road may have a lower life cycle emission profile than a concrete road, for example, but that difference is small when compared to the overall emissions from the use phase of the road [6]. Similarly, the conclusion that a greater bicycle mode share will reduce the carbon emissions of a roadway is not useful if it is not considered along with other factors discouraging bicycle use and the impact of more bicycles on overall traffic flow. To date, LCA has been employed as a method for environmental bean counting that considers problems removed from the broader system within which they exist. Consequently, even though LCA has been actively pursued in academic circles, it has had only limited impact in policy circles.
At the same time that conventional LCA tools have been insufficient for solving many of the existing problems faced by transportation managers, emergent challenges make the need for new tools even more pressing [7]. Conventional development patterns have led to widespread congestion in urban and suburban areas around the world. Shrinking maintenance budgets at a time when facilities built in the post WWII boom period are reaching their design life span are making it ever harder to maintain the level of service that was envisioned for roadways during design. Declining pavement quality is also exacerbating the emissions [8] and safety costs associated with the use of these aging facilities, which only compound the impacts of unchecked growth in vehicle kilometers of travel (VKT) worldwide. Efforts to address these problems and provide meaningful improvements will require systems thinking that considers life cycle impacts, personal choice, and policy realities.
In practice, ground transportation is constrained by a few overarching factors. The most obvious is budget. Road construction is expensive, though less so than alternatives like public transport, because much of the cost is borne by users in the form of vehicles and fuel. Roadways are expensive to maintain, and so many exhibit condition ratings below their design values. In many urban areas, space is also constrained and a limiting factor in terms of enabling more mobility. Where space is available, additional road and parking facilities relieve congestion in the near term but only further separate typical destinations, increasing trip lengths over the long term [9]. The carbon emissions from ground transportation are appreciable and growing as more and more developed nations move toward car ownership levels on par with the United States. Paradoxically, the convenience afforded by automobiles has contributed to significant and consistent traffic-related delays in almost all of the worlds' urban centers. These delays translate into appreciable costs to the users of the transportation systems [10], in addition to increased crash and health risks [11], and overall environmental impacts.
Planning that tackles these challenges involves both near-term adaptive strategies and long-term improvement projects. Existing facilities, including the functionally obsolete, have significant embodied emissions and sunk costs that preclude their immediate replacement, even when sufficient funds are available. This lag between identifying changing needs and building new infrastructure results in increased total public costs with respect to design projections. Interim adaptive strategies can be considered, however, to minimize the monetary, environmental, and safety impacts of a sub-optimal design still in the middle of its useful life until it is time to replace the facility [12]. Adapting existing facilities to new use patterns and goals also provides a bridge between generational shifts in infrastructure planning objectives.
In the case of transportation, planning has historically focused on mobility, with the outcomes of ever-increasing VKT and sprawling development patterns that discourage alternatives to the private automobile [13, 14]. In the near term, however, adapting existing facilities to maximize mobility in light of an increased bicycle and transit mode share is an appropriate measure to maximize the value provided by these facilities. Adaptive strategies comply with existing system constraints and involve lower cost measures to capture the remaining value of past infrastructure investments until such time as a major change consistent with a lower impact vision is warranted. Evaluation of these transitional actions is complicated, however, given the absence of any sort of steady state and the number of analyses that must be integrated.
Most of the individual elements constraining ground transportation systems have been studied in isolation, but few examples of integrated multi-criterion analysis of roadway use have been published. Pavement management systems (PMS) have been developed to help maintenance managers maintain large systems of pavements under budget constraints [15–18]. Separately, traffic engineers have developed microsimulation tools of vehicle dynamics to understand the effect of different road configurations [19–21] and work-zone traffic management [10]. Economic analyses rely in part on the engineering analysis of road utilization and make the connection between more infrastructure and induced economic activity. The interests of pedestrians and bikers are also considered in the context of safety [22–24] and congestion [25] but rarely in terms of providing viable alternatives to automobile transportation.
Efforts to identify significant reductions in the environmental burden of transportation will need to consider these tools together to inform optimal use of roadways under multiple constraints. Here we present a method for combining these analyses with conventional LCA of roadways. We consider the results in the context of adaptive roadway lane (re)configuration, such as converting curb parking to bicycle facilities, that many cities, including Washington, DC and New York City, are currently undertaking in an effort to reduce congestion directly and indirectly by supporting alternatives to automobile travel that make more efficient use of the public right of way and incentivize reduced trip distances.
2. Methods
A total cost minimization approach is proposed in order to identify preferable lane configurations for two-lane urban roadways, given the physical parameters of the site, available right of way width, and traffic volumes by mode. A lane configuration is defined by the number and width (or presence) of parking, bicycle, and conventional travel lanes for each direction. Costs include: annualized pavement maintenance, motor vehicle fuel costs [26], and travel time at half the prevailing wage rate [27]. GHG emissions are also calculated. Computationally, the proposed framework is structured as a series of distinct codes.
Microsimulation of idealized roadway segments was carried out using VISSIM 5.4 for all parameter combinations given in table 1 using common values in table 2. The first section of table 1 lists the parameters that define a lane configuration. The remaining parameters in table 1, taken together, will be referred to as the scenario. The key dynamic explored in this work is the use of a single lane by motor vehicles and bicycles simultaneously, and whether the former is able to safely pass the latter within the lane. VISSIM is able to model lateral behavior within lanes, in addition to more conventional vehicle following and lane changing behaviors, and so is able to consider this question. Peak and off peak traffic volumes were simulated separately and combined using 12 h of each to arrive at daily totals, which were then inflated to annual values. Additional detail is provided in the supporting information (available at stacks.iop.org/ERL/8/015028/mmedia).
Table 1. Discrete segment parameter space. All unique combinations were evaluated using microsimulation. The first group defines a lane configuration and the second a scenario.
| Travel lane width | 3.4 m, 4.3 m |
| Bicycle lane | None, 1.22 ma |
| Parking lane | None, 2.5 |
| Characteristic length between passing zones | 50 m, 100 m, 200 m |
| Grade | 0%, ±4% |
| Bicycle mode share | 1%, 10% |
aAASHTO guidelines call for a wider 1.52 m bicycle lane adjacent to curb parking which are applied here as appropriate.
Table 2. Common parameters and descriptive values for all simulated configurations.
| Total width | 6.8–16.6 m |
| Motorized speed | 16.7 m s−1 |
| Bicycle speed | Varies by grade |
| Car occupancy | 1.2 |
| Bus occupancy | 20 |
| Bicycle occupancy | 1.0 |
| Potential curb parking | 6.1 m spaces covering 80% of segment length |
A low and high bicycle mode share were explored, with 1% representing typical urban mode share in the US and 10% representing a target that leading cities, such as Portland, OR, could achieve in the next decade with sufficient investment. Total person trips are constant between the bicycle volume scenarios, with the difference made up by automobiles with an occupancy of 1.2. Figure 1 shows the relative sizes of vehicles and lanes considered in this work. The design standard for lane width in the US is 3.6 m [28], however it is both permissible and likely that narrower lanes are used in the width constrained urban corridors considered in this study, so we assume a 3.4 m base case. Assuming a 1 m passing buffer, 1.75 m wide automobile, and 0.5 m wide bicycle, an automobile is able to pass a bicycle within the lane, however a 2.6 m wide transit bus is not. To evaluate the benefit of alleviating this 'stuck' condition, a wider lane is also considered that allows buses to pass cyclists without either vehicle departing the lane. 'Dooring' accidents, crashes between bicycles and opening automobile doors, may also justify additional buffer width between parked cars and lanes used by bicycles, however the present work does not model crashes, so this effect is not represented in the analysis. The impact of these passing conditions is dependent upon the likelihood that buses will encounter a bicycle and become stuck behind it, thereby delaying themselves and following motor vehicles.
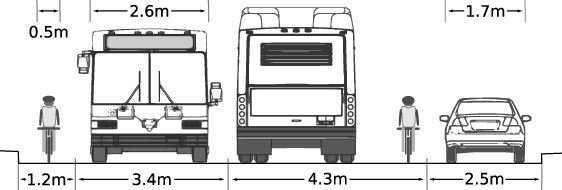
Figure 1. A reference multi-modal street section and the relative widths of vehicles and lanes.
Download figure:
Standard imageRealistic urban corridors vary in width, so it is overly conservative to assume that a given lane width will restrict passing movements indefinitely. Here, we adopt the concept of a characteristic length between passing zones, as given in table 1 to determine the likelihood that a bicycle and bus will be present and the delay expected to result from the encounter. VISSIM simulates these interactions directly. Since Poisson vehicle arrivals are assumed, however, in order to make the results as general as possible, a probabilistic analysis can be carried out to compute expected delay. This analysis is presented in the supporting information (available at stacks.iop.org/ERL/8/015028/mmedia) and agrees with the results of the microsimulation. Motor vehicle speeds were assumed constant for each lane width given the considerable variation that exists in the literature on the effect of lane width of motorist speed choice [22, 29, 28], however, this behavior could be readily altered in the microsimulation parameters where local data is available. Bicycle speeds for each grade were computed according to first principles formulas [30].
Vehicle fuel use and emissions are affected by pavement roughness though not consistently between various operational regimes [31–33] due to the varying contribution of rolling resistance to required power. A power-based vehicle emissions model, CMEM [34], was used to post-process the microsimulation vehicle data at 1 Hz and two roughnesses using a lookup table computed at a reference international roughness index (IRI) of 1.0 m km−1, and for a rough case with an IRI of 4.0 m km−1 by inflating vehicle rolling resistance after Karlsson et al [33]. Only automobile emissions were affected due to the inconclusive results of that study for heavy vehicles. Final emissions and fuel consumption were computed by the pavement management module through linear interpolation of the two roughness cases.
Pavement management activity and emissions were computed based on the previous work of the authors [35] with additional dynamic pavement loading due to roughness [36]. Explicit treatment of heavy vehicles is important in the comprehensive analysis of a roadway given their disproportionate impact [37]. Pavement maintenance plans were computed for both directions of travel lanes, bicycle lanes, and parking lanes independently using aggregated annual vehicle volumes and emissions from the appropriate microsimulation trials. A network Pareto front for all the lanes was then computed, with a representative example given in figure 2. For this analysis, the non-dominated plan with the minimum total GHG emissions, subject to agency constraints, was selected. Further detail on this method, and the larger issues of discounting and temporal variation, can be found in the supporting information (available at stacks.iop.org/ERL/8/015028/mmedia).
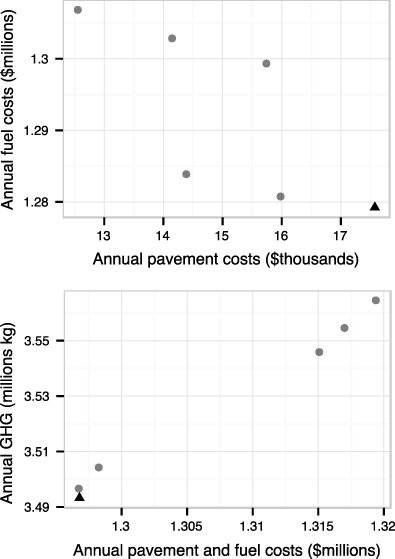
Figure 2. Agency pavement costs versus user fuel costs as a result of pavement roughness (upper) and combined costs versus combined GHG emissions (lower) from non-dominated pavement management plans. The triangle data point indicates the selected plan by minimum GHG.
Download figure:
Standard imageIn combining the separate models of pavement management, vehicle microsimulation, and vehicle emissions computation, a hierarchy exists according to the sensitivity of one to another. Pavement roughness influences vehicle fuel use and emissions as well as dynamic pavement loading. Loading affects pavement durability, and maintenance investment determines the resulting pavement condition. Vehicle behavior is assumed to be insensitive to pavement condition within the specified limits, however, which makes travel time cost insensitive to changes in fuel and agency costs. Critically, this means that the PMS optimization can be performed after microsimulation. Otherwise, the task would be computationally intractable with existing microsimulation tools, since a microsimulation would have to be run at each iteration of the PMS genetic algorithm.
A Pareto front of lane configurations can be identified for each scenario that is non-dominated with respect to total costs and width. Lane configurations that include curb parking will naturally not appear in this set since they incur pavement maintenance costs but provide no counterbalancing benefit as computed. A spatial opportunity cost of curb parking can be computed, however, by computing the cost differential between configurations with parking and a point interpolated on the Pareto cost curve at the same total width. This opportunity cost allows decision makers to quantify the potential mobility value of public right of way allocated to parking.
3. Results
The effect of bicycle mode share on average travel time for a particular segment can be significant for specific conditions as shown by the results in figure 3. Differentiation between the cases occurs when heavy (wide) vehicles, such as transit buses encounter a bicycle and have insufficient room to safely pass resulting in significant delays for themselves and the motor vehicles behind them. In these graphs, individual data points represent microsimulations of specific cases and are plotted with random jitter on the length axis for legibility. As with other results presented here, they are normalized to a kilometer of travel. The trend lines are second order polynomials used to illustrate the relationships of interest. The effect of grade, and whether or not vehicles are traveling uphill or down, have important effects on the results presented in figure 3. The data are grouped based on whether or not buses are stuck behind bikers in the different configurations. For the level ground segment, the results are equivalent. For the inclined segment, the uphill travel time is always considerably higher than downhill travel time if trucks get stuck behind buses. The impact of the stuck condition is proportional to the relative speed difference between bicycles and motor vehicles, which comes from roadway grade, and the likelihood of a heavy vehicle encountering a bicycle within the characteristic distance between passing zones. This is determined by modal volumes and headway distribution.

Figure 3. Simulated motorized travel time illustrates the delay caused when heavy vehicles are unable to pass bicycles.
Download figure:
Standard imageFor lane widths more narrow than those considered here, all motor vehicles with more than two wheels would be unable to pass bicycles within their lane, with the result that the expected speed of all traffic would approach that of bicycles as characteristic length and bicycle volume increased. These cases are not presented in order to focus on the more typical but less intuitive stuck condition, and because very narrow lanes are likely to have an effect on driver speed decisions according to the particular characteristics of the site, such as sight distance, land use, number of driveways, and other factors. This is not to say, however, that the framework presented here is not suitable for 3.1 m lane widths, only that the results would not be transferable to other situations. For wider lane widths, the differentiation observed here disappears as heavy vehicles are able to pass bicycles. All four stuck groups include multiple lane configurations which reveal more subtle differences in annual costs with respect to width (distance between curbs) when considered individually. In figure 4, this relationship is seen as a distinct Pareto optimal frontier for each characteristic length between passing zones, grade, and bicycle mode share considered, with non-dominated lane configurations shown in bold. The influence of the stuck condition can be seen in the abrupt transition in the Pareto curve around 8.6 m, or the minimum width of a configuration not stuck in both directions. The initial drop between the first two non-dominated points is larger for the 4% case, as compared to level ground, since alleviating the stuck condition on the uphill segment is considerably more important than in the downhill direction given the dramatic difference in expected bicycle speeds.

Figure 4. The relationship between road width and costs follows a Pareto optimal behavior, shown here for 100 m characteristic lengths. Total travel time costs (left) dominate fuel and PMS costs, however when delay costs are used (right) increased cycle mode share can reduce costs for appropriate lane configurations.
Download figure:
Standard imageFor the urban situations considered in this work, both travel time and fuel use are positively correlated with vehicle delay. These costs are also considerably larger than agency expenditures for non-dominated pavement maintenance plans, which can be seen in figure 2. This relationship supports the decision to select the PMS plan with the minimum total GHG emissions (higher agency cost), since a comparatively small agency investment provides a larger reduction in user costs. It follows that minimizing total costs also minimizes GHG emissions since total costs are dominated by time and fuel and are sensitive only to delay once pavement condition has been established. This is encouraging since typical planning processes do not explicitly quantify GHG emissions.
Figure 4 presents the Pareto front with respect to total costs and then using delay rather than total travel time costs. Neither approach is strictly more accurate, however since bicycle travel is generally more time consuming over the same roadway segment, increasing bicycle mode share tends to dramatically increase time costs. Using the time cost of delay only, assumes that travelers had already accounted for this cost externally, which is not unreasonable, and is typical in traffic analysis. Under this assumption, figure 4 reveals a tipping point where increased bicycle mode share lowers total costs, given sufficient roadway width. For cases where significant increases in bike ridership are not paired with enhanced facilities like wider roads, this will increase travel time for all users.
Parking is not valued in the total cost reported in figure 4. As a result, lane configurations with parking bays incur pavement maintenance costs without corresponding negative costs from parking's value as a service, rendering these configurations sub-optimal. This also explains why costs reach their minimum in figure 4 approximately 5 m before the maximum width since that is the width occupied by two 2.5 m parking bays. Curb parking does have a site-specific value both in terms of vehicular accessibility and in the broader economic sense by supporting value capture along the street through increased business patronage. Because the magnitude of this value capture is so site-specific, figure 5 presents a spatial opportunity cost of curb parking as the difference between the total cost of a lane configuration that includes parking and a linear interpolation of the Pareto front at the same width. Visually, this is the vertical distance between the lighter data points in figure 4 and the Pareto front, normalized to a daily value per parking space. The narrowest lane configuration that can include parking is 9.3 m wide, so opportunity cost is reported from this value up to the maximum configuration width.
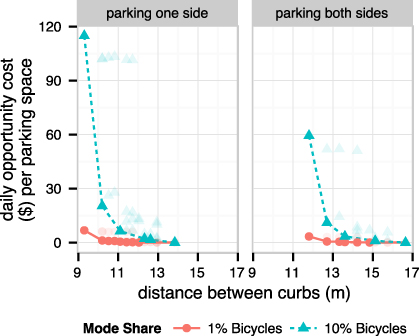
Figure 5. Spatial opportunity cost for curb parking, shown here for 100 m characteristic length and 4% grade, increases dramatically for narrower roads suggesting that when all the costs are considered, there is a tipping point beyond which curb parking becomes an expensive use of land.
Download figure:
Standard imageA spatial opportunity cost of parking is shown in figure 5 for the inclined case with a 100 m characteristic distance between segments. The likelihood of buses' getting stuck behind a bicycle is related to characteristic length, so other scenarios look similar to this plot but shifted in magnitude accordingly by length. Level ground also exhibits consistent behavior, albeit with a different curve shape that can be inferred from figure 4. Since the maximum hourly volumes considered in this study are below saturation levels, delay comes almost entirely from the bicycle/motor vehicle interactions. Therefore, it is not surprising that parking opportunity costs are highly sensitive to the percentage of bicycles in the traffic stream. For a given width, parking and bicycle infrastructure essentially compete for the same space which results in large opportunity costs for parking in narrow configurations, as might be seen in a traditional urban neighborhood of places like New York City and Washington, DC. These larger values are also well in excess of typical parking meter returns, which is consistent with the pervasive subsidization of automobile parking in the US [38]. These values must also be considered conservative since they do not include any opportunity costs for land in the pedestrian zone on either side of the roadway proper that could be put to other uses, such as pedestrian mobility or restaurant seating.
4. Sensitivity and additional considerations
To develop a more complete understanding of how urban roadway design can be informed by a model like this, it is useful to consider both those factors that had little impact on the results and those factors that were not included in the analysis for one reason or another. Pavement roughness and its effects on fuel consumption are considered here even though in the context of urban driving, roughness is far less important than acceleration cycles in determining fuel efficiency. However, since travel time is independent of roughness, pavement management costs for a given configuration are optimized against marginal vehicle fuel consumption which is on the same order of magnitude. Additionally, the fiscal reality of the pavement manager may be such that maintaining serviceable pavement is a constant struggle, and so minimization of agency costs may replace minimization of GHG emissions in selecting the best plan. The impact pavement condition has on a given commuter's likelihood to select the bicycle or automobile mode is difficult to quantify, but also more significant to the ultimate makeup of the Pareto set of lane configurations by determining relative volumes between the modes as can be seen in figures 4 and 5.
Similarly, only select measures of the health and safety factors associated with modal shift are captured by this model since many of these are difficult to quantify with confidence even though they are often cited as an important driver and/or obstacle in mode shift toward more active forms of transportation [39]. Crashes, though not considered in this work, are an important factor in selecting bicycle transport and even though AASHTO guidelines dictate an additional 0.3 m of width for bicycle lanes adjacent to curb parking, that width remains insufficient to prevent dooring crashes between bicycles and parked cars [40, 41]. The cost of curbside parking goes up fractionally for this additional 0.3 m of pavement to address the risk of dooring to bikers, however the actuarial cost of a potential fatality is on the same order of magnitude as total annual travel cost per kilometer in this study. Crashes are difficult to model generally, and difficult to even estimate based on past reports involving bicycles due to pervasive under-reporting of non-fatal encounters. Never the less, the potential health and safety costs are potentially large enough to influence the results presented here.
Another limitation of the model is that it does not consider roadway segments within the larger roadway network. In many urban areas, vehicle arrival is not Poisson distributed but rather appears as a decaying platoon progressing between controlled intersections. In addition, driveways play an important roll in platoon migration and overall capacity in urban settings. Finally, buses stop periodically for passengers and this presents an opportunity for the traffic to clear and the biker and bus to separate. These factors were not considered here in order to make the analysis as general as possible but could be readily incorporated into the microsimulation for a specific site. Many of these factors would need to be included in a similar model to derive site-specific estimates for the opportunity cost of parking even though we expect that the general trends discussed here would hold for most urban roadways.
5. Implications
A major challenge for urban areas around the world is to improve livability, which is often achieved by reducing reliance on automobile transport [42, 43]. A shift away from the automobile also results in significant reductions in energy use and GHG emissions, both of which are increasingly relevant policy objectives. For countries with a legacy of automobility-dominated planning and policy decisions, such as the US, these goals are especially daunting. Reducing VKT through more compact development and alternative transportation modes is a long-term objective, but previous studies have observed that many of our projected future emissions are 'locked in' by virtue of the inefficient nature of our existing infrastructure stock and the relatively slow rate at which this is replaced [44]. Short-term strategies are needed to achieve some of these gains without major changes to our existing infrastructure. Improving bicycle facilities is one such change that could encourage higher mode share without significant investment. In cities like Washington, DC and New York City, where many of the trips are short and well suited to bicycle transport, efforts have been underway for several years to provide such facilities. Consequently, bike mode share is increasing significantly [45], but the ridership rates in these US cities are still an order of magnitude lower than in many European cities [46]. Additionally, these changes are not without controversy in light of their direct costs and use of limited space [47].
Tools like the one developed here can be used to help resolve the apparent conflicts that could inhibit progress toward more environmentally sustainable infrastructure. We find that increasing bicycle mode share can have a significant impact on motor vehicle delay, and indeed greatly increase total costs where sufficient right of way is not provided. Conversely, with sufficient space to allow wide vehicles to pass bicycles, a reduction in total costs for all users is obtained through an increased bicycle mode share. Parking, specifically curb parking, emerges as space that is potentially most eligible for reallocation to bicycles in width constrained urban corridors because of its ideal position and the relatively minimal expense of lane reconfiguration. The spatial opportunity cost of parking quantifies this tradeoff and exhibits sharp transitions between realistic monetary amounts for wider streets and unfeasibly high expected returns for more narrow areas. These results provide a clear guide to traffic engineers and urban policy makers with respect to optimal allocation of limited pavement.
Even though life cycle assessment and other tools are useful for beginning to understand pieces of this problem, a systems-based approach like the one proposed here is needed to directly support policy decisions. By considering infrastructure systems in an integrated, yet quantitative manner using existing modeling frameworks, short-term low cost opportunities emerge for efficiency improvements that would not be obvious using other tools alone. The general framework proposed here could be applied in a variety of infrastructure contexts. For example, the green building industry standard, leadership in energy and environmental design (LEED), has already recognized that buildings cannot be analyzed outside of the larger infrastructure context within which they exist and is making changes to consider the community within which the building exists [48]. Other types of infrastructure have been less studied and offer hereto untapped efficiency improvements. Water treatment and distribution, freight transport, the electrical grid, and wireless communications, and others could all benefit from considering engineering performance criteria, agency and user cost, and human factors together for informing improved policy.
Acknowledgments
This work was developed under STAR Fellowship Assistance Agreement no. FP917275 awarded by the US Environmental Protection Agency (EPA). It has not been formally reviewed by EPA. The views expressed are solely those of the authors, and EPA does not endorse any products or commercial services mentioned.