
Abstract
We evaluate the ability of process based models to reproduce observed global mean sea-level change. When the models are forced by changes in natural and anthropogenic radiative forcing of the climate system and anthropogenic changes in land-water storage, the average of the modelled sea-level change for the periods 1900–2010, 1961–2010 and 1990–2010 is about 80%, 85% and 90% of the observed rise. The modelled rate of rise is over 1 mm yr−1 prior to 1950, decreases to less than 0.5 mm yr−1 in the 1960s, and increases to 3 mm yr−1 by 2000. When observed regional climate changes are used to drive a glacier model and an allowance is included for an ongoing adjustment of the ice sheets, the modelled sea-level rise is about 2 mm yr−1 prior to 1950, similar to the observations. The model results encompass the observed rise and the model average is within 20% of the observations, about 10% when the observed ice sheet contributions since 1993 are added, increasing confidence in future projections for the 21st century. The increased rate of rise since 1990 is not part of a natural cycle but a direct response to increased radiative forcing (both anthropogenic and natural), which will continue to grow with ongoing greenhouse gas emissions.
Export citation and abstract BibTeX RIS

Content from this work may be used under the terms of the Creative Commons Attribution 3.0 licence. Any further distribution of this work must maintain attribution to the author(s) and the title of the work, journal citation and DOI.
1. Introduction
A complete understanding of 20th century sea-level rise has been lacking, with the observed rise over recent decades being larger than projections in the Intergovernmental Panel on Climate Change (IPCC) Third (TAR, Church et al 2001) and Fourth Assessment Reports (AR4, Hegerl et al 2007). As a result, sea-level projections for the 21st century and beyond have been controversial. The omission of 'rapid' dynamic ice sheet contributions from the AR4 projections, because of the lack of a published basis for estimating them, compounded this problem. Rahmstorf et al (2007) argued that the observed sea-level rise since 1990 was at or above the upper limit of the TAR projections, and Rahmstorf et al (2012a) argued that both the TAR and AR4 projections were biased low. However, using an improved understanding of the impact of volcanic eruptions on sea level, Church et al (2011a) described the comparison slightly differently, finding that while the observed rise was in the upper quartile of the AR4 projections there was no inconsistency between observations and projections from 1990. Semi-empirical models (SEMs; Rahmstorf 2007, Horton et al 2008, Vermeer and Rahmstorf 2009, Grinsted et al 2010, Jevrejeva et al 2010, 2011, Rahmstorf et al 2012b) have been proposed as an alternative way to estimate future sea-level rise.
Using observations of 20th century temperatures, Bittermann et al (2013) [B13] compared SEM forecasts of 20th century sea-level rise to the observations. They concluded that, when both tide-gauge reconstructions of global mean sea-level and paleo sea-level data were used to estimate the parameters of their SEMs, their forecasts for 1900–2000 (range of 13–30 cm) were in agreement with the observations (14–26 cm). For the period 1961–2003, they also found that when the SEM was trained using the Church and White (2011) [CW11] estimates of GMSL and paleo data up to 1960, the predicted rate of 2.0 mm yr−1 (range of 1.9–2.3 mm yr−1) agreed with the observations within the uncertainties. However, using the Jevrejeva et al (2008) estimate of GMSL, with or without the paleo data, resulted in sea-level projections that were biased high by up to 70%. B13 challenged the sea-level process model community to test their projections for the same period.
Here we evaluate the ability of process based models (the basis of 21st century projections) to simulate 20th century global averaged sea-level rise. These process based models are dependent on our physical understanding of the climate system built up over many years. Modelling sea level requires simulations of oceanic and atmospheric global and regional temperatures. In contrast to the SEMs, the process based models are forced by greenhouse gas concentrations and simulate temperature changes, rather than using observed temperature or radiative forcing changes as input, and they are not trained with observed sea levels and are therefore not sensitive to uncertainties in them. This study builds upon recent progress in understanding the 20th century sea-level budget (Church et al 2011b, Moore et al 2011, Gregory et al 2013a) but focuses clearly on model results and their ability to project sea-level change. We compare individual contributions to sea level calculated with the World Climate Research Programme Coupled Model Intercomparison Project Phase 5 (CMIP5) model results with observations (section 2) and compare the sum of these terms to the observed sea-level rise since 1900, 1961 and 1990, as in B13. We discuss the possibility that some fraction of 20th century sea-level change is possibly due to internally generated variability that is unlikely to be simulated in phase and amplitude by the models (section 3). We also discuss the implications of the results for the observed increase in the rate of rise and for future projection of 21st century sea-level rise (section 4).
2. Sea-level response to historical radiative forcing and anthropogenic intervention in the water cycle
2.1. Ocean thermal expansion
Ocean thermal expansion (figure 1(a)) is available for 25 atmosphere–ocean general circulation models (AOGCMs) participating in the CMIP5 experiment. The simulations used here have been forced with the best estimates of historical radiative forcings up to 2005 and then radiative forcing from the RCP4.5 scenario (Moss et al 2010, Taylor et al 2012) until 2010. However, the preindustrial spin-up and the control simulation for these models assumed zero volcanic forcing and thus the sudden imposition of the negative volcanic forcing in the historical simulations from 1850 results in a negative bias in the estimated ocean thermal expansion (Gregory 2010). To overcome this bias, we have added 0.1 mm yr−1 (±0.05 mm yr−1) ocean thermal expansion to the model results (Gregory 2010, Gregory et al 2013b). We compare the model results to the observational estimates based on the analysis of Domingues et al (2008), updated to 2012 for the upper 700 m, the Levitus et al (2012) analysis from 700 to 2000 m, and a linear trend from 1992 to 2011 for the ocean below 2000 m (Purkey and Johnson 2010). From 1970, when the amount of observational data increases significantly, the models and the observations are not significantly different and the observations are near the centre of the model simulated range.

Figure 1. Comparisons of modelled and observed (a) ocean thermal expansion (observations in blue), (b) glacier contributions, (c) changes in terrestrial storage (the sum of aquifer depletion and reservoir storage) and (d) and the rate of change (10 year centred average) for the terms in (a) to (c). Individual model simulations are shown by grey lines with the model average shown in black (thermal expansion) and purple (glaciers). The estimated glacier contributions estimated by Cogley (2009, green), Leclercq et al (2011, red) and using the model of Marzeion et al (2012, dark blue) forced by observed climate are also shown in (b). All curves in (a) and (b) are normalized over the period 1980–1999 and the colours in (d) are matched to earlier panels.
Download figure:
Standard imageModelled thermal expansion (figures 1(a), (d)) falls slightly following the volcanic eruption of Santa Maria in 1902. The rate of expansion is then relatively constant up until the eruption of Mt Agung in 1963 when there is a significant fall in sea level. There are similar falls in sea level following the eruptions of El Chichon in 1982 and Mt Pinatubo in 1991. The increase in sulfur dioxide emissions by more than a factor of two from 1950 to 1975 (Smith et al 2011) results in an increasingly negative aerosol forcing that partially offsets the increasing greenhouse gas concentrations leading to a slower rate of warming (and thermal expansion) after 1960 (Church et al 2011b). Over the 20th century, there is a clear increase in the rate of rise with the fastest rate occurring from 1993. This latter increase is a result of increasing greenhouse gas concentrations, recovery from impacts of the Mt Pinatubo eruption (Gregory et al 2006, Gleckler et al 2006, Church et al 2005, Domingues et al 2008, Gregory et al 2013a) and falling sulfur dioxide emissions from 1975 to 2000 (Smith et al 2011).
2.2. Glacier contributions
Marzeion et al (2012) use an (offline) glacier model forced by regional surface temperatures and precipitation from AOGCM CMIP5 climate simulations to estimate glacier contributions for the 20th century (figures 1(b), (d), grey and purple lines). Their model is calibrated using individual glacier mass balance observations also used by Cogley (2009), such that the Marzeion et al (2012) results are neither strictly independent from the Cogley (2009) results, nor from observations. However, the dependency is very weak, since only about 0.1% of all the world's glaciers are included in these observations (substantially less in terms of surface area and ice volume, and with a mean time series length of only 15 years). Two different validation methods in Marzeion et al (2012) show that the model is able to reconstruct observed glacier changes independent of the observations, such that the combined contribution of all the glaciers to sea level is in fact only weakly dependent on the observations of individual glacier contributions. From 1950, the model results (15 available models) used by Marzeion et al are not significantly different from the observed estimated changes in glacier mass of Cogley (2009) and the estimates based on glacier length from Leclercq et al (2011). The Marzeion et al modelled rate of rise is almost constant during the first half of the century up until 1960 but larger than the Leclercq et al estimate (that also relies on Cogley), then smaller until the 1990s (figure 1(d)), after which it increases. Loss of glacier area at low altitudes combined with the stabilization of temperatures for the 1950–1975 period could have contributed to this slowing of the rate of glacier contribution.
2.3. Greenland and Antarctic contributions
The contributions of the Greenland and Antarctic Ice Sheets for the 20th century are poorly determined. Observational estimates for 1993–2011 (Shepherd et al 2012) indicate a net contribution of about 11 mm, about two thirds of this from Greenland. Models of surface mass balance (using AOGCM results) for Greenland agree with the increased surface mass loss over the last two decades but indicate little impact on sea level over previous decades, and with divergent results for the first half of the 20th century. (See Gregory et al (2013a) for a full discussion.) Recent model results for four major Greenland outlet glaciers (Helheim, Jakobshavn, Petermann and Kangerdlugssuaq) forced by changes in ocean temperatures (Nick et al 2009, and personal communication) indicate a contribution of order 0.6 mm yr−1 for 2000–10, consistent with the observational estimates. However, we are unaware of any completed model simulations of the Greenland Ice Sheet contribution for the 20th century using the new generation of ice sheet models.
For Antarctica, Levermann et al (2012) have recently completed an ice sheet model simulation for the 20th century using ocean temperatures on the shelf near Antarctica and atmosphere–ice exchange from the CMIP5 AOGCMs, with an allowance for a delay of the warming to penetrate underneath the ice shelves. The 20th century contribution is only 4 mm, mostly since 1990, similar to recent observational estimates (Shepherd et al 2012).
These results indicate significant progress in modelling ice sheet response to climate and ocean forcing. However, as they are as yet incomplete, we have not included these new model results here. Instead, we include estimates of these terms in section 3 and discuss the implications in section 4.
2.4. Land-water storage
Internally generated climate variability influences the amount of water stored as soil moisture and in lakes, rivers and reservoirs. On short timescales, the rate of change in the storage can be several millimetres leading to rapid rates of sea-level change (Boening et al 2012). However, over decadal timescales the net contribution is small (Ngo-Duc et al 2005) and hence for the comparison we ignore this contribution.
There are also direct human related interventions in the hydrological cycle that impact the amount of water stored on land. This occurs principally through the building of reservoirs (Chao et al 2008, Lettenmaier and Milly 2009) and the depletion of groundwater (Konikow 2011, Wada et al 2012). For reservoir storage, we use the estimates of Chao et al with no allowance for seepage (as in Gregory et al 2013a). We assume that the reservoirs are on average 85% full (with a range of 70–100%). For groundwater depletion, we average the observational estimates of Konikow (2011) and model results of Wada et al (2012). Over the first half of the 20th century, both of these terms are small (figure 1(c)). After 1950, the significant increase in the rate of dam building leads to negative contribution to sea-level change. From the 1980s, a slowing in the rate of dam building and an increase in the rate of groundwater depletion leads to a small positive contribution to sea-level rise (figures 1(c) and (d)).
2.5. Observed and modelled sea-level change 1900–2012
We compare the sum of the ocean thermal expansion, glacier and estimated land-water contributions (available for 13 models) with observational estimates of global mean sea level of CW11 and Ray and Douglas (2011) [RD]; figure 2. Both estimates are similar over the 20th century (RD has a slightly larger trend), with a broad maximum in the rate of rise from 1930 to 1950, a minimum about 1960 and then a rising trend to the end of the records. Both series have a minimum in the rate of rise in the 1920s and a maximum in the 1970s, but it is unclear if these two features are robust or an indication of the inadequacy of the available sea-level data.
The sum of the modelled ocean thermal expansion, glacier, and terrestrial storage contributions from 1900 to 2010 (figure 2(a)) ranges from 110 mm to almost 200 mm with a model average of 153 mm. The spread of models encompasses the GMSL estimate of CW11 but is slightly less than RD. The average of the model results explains about 80% of the observed rise. The average modelled rate of sea-level rise (figure 2(b)) is more than 1 mm yr−1 prior to 1950, as a result of early 20th century warming and thermal expansion and increased glacier melting, but is somewhat less than the observed rate over 1930–50. The average modelled rate of rise decreases to less than 0.5 mm yr−1 in the 1960s before increasing again to reach a maximum of 3 mm yr−1 in 2000, about double the 20th century average and substantially greater than the modelled rate of rise in the first half of the 20th century. The slower rate of rise from 1950 to 1980 is likely a result of the impact of volcanic eruptions, the increase in tropospheric aerosol loading (emissions peak in the 1970s) on the modelled ocean thermal expansion and glacier melting contributions, a loss of glacier area following early 20th century melting and an increase in the rate of reservoir storage.
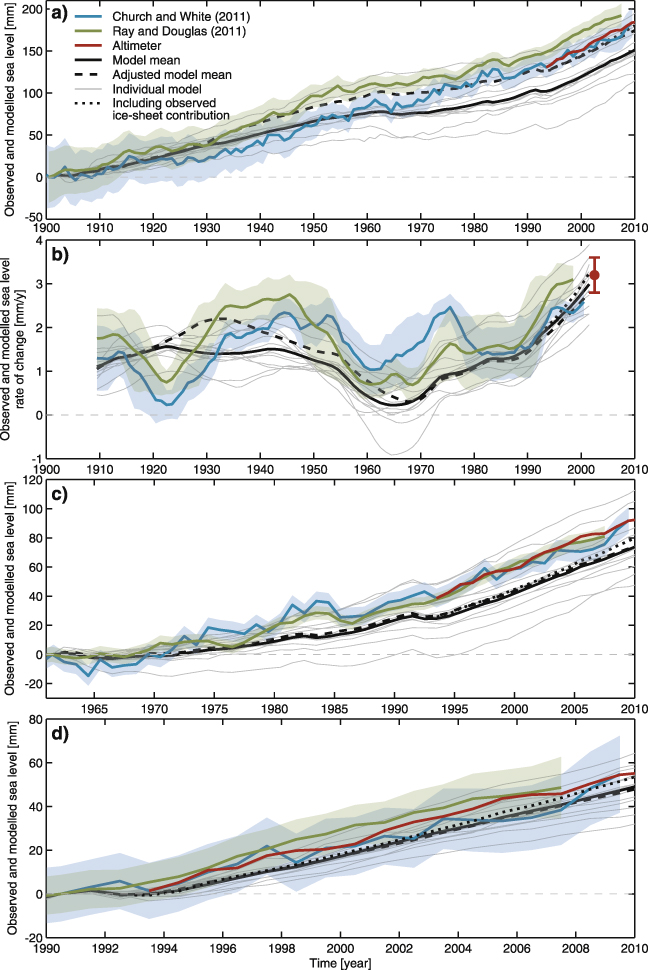
Figure 2. The sum of the modelled contributions from ocean thermal expansion, increased glacier melting and changes in land-water storage. The light grey lines are individual models with the black line the model mean. The 20th estimates of global mean sea level are indicated by the blue (CW11) and green (RD) lines with the shading indicating the uncertainty estimates (two standard deviations). The satellite altimeter data since 1993 is shown in red. The adjusted model mean (dashed black line) is the model mean after an allowance for the impact of natural variability on glacier contributions and a potential long-term ice sheet contribution are included. The results are given (a) for the period 1900–2010, (b) the rates of sea-level change for the same period, (c) for 1961–2010, and (d) for 1990–2010. The dotted black line is after inclusion of the Shepherd et al (2012) ice sheet observational estimates but excluding the peripheral glacier contribution (to avoid double counting). The red dot is the average rate from the altimeter record.
Download figure:
Standard imageFor the period since 1961 (figure 2(c)), the modelled rise ranges from about 50 to 110 mm and encompasses the observed rise of close to 90 mm, with the model average rise of 75 mm explaining about 85% of the observed rise. Since 1990 (the start of the projections for the TAR and the AR4; figure 2(d)), the modelled sea-level rise ranges from 30 to 65 mm and encompasses the observed rise of about 55 mm, with the average model rise of 51 mm explaining over 90% of the observed rise. The model average rate over 1993–2010 of 3 mm yr−1 is almost equal to the rate of 3.2 ± 0.4 mm yr−1 observed with satellite altimeters (with both rates being very linear). The increased rate of the modelled rise from 1980 to 2000, and particularly after 1993, is a result of continued increases in greenhouse gas concentrations, the recovery of the climate system from the series of volcanic eruptions (particularly Mt Pinatubo in 1993), decreasing sulfur dioxide emissions from 1975 to 2000 and increasing land-water contributions.
3. Other effects on sea-level change
There are at least two potential additional contributions to 20th century sea-level change. Firstly, the ice sheets are often assumed to have been in a state of approximate mass balance, hence making zero net contribution to sea level before the major increase in greenhouse gas emissions of the 20th century. However, the long response time of the Antarctic and (to a lesser extent) Greenland ice sheets means that there may be a small ongoing contribution to sea-level change due to climate change in previous centuries or millennia (Huybrechts et al 2011). An ongoing contribution of 0.0–0.2 mm yr−1 was considered in the sea-level budget studies of Gregory et al (2013a) and Church et al (2011b). Here we have added a 0.1 mm yr−1 contribution to the above modelled estimates (10 mm over the 20th century).
Secondly, there may be contributions related to internally generated variability on decadal timescales (Delworth and Knutson 2000). Marzeion et al (2012) have also computed glacier mass changes using observed rather than simulated temperature change (figure 1(b), blue line). An additional contribution of about 20 mm is estimated to occur between 1920 and 1960, with the largest additional contribution in the 1930s (the difference between the blue and purple lines in figure 1(b)). While the Leclercq et al (2011) estimates from measurements of glacier length indicate a smaller overall contribution during the 20th century, they also give a greater rate of mass contribution from 1920 to 1940 than for earlier and later periods. These additional early 20th century contributions are a result of a regional warming over Greenland during this period (Chylek et al 2004).
When these two terms are added to the AOGCM results, the sea-level rise over the 20th century (figure 2(a), dashed line) is 176 mm, which is over 90% of the observed GMSL estimate, and both observed time series lie within the model spread (the individual model results have not been replotted after the addition of these terms). The modelled rate of rise in the first half of the 20th century is now closer to the observed rate and the observed rate lies within the spread of the model rates through nearly all of the century, although the timing of the faster rate of rise occurs slightly earlier in the model results than in the observations. There is little change to the simulations from the additional terms for the periods since 1961 and 1990 and the average model results for these periods remain within 20% of the observed rise (figures 2(c), (d)). The observational estimates (Shepherd et al 2012) indicate a small 20th century ice sheet contribution that would further close the gap between the observed and modelled sea-level rise to about 10% or better, as depicted by the dotted lines in figure 2.
4. Discussion
Ocean thermal expansion and the increased melting of glaciers are the two dominant contributions to 20th century sea-level rise in the simulations, with a smaller contribution from changes in land-water storage. Each of these components has its own unique temporal dependence. The model results indicate that most of the variation in the thermal expansion and glacier contributions to global mean sea level is a response to radiative forcing of the climate system from changes in concentrations of greenhouse gases, stratospheric volcanic aerosol and tropospheric anthropogenic aerosol. Observations in the latter half of the 20th century provide strong support for and confidence in the model simulations of these components. However, since parameters in the glacier model are estimated from observations in the latter half of the 20th century, the evaluation of the glacier models is not a fully independent test of their skill.
Not all 20th century sea-level rise is necessarily externally forced. There is evidence for an enhanced glacier contribution in the first half of the 20th century (Marzeion et al 2012, Leclercq et al 2011). Since climate models can simulate early 20th century global averaged temperature well (Stott et al 2000), the difference between the two glacier estimates may be partly related to regional climate changes (rather than global averaged temperatures), although natural variability impacts both regional and global averaged temperatures (Delworth and Knutson 2000). The extent to which internally generated climate variability can lead to enhanced sea-level rise deserves further investigation. If the apparent impact during the first half of the 20th century was repeated in the future, it would increase projections for the 21st century by the order of 20 mm. However this additional sea-level rise will enter the calibrations of SEMs that use global averaged temperatures (or radiative forcing) and thus will impact the SEM projections.
The range of the model simulations over the three periods, and particularly since 1961 and 1990, encompasses the observed sea-level rise with the model mean within 20% (about 10% since 1990) of the observed rise. Experience with multi-model ensembles is that they generally outperform individual models (Weigel et al 2008, 2010), but specific results are not available for sea level. The agreement of observations with the model mean represents a significant improvement since the IPCC TAR (Church et al 2001) and AR4 (Hegerl et al 2007) and is a reason for increased confidence in the next generation of global mean sea-level projections. This agreement also means that it should now be possible to attribute 20th century sea-level rise to the various climate forcings. Reasons for the improvement include allowance for the omission of volcanic forcing in the spin-up of the AOGCMs, more complete representation of the radiative forcing driving the AOGCMs, a larger initial glacier mass (Arendt et al 2012) and more complete observations of glacier mass loss (Cogley 2009). Also, the Marzeion et al glacier model is able to reconstruct observed glacier changes independent of the observations and is an important part of the improved representation of 20th century sea-level rise.
Significant challenges remain. It is likely that the model spread does not cover the full range of possibilities because of systematic uncertainties that are common to many models. Hence, the model spread found here (about 40% of the observed rise for the 20th century and more than 50% since 1961) may underestimate the full uncertainty, particularly as it was not possible to include models of the ice sheet components. The observational estimates of ice sheet contributions since 1993 further close the gap between the observed and modelled sea-level rise to 10% or better. This evaluation is also incomplete as the ice sheet contributions to date are only a small fraction for the potential longer-term contributions. Careful comparison of the new generation of ice sheet simulations with observations is required to critically evaluate them.
Chambers et al (2012) argue there is an apparent 60 year cycle in the observed sea-level record. Similar variability is present in the forced simulations of the first half of the 20th century but is enhanced when the additional glacier contributions are included in the sum of terms. For the latter half of the 20th century, the observed minimum in the rate of sea-level rise in the 1960s (a deceleration from 1940 to 1970) and the subsequent increase in rate to about twice the 20th century average at the end of the record is present in the forced sea-level estimates. This increase is principally in response to increasing greenhouse gas concentrations and a combination of changing volcanic forcing and tropospheric aerosol loading, leading to a larger ocean thermal expansion and increased glacier melting. There is an additional contribution of less than 20% from anthropogenic interference in the hydrological cycle (figures 1(c) and (d)). Thus, the observed increased rate of rise since 1990 is not part of a natural cycle but a direct response to increased radiative forcing (both anthropogenic and natural) of the climate system. This radiative forcing will continue to increase with ongoing greenhouse gas emissions. The simulation of the observed 20th century sea-level rise and its variability within the uncertainties is a reason for increased confidence in projections of 21st century sea-level rise in future projections.
Acknowledgments
We acknowledge the World Climate Research Programme's Working Group on Coupled Modelling, which is responsible for CMIP, and we thank the climate modelling groups for producing and making available their model output. For CMIP the US Department of Energy's Program for Climate Model Diagnosis and Intercomparison provides coordinating support and led development of software infrastructure in partnership with the Global Organization for Earth System Science Portals. This paper is a contribution to the Commonwealth Scientific Industrial Research Organization (CSIRO) Climate Change Research Program. JAC and DM were partly funded by the Australian Climate Change Science Program.