

Abstract
Urbanization will place significant pressures on biodiversity across the world. However, there are large uncertainties in the amount and location of future urbanization, particularly urban land expansion. Here, we present a global analysis of urban extent circa 2000 and probabilistic forecasts of urban expansion for 2030 near protected areas and in biodiversity hotspots. We estimate that the amount of urban land within 50 km of all protected area boundaries will increase from 450 000 km2 circa 2000 to 1440 000 ± 65 000 km2 in 2030. Our analysis shows that protected areas around the world will experience significant increases in urban land within 50 km of their boundaries. China will experience the largest increase in urban land near protected areas with 304 000 ± 33 000 km2 of new urban land to be developed within 50 km of protected area boundaries. The largest urban expansion in biodiversity hotspots, over 100 000 ± 25 000 km2, is forecasted to occur in South America. Uncertainties in the forecasts of the amount and location of urban land expansion reflect uncertainties in their underlying drivers including urban population and economic growth. The forecasts point to the need to reconcile urban development and biodiversity conservation strategies.
Export citation and abstract BibTeX RIS

Content from this work may be used under the terms of the Creative Commons Attribution-NonCommercial-ShareAlike 3.0 licence. Any further distribution of this work must maintain attribution to the author(s) and the title of the work, journal citation and DOI.
1. Introduction
By 2030, 60% of all humanity—nearly 5 billion people—is expected to live in urban areas [1]. Worldwide, urban land is growing at rates at least twice as fast as urban population, and in some places, three and four times faster [2, 3]. A recent study suggests that more than half of the urban land cover on Earth by 2030 will be built during the first three decades of the 21st century [4]. While there are uncertainties around the forecasts of urban population growth [5], there is even greater uncertainty about where and how much urban expansion will take place in different parts of the world over the next few decades. How the magnitudes of future urban expansion will vary across the world have important implications for protected areas (PAs) and biodiversity.
The relationship between urbanization and biodiversity is multifaceted and complex [6]. Some urban areas have high local species richness (albeit at the cost of native species) while others do not [6, 7]. The expansion of urban areas often alters habitat configuration and connectivity with potentially adverse impacts on species dispersal [8]. Urbanization is also a major threat to endemic species due to increased incidence of colonization by introduced species [7]. Moreover, urban expansion may lead to habitat fragmentation, which may also lead to genetic or demographic isolation [9]. Thus, it is not only the size of the urban areas but also their spatial configuration and heterogeneity in urban land use that matter for biodiversity [10, 11].
Globally, a literature review identified twenty-two urban-related effects on PAs, two-thirds of which are found to occur within 50 km of urban areas [12]. The same study suggests that, on top of thousands of PAs that are already impacted by urban areas, many more may be added by 2030. Almost 90% of PAs likely to be impacted by future urbanization are in rapidly developing low- and moderate-income countries [13]. Local case studies show that urban expansion in and near critical habitats is ubiquitous both in developing [14–16] as well as developed regions [17–19]. In short, studies suggest that future urban land expansion will place significant pressures on biodiversity. However, there are large uncertainties involved in these estimates of future urban land expansion. Some of these uncertainties are addressed through scenario analyses [13, 20], which, although informative, do not adequately quantify the uncertainty [21]. Moreover, most global level analyses of future urban land expansion thus far relied solely on population growth forecasts. Therefore, we still lack a probabilistic, spatially explicit understanding of the uncertainties of future urban expansion and subsequent implications on areas that matter for biodiversity.
Towards addressing this knowledge gap, we recently reported the most likely (i.e., with >75% probability) areas that will urbanize within individual biodiversity hotspots [4], one of several conservation prioritization concepts [22] that has been widely embraced by conservation agencies but also attracted controversy and criticism [23–25]. Here we use a different approach and analyze forecasted urban expansion near PAs with International Union for Conservation of Nature (IUCN) designation and complement these results with forecasted urban expansion in biodiversity hotspots. IUCN-PAs and biodiversity hotspots differ in three important aspects: Unlike biodiversity hotspots, IUCN-PAs contain areas with clearly defined boundaries, have formal management and protection measures in place, and officially serve the purpose of long-term conservation of nature with associated ecosystem services and cultural values [26]. Nevertheless, land changes including urban expansion near PAs can have indirect effects on them, some of which can be significant [27, 28]. Here we examine three questions complementary to those reported in Seto et al [4]: (1) What are the most likely magnitudes of urban expansion near IUCN-PAs and in biodiversity hotspots by 2030? (2) How will uncertainty in the drivers of urbanization such as population and economic growth influence the rates and magnitudes of forecasted urban expansion near PAs and in biodiversity hotspots by 2030? (3) What are the implications of the forecasted urban expansion for conservation of biodiversity regionally and globally?
2. Methodology: data and global urban forecasting framework
2.1. Conceptual framework for forecasting urban land expansion
Numerous studies show that two of the underlying drivers of urban land expansion are population and economic growth [2, 29, 30]. However, history has shown that population growth projections can be highly inaccurate [31]. Likewise, forecasts of economic activity and growth are fraught with similar issues [32]. These uncertainties will influence how much and where urban land change will occur. In this study, we adopt a probabilistic framework to account for the uncertainties in primary drivers of urban land expansion. A detailed summary of our modeling approach and its data sources have been presented elsewhere [4]. Here, we provide a concise overview of our analytical approach.
We use Monte Carlo techniques to generate 1000 spatially explicit simulations of urban growth out to 2030 for 16 geographic regions, broadly based on the United Nations (UN)-defined world regions (table S1 available at stacks.iop.org/ERL/8/014025/mmedia). We develop the spatially explicit forecasts in two phases. In the first phase, for each region, we generate 1000 realizations of aggregate amount of urban expansion (figure 1(a)). To this end, we first fit probability density functions (pdfs) for population and GDP projections, one of each for each region. Then, for each region, we randomly draw 1000 values from each of the corresponding pdfs of forecasted GDP and urban population. In the second phase, we use a theoretically sound land change model to simulate spatial distribution of urban expansion in each realization (figure 1(b)). This model is developed from a well-established spatially explicit grid-based land change model, GEOMOD [33]. Our model uses slope, distance to roads, population density, and land cover as the primary drivers of land change and allocates urban expansion across each region. The initial year is year 2000.

Figure 1. Methodological approach for simulating (a) the amount and (b) the spatial pattern of urban land in 2030.
Download figure:
Standard image2.2. Forecasting global urban expansion out to 2030
In the first phase of our analysis, we project the magnitude of urban land in 2030 for each region (figure 1(a)). Following the literature, we assume that economic activity, proxied by GDP, and population largely determine the size of urban land expansion. In the first step, we forecast GDP per capita by randomly drawing a value from the forecasted GDP distribution and another from the forecasted population distribution. We assume that the probability distribution for GDP is uniform. We use minimum and maximum values from the IPCC AR4 SRES scenarios [34]. We derive the distribution for forecasted population using the UN variants [35] and the corresponding uncertainty estimates as reported in the US National Research Council (NRC) study, Beyond Six Billion [36]. In the second step, we forecast the urban land per capita that is due only to the change in population by dividing the forecasted urban population by the mean urban population density. We derive the mean from the empirical distribution of urban population density as reported by the Global Rural Urban Mapping Project (GRUMP) by Socio-Economic Data and Applications Center (SEDAC) at the Center for International Earth Science Information Network (CIESIN) [37]. In the third step, we incorporate GDP per capita to derive the final forecasted urban land per capita. In the last step, we forecast the size of urban land in 2030 by multiplying the forecasts for urban land per capita and urban population.
In the second phase, we allocate the forecasted urban land across the landscape (figure 1(b)) using the global urban land circa 2000 from NASA's Moderate Resolution Imaging Spectroradiometer (MODIS) land cover product as the starting point [38]. To generate a spatially explicit forecast of urban expansion, we use a land change model with inputs theorized to influence urban growth [4]. Among them is an exclusion layer composed of IUCN-PAs. Since we only have a single date urban map, the model generates a suitability map based on all the input maps. Then, it generates a histogram that records the amount of urban land in each suitability class, ranks these suitability classes, and allocates urban expansion accordingly. This generates a spatially explicit forecast of urban expansion. The model specification can significantly affect forecasts. To focus on the uncertainty in the drivers of urban expansion, we keep the model specification the same across all 1000 simulations (see supplementary information available at stacks.iop.org/ERL/8/014025/mmedia).
2.3. Urban expansion near protected areas (PAs) and in the biodiversity hotspots
For the PA analysis, we first quantify the urban land in IUCN-PAs circa 2000. Then, we analyze the forecasted urban expansion by 2030 up to a distance of 10, 25, and 50 km from their perimeters. 10 km is the nearest distance we can reasonably assess considering the spatial resolution of our analysis; 50 km is taken from the literature as a reasonable first-order estimate for the distance to capture ecological interactions between a PA and its surroundings [12, 28]. We use 25 km distance to track the trends in urban lands going from 10 km distance to 50 km distance. Since the spatial resolution of our study is 5 km, PAs with areas smaller than 25 km2 do not show up in our analysis. Most of these PAs are of IUCN class V–VI, some of which are small parks nearer to cities. We only consider urban expansion around IUCN-PAs because we assume perfect enforcement of the formal regulations that do not permit urban expansion within these PAs. Therefore, our findings are conservative.
In addition to the PAs with clearly defined boundaries under legal protection, we also analyze urban expansion patterns in the biodiversity hotspots by geographic region. In contrast to the PAs which are often small in size, the global biodiversity hotspots [39, 40] are large regions, some encompassing multiple continents, with many endemic species facing threats of habitat loss and degradation. To quantify the forecasted urban expansion and associated uncertainty in biodiversity hotspots in each region, we overlay individual urban expansion forecasts with biodiversity hotspot maps by region. We focus only on the terrestrial portions of the biodiversity hotspots.
3. Results
We present the urban land cover in and near PAs and in biodiversity hotspots around the world both circa 2000 and as forecasted to 2030. We present the results of probabilistic urban expansion forecasts in the form of box-plots where we report the minimum, maximum, mean as well as the 25th and 75th quartiles of 1000 Monte Carlo runs, by geographical region, for PAs and for biodiversity hotspots. For simplicity, we report in the text only the means of the forecasts of urban expansion along with the associated standard deviations. Across the world, we forecast that the total urban land will increase by more than three times to 2300 000 ± 150 000 km2 in 2030 (table S2 available at stacks.iop.org/ERL/8/014025/mmedia).
3.1. Protected areas (PAs)
Globally, 32 000 km2 of PAs were already urbanized circa 2000, corresponding to 5% of global urban land. In Europe, where there is an extensive PA network, more than 19 000 km2 of PAs were already urbanized circa 2000 (figure S1 available at stacks.iop.org/ERL/8/014025/mmedia). Put another way, 13% of its total urban land were located in PAs. China and South America also had substantial amounts of urban land within their PAs with 4500 km2 and 2800 km2, respectively (i.e., 6% and 3.5% of their respective urban lands).
Circa 2000, there were 100 000 km2 of urban land within 10 km of all PAs around the world (15% of the global urban land); within 50 km of PAs, this amount was over 450 000 km2, nearly 70% of the global urban land. Regions that have high percentage of urban populations such as Northern America and Western Europe and Eastern Europe had the most urban land within close proximity of their respective PAs (figure 2(a); figure S2(a) available at stacks.iop.org/ERL/8/014025/mmedia). Western Europe had the most urban land within 10 km of PAs (over one third of its total urban land) whereas Northern America had the most urban land within 25 and 50 km of PAs (figures 2(a)–(b)). Rapidly urbanizing China also had large amount of urban land within close proximity to PAs. Overall, four and 11 out of the 16 regions had 50% or more of their urban land within 25 km and 50 km of PAs, respectively (figure 2(b); figure S2(b) available at stacks.iop.org/ERL/8/014025/mmedia). On the other hand, in almost all regions except Eastern Asia and Western Europe, the percentage of lands that were urban within the 10, 25, and 50 km-wide zones around the PAs was well below 2% circa 2000 (figure 2(c)).
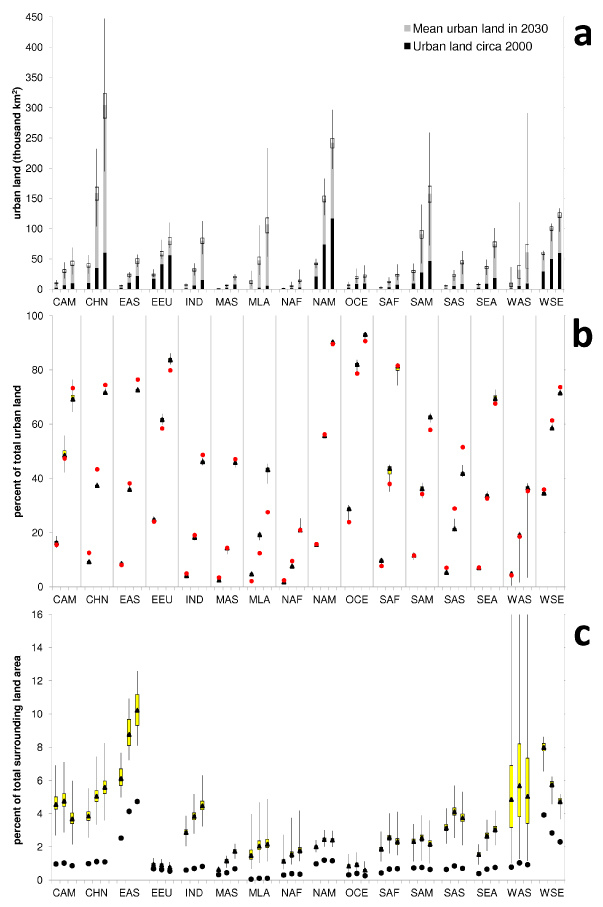
Figure 2. (a) Urban extent, (b) percentage of total urban extent, and (c) percentage of total surrounding land area that is urban, within a distance of, from left to right, 10, 25, and 50 km of PAs by geographic region circa 2000 (•) and as forecasted in 2030.
Download figure:
Standard imageBy 2030, the urban lands near PAs increase substantially in almost all the regions (figures 2(a)–3). Most notably, China will most likely surpass Northern America and Western Europe in urban land within 25 km and 50 km of their respective PAs. China's urban land within 25 km and 50 km distance of its PAs increase, respectively, to 160 000 ± 50 000 km2 and 300 000 ± 93 000 km2. These changes correspond to an increase of 4.5 ± 1.5 times in 30 years. The largest proportional change, however, will likely be in Mid-Latitudinal Africa; its urban land near PAs increase 20 ± 5 times by 2030. In contrast, the rate of increase is relatively small in Northern America, South America, Western Europe, and China. Nevertheless, the urban lands near PAs in these regions are still likely to increase significantly.

Figure 3. (a) Mean and (b) standard deviation of forecasted urban extent within 50 km of PAs by geographic region in 2030. Urban extent circa 2000 and PAs are also shown.
Download figure:
Standard imageTaking the forecasted uncertainties into account, for all regions except Mid-Latitudinal Africa and Southern Asia, there is little or no change from 2000 to 2030 in the percentage of total urban land that are near PAs (figure 2(b)). Across all three distances, we forecast the percentage to significantly increase for Mid-Latitudinal Africa and decrease for Southern Asia. Four regions that were already largely urban in 2000, Eastern Europe, Northern America, Oceania, and Western Europe, are forecasted to continue having more than 50% of their respective total urban lands within 25 km of their PAs in 2030.
In 2030, in about a third of the regions, urban areas are expected to cover 4% or more of the lands within 25 and 50 km-wide zones around PA boundaries (figure 2(c)). Western Europe is forecasted to have the largest urban percentage within 10 km-wide zone whereas Eastern Asia is forecasted to have the largest urban percentage within 25 km-wide and 50 km-wide zones. Western Asia, Central America, and China also have large percentages of lands within these zones expected to be urban; however, there is very large variation in the forecasts for Western Asia.
3.2. Biodiversity hotspots
Seven regions had more than half of their respective urban land area circa 2000 in biodiversity hotspots: Southeastern Asia, Eastern Asia, Central America, Mid-Asia, Southern America, Western Asia, and North Africa (figure 4; figure S3 available at stacks.iop.org/ERL/8/014025/mmedia). Nearly all the urban land in Southeastern Asia (27 000 km2) was located in biodiversity hotspots. South America had the most urban land (about 46 000 km2) in biodiversity hotspots and this corresponded to almost 60% of the total urban land in the region. India had the least amount and smallest percentage of urban land in biodiversity hotspots, about 1400 km2 and 4.5%, respectively.
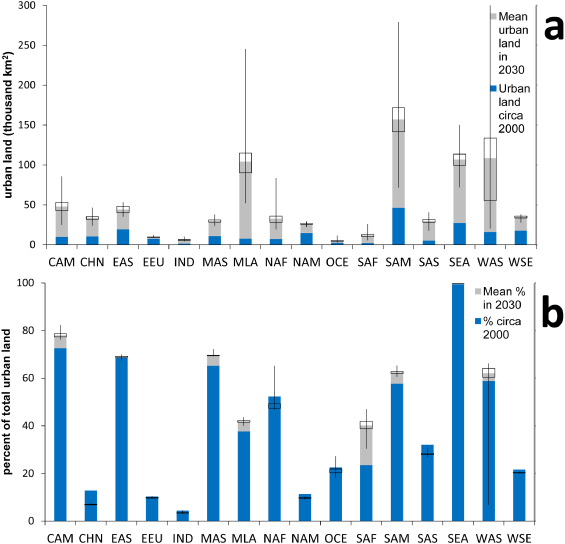
Figure 4. (a) Urban extent and (b) percentage of total urban extent in biodiversity hotspots by geographic region circa 2000 and as forecasted in 2030.
Download figure:
Standard imageBy 2030, the largest increase in the amount of urban land in biodiversity hotspots is expected to be in South America (an increase by more than 100 000 ± 25 000 km2) (figure 4(a)). This corresponds to nearly 3.5 ± 0.5 fold increase in urban land in the region's biodiversity hotspots. We forecast the largest proportional increase (about 14 ± 3 fold) to be in Mid-Latitudinal Africa. The percentage of urban lands in the biodiversity hotspots of Southern Africa shows the largest increase and will nearly double by 2030 (figure 4(b)). Other regions that show significant increases in the percentage of total urban land within their respective biodiversity hotspots are Mid-Latitudinal Africa, Central America, Mid-Asia, and South America. Of the rest, China exhibits the largest decrease from 13% to 8% (± 0.3%). While this would seem to suggest less pressure from direct urban land cover change in China relative to other regions, the amount of urban land in the biodiversity hotspots in China is still forecasted to increase by about 23 400 ± 2600 km2 (figure 4(a)).
4. Discussion
Our findings suggest that there will be substantial growth in urban land across the world near PAs in the next couple of decades (figure 3). In general, the largest increases in the amount of urban land near PAs are forecasted to take place in developing countries and emerging economies. The greatest increases in urban land around the PAs will take place in China with the amount of urban land increasing as much as 3–7 times over 30 years. The PA network of the country is much more extensive in the eastern and central parts of the country which will inevitably be encroached upon by future urban expansion. For example, our forecasts imply that the Wolong Nature Reserve, home of the endangered giant panda (Ailuropoda melanoleuca) and located within the Mountains of Southwest China biodiversity hotspot, may see significant urban growth within 50 km of its boundary. Yangtze Nature Reserve, surrounded by several urban centers along the lower reaches of Yangtze River is forecasted to have similarly large increases of urban land within 50 km of its boundaries in 30 years. These results point to the urgent need for effective land and PA management in China in the next few decades. This will be challenging given the existing state of the country's biodiversity protection regime and limited human and financial resources [41, 42].
Similarly in South America, Mid-Latitudinal Africa, India, and Southeast Asia, the developing regions with the largest forecasted magnitudes of urban expansion near PAs after China, effective governance and management of PAs and surrounding lands will be challenging due to weak institutional capacity and lack of adequate financial resources [43, 44]. However, this challenge is especially acute for Mid-Latitudinal Africa that is forecasted to experience the greatest proportional increases in urban land. For example, according to our forecasts, the urban land within 50 km of the Kilimanjaro National Park is expected to increase primarily due to rapid urbanization in and around Moshi, Tanzania—at the foot of iconic Mount Kilimanjaro, part of the Eastern Afromontane hotspot.
For many regions, how urbanization will affect PAs will depend on the effectiveness and synergy of land use, conservation, and urbanization policies. Even in developed countries, the issue of effective governance of lands near PAs for preservation of ecosystem functioning and conservation of biodiversity remain unresolved. In the US, having a formal conservation mechanism that would allow managing lands around PAs towards safeguarding them against unwanted influences remain unaccomplished [45] due to various political and cultural reasons, one of which is the fragmented jurisdictions of several bodies [46]. Another is the lack of coordination between agencies responsible for governing PAs and the actors who govern the lands around PAs [47].
Although there are methodological differences between our study and that of McDonald et al [12], a comparison between the findings of this study and theirs reveal two important points. First, McDonald et al (2009) find the percentage of PAs within 10 km of urban agglomerations in the US and Australia to be virtually constant from 1995 to 2030. In comparison, we forecast that the urban land within 10 km of PAs in North America and Oceania will increase, respectively, 2 ± 0.1 and 2.7 ± 0.4 times between 2000 and 2030 (figure 2(a)). Together, these findings suggest that the urban land within 10 km of PAs will increase without much change in the percentage of urban agglomerations that are within 10 km of PAs. The implication is that in these two countries, the increase in urban land will continue to be concentrated near certain PAs. Second, in China, Southeast Asia, and Mid-Latitudinal Africa, both studies expect a greater number of PAs to experience large increases in urban land nearby.
Our findings show that there is substantial variation in the rate and amount of forecasted urban expansion in biodiversity hotspots across geographic regions (figure 4) as well as across individual hotspots (figure S4 available at stacks.iop.org/ERL/8/014025/mmedia). Moreover, within each hotspot, not every location is equally critical for the conservation of threatened endemic species and there may be great heterogeneity in the spatial distribution of biodiversity [48–50] and the quality of the remaining habitats [40]. Our forecasts on urban expansion in the biodiversity hotspots suggest that establishing effective conservation strategies will require coordinated efforts among multiple cities, provinces, and even countries that share the same hotspots [51, 52].
Overall, our findings point to the need for more detailed national or regional analyses. This is especially the case for regions with substantial forecasted urban expansion near PAs and in biodiversity hotspots (i.e., China, Mid-Latitudinal Africa, South America, Western Asia, and Southeast Asia). These regions have arguably the most at stake in terms of direct impacts of urban expansion on biodiversity.
The results highlight the need to consider future urban expansion and associated uncertainties in conservation planning. However, few studies explicitly consider future land change [53] or even multiple futures [54]. Our probabilistic forecasts allow evaluating to what extent the uncertainties in various drivers of urban expansion may affect the amounts and locations of urban expansion across the world. For example, while we project that the urban land near PAs in Western Asia will increase, on average, more than five times, it may turn out to be much higher depending on the change in demographic patterns in the region (figure 2(a)). Although there is also considerable uncertainty, the forecasted urban expansion near PAs in each of China, Mid-Latitudinal Africa, and South America may exceed that in Northern America by 2030. Similarly, the uncertainty in the forecasted urban land in some of the hotspots is particularly large. Part of the uncertainty in these forecasts is due to the amount of land that is suitable for urban expansion relative to the forecasted amount of urban expansion. If there is more suitable land than what is forecasted, there is more uncertainty in the location of urban expansion from one simulation to another. The uncertainties are also partly driven by the demographic and economic forecasts; thus, much depends on the specific demographic and economic trajectories these regions will follow by 2030. For example, China may boost its urban expansion by relaxing its one-child policy [55] whereas urban expansion in India may be stunted due to insufficient or inefficient infrastructure [56].
In general, for many of the regions, the levels of uncertainty in our forecasts are not large enough to change our main conclusions. However, for a small number of regions such as South America, Mid-Latitudinal Africa, and Western Asia the uncertainty is so large that drawing firm conclusions is elusive. For Western Asia, for example, it may be the region that experiences the first or the fifteenth largest expansion of urban land within 50 km of its PAs (figure 2(a)) or the first or the tenth largest expansion of urban land in a biodiversity hotspot (figure 4(a)), depending on how future population and GDP growth unfold.
Factors that we did not include in our study but may significantly influence regional and local urban land expansion include climatic factors, agricultural productivity, land use policies, international capital flows, and infrastructure investment [3]. For example, if agriculture in an area is more profitable than urban development for non-urban locations then the agricultural sector may suppress the rate of urban expansion. In Africa, Latin America, and Asia, the informal sector, which is not included in official GDP estimates, constitute a substantial share of the overall economic growth [57]. In addition, the forecasts of GDP growth differentiated by economic sector may provide more accurate forecasts of urban expansion. Manufacturing sector has larger land requirements compared to the service sector. Since the bulk of economic growth in middle-income countries is driven by the manufacturing sector, this may mean that influence of a unit of GDP growth on urban expansion would be higher for middle-income countries than for wealthier countries whose economies are dominated by the service sector.
Our analysis assumes no new road development and no change in population density across space. Transportation infrastructure development would have considerable impact on the spatial pattern of urban expansion but not on the amount of urban expansion in our model. However, investments in transport can induce additional travel demand and also spur leapfrog development. For example, major infrastructure projects such as the Delhi–Mumbai Industrial Corridor in India [58] may both increase the amount and significantly alter the spatial distribution of new urban land development. Likewise, changes in the spatial distribution of population density as mediated by infrastructure developments, large scale migrations, or various policies may or may not lead to more compact expansion of urban land cover than our forecasts. We did not consider different policy options that would encourage more or less compact urban expansion. While incorporating all such possibilities is not feasible in a single set of probabilistic forecasts at the global level they can be addressed by coupling a probabilistic framework such as ours with scenario analysis targeted to specific regions. Nevertheless, our results suggest a need for urbanization strategies that consider conservation of biodiversity [13, 59, 60]. Especially in the developing regions where we forecast the most urban expansion near PAs and in biodiversity hotspots, urbanization strategies can affect the form of urban expansion with significant consequences for biodiversity [59].
5. Conclusion
There is a growing call from researchers and policymakers to examine urbanization at the planetary scale [4, 61]. Our study presents a global analysis of future urban expansion in and around critical habitats for biodiversity and can inform national and regional level efforts at integrating conservation and urbanization strategies. By accounting for the uncertainty in the drivers of urban expansion, this analysis quantifies the magnitude of urban expansion forecasted to occur by 2030 and the associated uncertainty near protected areas and in biodiversity hotspots across different parts of the world. Despite the uncertainties in urbanization drivers, there is a clear signal that urban land cover change is likely to accelerate during the first three decades of the 21st century and that this will have significant impact on biodiversity. Therefore, these few decades present a critical window of opportunity to develop and implement more robust urbanization strategies that consider conservation explicitly.
Acknowledgments
This study was supported by NASA grant NNX11AE88G. We thank two anonymous referees, whose suggestions improved this manuscript. We thank Gil Pontius for providing the source code for the land change model, GEOMOD, and the Texas A&M Supercomputing Facility for providing computational resources.