

Abstract
Permafrost degradation exhibits striking and profound influences on the alpine ecosystem, and response characteristics of vegetation and soil environment to such degradation inevitably differ during the entire degraded periods. However, up to now, the related research is lacking in the Qinghai–Tibetan Plateau (QTP). For this reason, twenty ecological plots in the different types of permafrost zones were selected in the upstream regions of the Shule River Basin on the northeastern margin of the QTP. Vegetation characteristics (species diversity, community coverage and biomass etc) and topsoil environment (temperature (ST), water content (SW), mechanical composition (SMC), culturable microorganism (SCM), organic carbon (SOC) and total nitrogen (TN) contents and so on), as well as active layer thickness (ALT) were investigated in late July 2009 and 2010. A spatial–temporal shifts method (the spatial pattern that is represented by different types of permafrost shifting to the temporal series that stands for different stages of permafrost degradation) has been used to discuss response characteristics of vegetation and topsoil environment throughout the entire permafrost degradation. The results showed that (1) ST of 0–40 cm depth and ALT gradually increased from highly stable and stable permafrost (H-SP) to unstable permafrost (UP). SW increased initially and then decreased, and SOC content and the quantities of SCM at a depth of 0–20 cm first decreased and then increased, whereas TN content and SMC showed obscure trends throughout the stages of permafrost degradation with a stability decline from H-SP to extremely unstable permafrost (EUP); (2) further, species diversity, community coverage and biomass first increased and then decreased in the stages from H-SP to EUP; (3) in the alpine meadow ecosystem, SOC and TN contents increased initially and then decreased, soil sandy fractions gradually increased with stages of permafrost degradation from substable (SSP) to transitional (TP), and to UP. Meanwhile, SOC/TN storages increased in the former stage, while they decreased in the latter stage. This study indicated that the response characteristics of vegetation and soil environment varied throughout the entire permafrost degradation, and SW was the dominant ecological factor that limited vegetation distribution and growth. Therefore, SSP and TP phases could provide a favourable environment for plant growth, mainly contributing to high SW.
Export citation and abstract BibTeX RIS

Content from this work may be used under the terms of the Creative Commons Attribution-NonCommercial-ShareAlike 3.0 licence. Any further distribution of this work must maintain attribution to the author(s) and the title of the work, journal citation and DOI.
Nomenclature
| QTP | Qinghai–Tibetan Plateau |
| SW | Soil water content |
| SCM | Soil culturable microorganism |
| TN | Total nitrogen |
| TND | Total nitrogen density |
| ALT | Active layer thickness |
| Ecb | Electrical conductivity |
| H' | Shannon–Weiner index |
| H-SP | Highly stable and stable permafrost |
| SP | Stable permafrost |
| TP | Transitional permafrost |
| EUP | Extremely unstable permafrost |
| ST | Soil temperature |
| SMC | Soil mechanical composition |
| SOC | Soil organic carbon |
| SOCD | Soil organic carbon density |
| SOM | Soil organic material |
| MAGT | Mean annual ground temperature |
| S | Species richness |
| Jsi | Evenness index |
| HSP | Highly stable permafrost |
| SSP | Substable permafrost |
| UP | Unstable permafrost |
1. Introduction
Permafrost, as one of the most important cryospheric components, is widespread in the high-latitude and high-altitude regions and covers roughly a quarter of the land area in the Northern Hemisphere (Zhang et al 1999), which serves as a sensitive indicator of climate change (Pavlov 1994, Guglielimin and Dramis 1999). The Qinghai–Tibetan Plateau (QTP), with an average elevation of more than 4000 m a.s.l., is the youngest and highest plateau on Earth (Li and Zhou 1998). Permafrost underlies approximately 1.3 × 10⁶ km2 in the QTP (Nan et al 2005), equivalent to 70.6% of the plateau land area (Zhou et al 2000). This is the largest distribution of mountain permafrost in the mid-low-latitude and high-altitude zones.
Global warming has triggered permafrost degradation over the past several decades, not only in the circum-arctic but also in the QTP. The direct impact of climate warming on permafrost are the rise of ground temperature (Osterkamp 2005, Smith et al 2005, Walsh 2005, Isaksen et al 2007, Wu and Zhang 2008, Christiansen et al 2010, Romanovsky et al 2010b, 2010a, Smith et al 2010) and the increase of active layer thickness (ALT) (Overduin and Kane 2006, Christiansen et al 2010, Romanovsky et al 2010b, Wu and Zhang 2010, Wu et al 2012). Without a doubt, such changes have the most significant influence on the alpine ecosystem in the permafrost zones. The short-term effect of permafrost degradation on the alpine ecosystem from seasons to decades showed that changes of active layer hydrothermal status directly alter soil water-heat transmission and storage conditions of soil moisture, and further affect the stability of the alpine ecosystem (Qin and Ding 2009). Notably, the high-cold ecosystem (alpine ecosystem) is extremely fragile (McGuire 2002, Christensen et al 2004). The upstream regions of the Shule River Basin on the northeastern margin of the QTP, as one of the three arid inland basins in the Hexi corridor of northwestern China (Wu et al 2009), are regarded as 'natural water areas' contributing to the distribution of continental glaciers and mountain permafrost (Chen et al 2011). Likewise, due to regional climate warming (Mu 2006), permafrost in this area has degraded in the past 15 years, based on remote sensing data (Xie et al 2010).
Recent studies exhibited that following permafrost degradation triggered by climate warming, the soil environment of the active layer, such as temperature, water content, mechanical composition, nutrient contents and carbon storage (Christensen et al 2004, Jorgenson et al 2006, Wang et al 2006, 2007, 2008, Guo et al 2007, Schuur et al 2007, Baumann et al 2009, Chen et al 2010, Yang et al 2010, Liu et al 2012), as well as vegetation characteristics of species composition and diversity, community coverage and biomass etc (Wang et al 2006, Guo et al 2007, Blok et al 2010, Beck and Goetz 2011, Chen et al 2011, Yi et al 2011, Bonfils et al 2012, Elmendorf et al 2012) have significantly changed in the alpine ecosystem. These changes, in turn, would properly exert a profound influence on the entire biosphere (Jorgenson et al 2001, Christensen et al 2004). Therefore, the soil environment and vegetation characteristics in permafrost zones, as well as their responses to permafrost degradation, have received great attention worldwide.
However, there is currently a lack of systematic research on the response characteristics of the vegetation and soil environment to the processes of permafrost in the QTP, especially in the upstream regions of the Shule River Basin. Consequently, the main goals of this study with regards to the upstream regions of the Shule River Basin were to: (1) identify characteristics of vegetation and topsoil environment in the different stages of permafrost degradation; (2) further discuss response characteristics of the vegetation and topsoil environment throughout the entire permafrost degradation based on spatial–temporal shifts. It is our hope that this work could provide a scientific reference for the restoration, conservation and sustainable development of the local ecological environment under the conditions of climate change.
2. Materials and methods
2.1. Study area and site description
The Shule River springs from the western part of Qilian Mountains on the northeastern margin of the QTP (figure 1). The study was undertaken in the upstream regions of the Shule River Basin, which is located between 96.2°–99.0°E and 38.2°–40.0°N in Tianjun County of Qinghai province, China. The study area is about 5123 km2, and the altitude ranges from 3400 to 4200 m. There are more than a dozen glaciers integrated in this area (Sheng et al 2010). The region belongs to a continental arid desert climate and is mainly controlled by westerly winds, with low annual mean air temperature and precipitation. The mean annual air temperature and precipitation ranged from −4.0 to −19.4 °C and 200–400 mm, respectively, over the period 1960–2010 (Yi et al 2011).
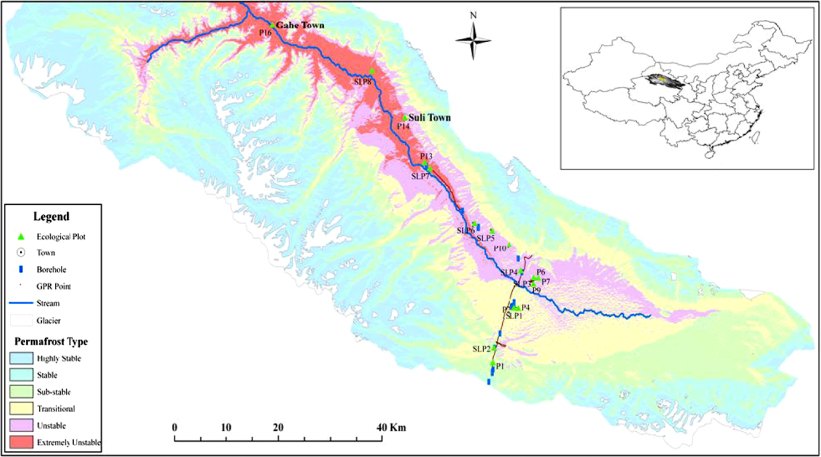
Figure 1. Spatial distribution of different permafrost types, ecological plots, ground-penetrating radar (GPR) points and borehole drillings in the upstream regions of the Shule River Basin.
Download figure:
Standard imageThe vegetation types mainly included periglacial vegetation, alpine marsh meadow, alpine meadow, alpine steppe, temperate steppe, desertified grassland and 'black-soil-beach' grassland (table 1). According to the Chinese soil classification system, the main soil types were cold calcic soils, frigid calcic soils, frigid frozen soils, felty soils and bog soils (Liu et al 2012). The permafrost on the northeastern margin of the QTP belongs to high-altitude permafrost and its distribution characteristics were distinct from high-latitude permafrost (Cheng and Wang 1982). The ground temperature is a good indicator of permafrost division and it could reflect the combined effect of zonal and regional factors on permafrost distribution (Cheng and Wang 1982). Consequently, six types of permafrost (also called six stages of permafrost degradation) with stability decline were divided according to values of mean annual ground temperature (MAGT) at a 15 m depth, which included highly stable permafrost (HSP, MAGT <− 5.0 °C), stable permafrost (SP, − 5.0 °C < MAGT <− 3.0 °C), substable permafrost (SSP, − 3.0 °C < MAGT <− 1.5 °C), transitional permafrost (TP, − 1.5 °C < MAGT <− 0.5 °C), unstable permafrost (UP, − 0.5 °C < MAGT < 0.5 °C), and extremely unstable permafrost (EUP, MAGT > 0.5 °C) (Li 2010).
Table 1. Number, location, dominant plants and types of vegetation plots in the upstream regions of Shule River Basin. PV: periglacial vegetation, AM: alpine meadow, AMM: alpine marsh meadow, DG: desertified grassland, BSBG: 'black-soil-beach' grassland, AS: alpine steppe, TS: temperate steppe, H-SP: highly stable and stable permafrost, SSP: substable permafrost, TP: transitional permafrost, UP: unstable permafrost, EUP: extremely unstable permafrost.
| Plot number | Longitude/latitude (°E/°N) | Elevation (m) | Dominant plants | Vegetation type | Permafrost type |
|---|---|---|---|---|---|
| SB5 | 96°30'21''/39°30'14'' | 4216 | Potentilla potaninii, Rhodiola algida var. tangutlca | PV | H-SP |
| SB4 | 96°30'09''/39°32'13'' | 4105 | Saussurea nigrescens, Potentilla potaninii | PV | H-SP |
| P1 | 98°16'15''/38°19'39'' | 4030 | Kobresia pygmaea, Carex moorcroftii | AM | SSP |
| SLP1/P3 | 98°18'31''/38°25'16'' | 3882 | Kobresia capillifolia, Carex moorcroftii | AM | TP |
| SLP2 | 98°16'14''/38°21'17'' | 4014 | Kobresia pygmaea, Kobresia humilis | AM | SSP |
| SLP4/P5 | 98°19'24''/38°28'33'' | 3890 | Carex moorcroftii, Stipa purpurea | AM | UP |
| P7 | 98°21'02''/38°27'58'' | 3877 | Kobresia pygmaea, Stipa purpurea | AM | TP |
| SLP5/P11 | 98°14'49''/38°32'29'' | 3936 | Stipa purpurea, Artemisia nanschanica | AM | UP |
| SLP3/P8 | 98°20'51''/38°27'59'' | 3863 | Kobresia tibetica, Carex parva | AMM | TP |
| P2 | 98°18'21''/38°25'24'' | 3890 | Saussurea arenaria, Ajania pallasiana | DG | TP |
| P4 | 98°19'00''/38°24'58'' | 3894 | Artemisia nanschanica, Polygonum sibiricum | DG | TP |
| P6 | 98°21'19''/38°28'07'' | 3870 | Poa annua, Polygonum sibiricum | BSBG | UP |
| P9 | 98°20'50''/38°27'48'' | 3859 | Polygonum sibiricum, Potentilla anserina | BSBG | UP |
| P10 | 98°17'14''/38°30'53'' | 3904 | Aster flaccidus, Ajania pallasiana | BSBG | UP |
| SLP6/P12 | 98°12'20''/38°33'02'' | 3832 | Stipa purpurea, Artemisia minor | AS | UP |
| SLP7 | 98°6'14''/38°37'55'' | 3740 | Poa pratensis, Stipa basiplumosa | AS | UP |
| P13 | 98°05'37''/38°38'11'' | 3750 | Stipa basiplumosa, Leymus secalinus | AS | EUP |
| P14 | 98°02'19''/38°42'44'' | 3780 | Stipa basiplumosa, Leymus secalinus | AS | UP |
| SLP8/P15 | 97°57'32''/38°46'31'' | 3636 | Stipa basiplumosa, Limonium aureum var. dielsianum | AS | EUP |
| P16 | 97°43'31''/38°50'12'' | 3448 | Achnatherum splendens, Artemisia nanschanica | TS | EUP |
2.2. Field investigation and samples collection
The vegetation types in this area were grouped using a vegetation map interpreted by the TM remote sensing data from 16 July 2010. Vegetation types and coverage in the different permafrost zones were obtained through overlaying distribution maps of permafrost and vegetation in ArcGIS 10.0 software. Two field investigations were conducted during the vigorous growth period in late July 2009 and 2010. Twenty ecological plots representing seven vegetation types were investigated along the Sukang and Shimeng roads in the upstream regions of the Shule River Basin (table 1). Due to road inaccessibility, none of the periglacial vegetation plots in the study area were selected. However, SB4 and SB5 plots located outside the studied boundary, but still in the upstream regions of the Shule River Basin (Chen et al 2011), were chosen because of their good accessibility and similarity in terms of periglacial ecosystem characteristics and permafrost types throughout the boundary area.
Firstly, five quadrats (50 cm × 50 cm) were randomly chosen to investigate vegetation type, community composition and structure (species name, number, height, coverage and frequency, as well as community coverage etc) in each plot. Community coverage was determined using a Tetracam Agricultural Digital Camera (ADC, Tetracam Inc., Chatsworth, CA, USA) along with visual estimation (Yi et al 2011). Secondly, the living aboveground biomass was harvested, and belowground (root) biomass was sampled in five soil cores (4.8 cm in diameter) per quadrat at a depth of 0–40 cm. In order to obtain root biomass, soil cores were crumbled by hand, passed through a sieve with 0.2 cm pore size after removing impurities, and then cleaned repeatedly. All materials were dried (24 h at 80 °C) and weighed. Biomass is the sum of aboveground biomass and belowground biomass. Thirdly, to determine soil mechanical composition (SMC) and nutrient contents, samples from each quadrat were collected by combining five soil cores (diameter of 4.8 cm) obtained in a X-shaped pattern and splitting them into 0–10 cm, 10–20 cm, 20–30 cm and 30–40 cm sections. Fourthly, soil samples for microorganism detection (0–20 cm) were collected by a soil borer (diameter of 3.8 cm, six times) at each quadrat, then stored in freezer boxes and transported to the laboratory. Finally, three soil pits at each plot were excavated to collect samples and determine the bulk density. Three replicates of soil samples were collected schematically at depths of 0–10 cm, 10–20 cm, 20–30 cm and 30–40 cm, using a cutting ring (volume of 100 cm3). Meanwhile, soil temperature (ST), soil water content (SW) and electrical conductivity (Ecb) were synchronously detected by a WET-2 sensor in each pit. The ALT data was derived from measured data of a Pulse EKKO PRO ground-penetrating radar in 2009 and borehole drilling in 2010. The data of ground temperature at 15 m depth came from Li (2010).
2.3. Analysis methods
Plant species diversity was estimated by species richness (S), Shannon–Weiner index (H'), and evenness index (Jsi) (Ma et al 1995, Wang et al 2010). S was represented by the number of species recorded at each plot. The calculation methods of H' and Jsi are described as follows:


where Pi denotes the relative importance value of the species i at each plot (Pi = (relative height+ relative coverage+ relative frequency)/3). In addition, the dominant plant at each plot is measured from species dominance (D = Pi∗100%).
The spread plate method was used to separate and estimate the quantity of soil culturable microorganisms (SCM). Bacteria, fungi and actinomycetes were cultivated on beef extract-peptone medium, PDA (Potato Dextrose Agar) and starch nitrate medium, respectively. After soil samples were air-dried and then hand-sieved through a 2 mm screen to remove roots and coarser skeleton, soil organic carbon (SOC) and total nitrogen (TN) contents were analysed using Walkley–Black and micro-Kjeldahal procedures, respectively (ISSCAS 1978, Nelson and Sommers 1982), and SMC was determined by the wet sieve method (Chaudhari et al 2008). The densities of SOC and TN (SOCD and TND) in each soil layer were calculated by their contents and bulk density. SOC and TN storages were estimated by the SOCD, TND and vegetation area, respectively (Liu et al 2012). All statistical analyses were conducted using SPSS 11.5 software.
3. Results
3.1. Vegetation characteristics in the different types of permafrost zones
Among six permafrost types in the upstream regions of the Shule River Basin (∼5123 km2), the distribution area of HSP and SP (abbreviated H-SP) were the largest (∼2093 km2), SSP was the second largest (∼1190 km2), TP and UP were the third (∼904 km2 and ∼621 km2, respectively), while EUP had the smallest area (∼316 km2) (table 2). The dominant vegetation types of the study area were periglacial vegetation, alpine meadow, alpine steppe and temperate steppe. The vegetation types in each of the permafrost types are different and inconsistent. Thus, we just give the studied vegetation type (included sampling sites) and their area percentages account for each permafrost type (table 2). The distribution of vegetation types in each permafrost type showed that periglacial vegetation was the dominant type in the HSP and SP zone and it covers about 53.8% of H-SP area (sum of HSP and SP area). About 20.8% of the SSP zone was covered by alpine meadow. Three vegetation types, including alpine meadow (∼17.6%), alpine swamp meadow (∼5.8%) and desertified grassland (∼2.3%) are distributed in the TP zone. Three vegetation types, including alpine steppe (∼26.1%), alpine meadows (∼11.5%) and 'black-soil-beach' grassland (∼3.9%), are distributed in the UP zone; the EUP zone was mainly covered by temperate steppe (∼54.6%) and alpine steppe (∼22.6%) (table 2).
Table 2. Vegetation characteristics of different types of permafrost zones in the upstream regions of Shule River Basin. (Note: H-SP: highly stable and stable permafrost, SSP: substable permafrost, TP: transitional permafrost, UP: unstable permafrost, EUP: extremely unstable permafrost, H': Shannon–Wiener index; S: species richness, Jsi: evenness index, C: community coverage, TB: biomass, PV: Periglacial vegetation, AM: alpine meadow, AMM: alpine marsh meadow, DG: desertified grassland, AS: alpine steppe, BSBG: 'black-soil-beach' grassland, TS: temperate steppe, SD: standard deviation.)
| Permafrost type | Area (km2) | Studied vegetation (percentagea, %) | Species diversity | C (%) (±SD) | TB (g m−2) (±SD) | ||
|---|---|---|---|---|---|---|---|
| H' (±SD) | S (±SD) | Jsi(±SD) | |||||
| H-SP | 2093 | PV (53.8) | 1.99 | 8.13 | 0.98 | 32.1 | 1310.14 |
| (0.06) | (0.76) | (0.01) | (1.2) | (302.52) | |||
| SSP | 1190 | AM (20.8) | 2.40 | 13.34 | 0.97 | 37.6 | 2469.04 |
| (0.26) | (3.82) | (0.02) | (1.7) | (551.37) | |||
| TP | 904 | AMM (5.8) | 1.84 | 8.12 | 0.93 | 49.8 | 5181.74 |
| AM (17.6) | (0.25) | (1.71) | (0.03) | (0.8) | (957.56) | ||
| DG (2.3) | |||||||
| UP | 621 | AM (11.5) | 1.72 | 7.28 | 0.93 | 27.7 | 2462.94 |
| AS (26.1) | (0.18) | (1.14) | (0.03) | (1.1) | (448.07) | ||
| BSBG (3.9) | |||||||
| EUP | 316 | AS (22.6) | 1.63 | 6.56 | 0.91 | 25.9 | 2985.28 |
| TS (54.6) | (0.15) | (1.39) | (0.02) | (0.8) | (275.63) | ||
aThe area percentages of studied vegetation account for area of different permafrost types.
Dominant plants of different vegetation types were as follows: Potentilla potaninii, Rhodiola algida var. tangutlca and Saussurea nigrescens in periglacial vegetation, Kobresia tibetica and Carex parva in alpine marsh meadow, species of the genus Kobresia, C. moorcroftii, Stipa purpurea and Artemisia nanschanica in alpine meadow, S. arenaria, Ajania pallasiana, A. nanschanica and Polygonum sibiricum in desertified grassland, Poa annua, P. sibiricum, P. anserine, Aster flaccidus and Ajania pallasiana in 'black-soil-beach' grassland, species of the genus Stipa, A. minor, Poa pratensis, Leymus secalinus and Limonium aureum var. dielsianum in alpine steppe, Achnatherum splendens and A. nanschanica in temperate steppe, respectively (table 1). Community coverage and biomass were the highest in the TP zone, whereas community coverage was the lowest in the EUP zone and biomass was the lowest in the H-SP zone (table 2). For species diversity, H' and S was highest in the SSP zone and lowest in the EUP zone, but Jsi was highest in the H-SP zone and lowest in the EUP zone.
3.2. Soil properties in the different types of permafrost zones
Based on the Chinese soil classification system and the result by Liu et al (2012), the area fractions of cold calcic, frigid calcic, frigid frozen, felty soils and bog soils were about 28.8%, 21.9%, 20.5%, 20.4% and 6.5%, respectively. Soil types were mainly frigid frozen soils in the H-SP zone, cold calcic soils in the SSP and EUP zones, bog, felty and cold calcic soils in the TP zone, and frigid calcic and cold calcic soils in the UP zone. In addition, ALT was lowest in the H-SP (∼1.5 m) zone and highest in the UP (∼3.2 m) zone (table 3). With respect to soil physicochemical properties of the active layer (0–40 cm) in the different types of permafrost zones, ST and Ecb were highest in the EUP zone and lowest in the H-SP zone, SW was highest in the TP zone but lowest in the H-SP zone. SMC exhibited that sandy fractions were highest in the H-SP zone and lowest in the EUP zone. Soil nutrient (SOC and TN) contents were highest in the EUP zone and lowest in the SSP zone. The quantities of SCM (0–20 cm depth; bacteria, fungi and actinomycetes) were highest in the H-SP zone and lowest in the TP zone (table 3). Moreover, SOC and TN storages of 0–40 cm depth in the different types of permafrost zones were estimated using the areas, SOCD and TND of the different vegetation types that were sampled in this study (table 3). SOC and TN storages were about 8.371 and 0.912 Tg (1 Tg = 1012 g), 1.401 and 0.173 Tg, 1.518 and 0.174 Tg, 1.901 and 0.188 Tg, 1.761 and 0.185 Tg in the H-SP, SSP, TP, UP and EUP zones, respectively.
Table 3. Soil environment in different types of permafrost zones in the upstream regions of Shule River Basin. H-SP: highly stable and stable permafrost, SSP: substable permafrost, TP: transitional permafrost, UP: unstable permafrost, EUP: extremely unstable permafrost, BT: bacteria, FG: fungi, AMs: actinomycetes, SW: soil water content, ST: soil temperature, Ecb: electrical conductivity, SOC: soil organic carbon, TN: total nitrogen, SOCD: soil organic carbon density, TND: total nitrogen density, ALT: active layer thickness, SE: standard error, SD: standard deviation.
| Permafrost type | Culturable microorganisms (0–20 cm, 108 cfu) | Water-heat conditions (0–40 cm) | Mechanical composition (%, 0–40 cm) | Nutrient contents (g kg−1, 0–40 cm) | Nutrient densities (kg m−2, 0–40 cm) | Storage (×1012 g, 0–40 cm) | ALT (m) (±SD) | |||||||||
|---|---|---|---|---|---|---|---|---|---|---|---|---|---|---|---|---|
| BT | FG | AMs | SW (%) | ST (°C) | Ecb (mS m−1) | Sandy | Silty | Clay | SOC | TN | SOCD | TND | SOC | TN | ||
| (±SE) | (±SE) | (±SE) | (±SD) | (±SD) | (±SD) | (±SD) | (±SD) | (±SD) | (±SD) | (±SD) | (±SD) | (±SD) | ||||
| H-SP | 1.61 | 1.03 | 1.22 | 9.1 | 5.9 | 1.9 | 77.4 | 16.2 | 6.4 | 14.95 | 1.63 | 7.44 | 0.81 | 8.371 | 0.912 | 1.50 |
| (0.06) | (0.07) | (0.09) | (0.6) | (0.6) | (2.3) | (17.1) | (1.4) | (0.3) | (7.54) | (0.67) | (1.42) | (0.23) | (0.14) | |||
| SSP | 1.21 | 0.19 | 0.32 | 30.5 | 14.4 | 18.8 | 41.1 | 41.8 | 17.2 | 11.65 | 1.43 | 5.66 | 0.70 | 1.401 | 0.173 | 2.45 |
| (0.05) | (0.02) | (0.02) | (0.7) | (3.8) | (1.8) | (1.4) | (1.3) | (2.7) | (6.20) | (0.51) | (0.14) | (0.05) | (0.21) | |||
| TP | 0.25 | 0.18 | 0.29 | 32.0 | 19.4 | 37.5 | 56.6 | 35.5 | 7.9 | 12.95 | 1.67 | 6.53 | 0.75 | 1.518 | 0.174 | 2.78 |
| (0.03) | (0.03) | (0.02) | (0.2) | (4.4) | (4.9) | (3.6) | (2.7) | (0.9) | (4.8) | (0.32) | (4.68) | (0.48) | (1.03) | |||
| UP | 0.27 | 0.29 | 0.42 | 10.3 | 20.0 | 36.1 | 58.1 | 28.0 | 13.9 | 15.68 | 1.55 | 7.38 | 0.73 | 1.901 | 0.188 | 3.20 |
| (0.02) | (0.04) | (0.02) | (0.4) | (3.3) | (1.9) | (3.7) | (6.0) | (2.4) | (4.58) | (0.39) | (2.12) | (0.21) | (0.58) | |||
| EUP | 0.40 | 0.22 | 0.47 | 18.8 | 20.3 | 148.9 | 33.2 | 48.7 | 18.1 | 16.14 | 1.72 | 7.22 | 0.76 | 1.761 | 0.185 | — |
| (0.02) | (0.03) | (0.04) | (0.3) | (1.0) | (12.9) | (1.8) | (2.4) | (4.2) | (4.48) | (0.70) | (3.16) | (0.27) | ||||
3.3. Vegetation and soil characteristics of the alpine meadow ecosystem under different permafrost stability conditions
Alpine meadow was distributed in the SSP, TP and UP zones (table 2), which provided a chance for us to study the differences of vegetation and soil characteristics in the alpine meadow ecosystem under different permafrost stability conditions. The highest and lowest community coverage and biomass were found in the TP and UP zone, and the highest and lowest plant species diversity (S,H' and Jsi) were observed in the SSP and TP zone, respectively (figure 2). Soil physicochemical variations of 0–40 cm depth are shown in figures 3((A)–(C)). The highest and lowest ST and sandy fractions were found in the UP and SSP zone, respectively. The highest and lowest SW and Ecb were found in the TP and UP zone, respectively, but with the quantities of fungi and actinomycetes, the opposite is true (figure 3(D)). However, the highest and lowest quantities of bacteria were found in the SSP and UP zone, respectively (figure 3(D)). Moreover, the highest and lowest SOC and TN contents were observed in the TP and SSP zone, respectively.

Figure 2. Vegetation characteristics of different permafrost types in alpine meadow. (C: community coverage, TB: biomass, H': Shannon–Weiner index, Jsi: evenness index, S: species richness). Error bars express standard deviation from the mean.
Download figure:
Standard image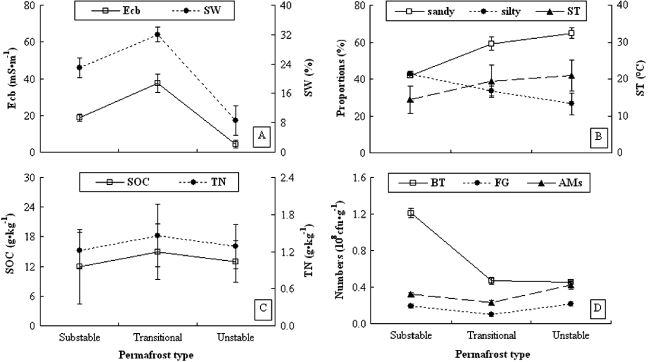
Figure 3. Soil physicochemical properties of 0–40 cm depth ((A)–(C)) and soil culturable microorganisms (SCM) of 0–20 cm depth (D) of different permafrost types in alpine meadow. (Ecb: electrical conductivity, SW: soil water content, ST: soil temperature, SOC: soil organic carbon, TN: total nitrogen, BT: bacteria, FG: fungi, AMs: actinomycetes). Error bars express standard deviation from the mean.
Download figure:
Standard imageThere were significant statistical correlations between SW and community coverage (R2 = 0.78,P < 0.05), and biomass (R2 = 0.62,P < 0.05) in the alpine meadow ecosystem (figure 4). With the increase of ALT, ST significantly increased (R2 = 0.90,P < 0.01), while SW initially increased and then decreased (R2 = 0.78,P < 0.05) (figure 5). In addition, the SOCD and TND for a thickness of 0.40 m were 5.76 and 0.60 kg m−2, 7.15 and 0.70 kg m−2, 6.62 and 0.65 kg m−2 in the SSP, TP and UP zone, respectively. And the areas of alpine meadow are approximately 248, 159 and 71 km2 in the SSP, TP and UP zone (table 2). Thus, SOC and TN storages of 0–40 cm depth for the area of ∼159 km2 increased by about 0.221 Tg and 0.016 Tg, respectively, in the former stage of permafrost degradation with the stability decline from the SSP to TP. In contrast, SOC and TN storages of ∼71 km2 in area decreased by approximately 0.038 Tg and 0.004 Tg in the stage from TP to UP, respectively.
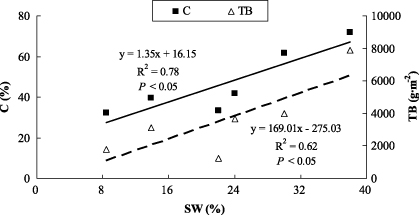
Figure 4. Correlation between soil water content (SW) and community coverage (C), and biomass (TB) of different permafrost types in alpine meadow.
Download figure:
Standard image
Figure 5. Correlation between active layer thickness (ALT) and soil temperature (ST), and soil water content (SW) of different permafrost types in alpine meadow.
Download figure:
Standard image4. Discussion
4.1. The main characteristics of permafrost degradation to climate warming
The Fourth Assessment Report of the Intergovernmental Panel on Climate Change (IPCC) indicated that the global average surface temperature had increased by about 0.74 ± 0.18 °C over the past hundred years (IPCC 2007). Permafrost, as a product of cold climate, is extremely sensitive to climatic change. Due to the warming climate, permafrost in the high-latitude regions of the Northern Hemisphere have seriously degraded during the past several decades based on the monitoring data, and degradation processes are mainly manifested in the rise of ground temperature and the increase of ALT (Osterkamp 2005, Walsh 2005, Overduin and Kane 2006). Observational data from the site of Norman Wells in the discontinuous permafrost zones of the Mackenzie corridor showed that ground temperature at a depth of 12 m had increased on average at about 0.2 °C/decade from 1982–2008 (Smith et al 2010). Results from Juvvasshøe in a mountainous area, in southern Norway, indicated that ground temperature had increased by ∼0.3 °C at 15 m depth from 1999 to 2006 (Isaksen et al 2007). The increase in ground temperatures had resulted in the long-term thawing of permafrost (Akerman and Johansson 2008, Christiansen et al 2010, Romanovsky et al 2010b). In Sweden, the average rate of increase of ALT was between 0.7 and 1.3 cm yr−1 over the past three decades, but rates accelerated, especially during the past decade, to as high as 2 cm yr−1 (Akerman and Johansson 2008). During the 2007–9 period, the ALT in the bedrock boreholes on Janssonhaugen and Tarfalaryggen of the Nordic area were 2–5% greater than the mean of the previously recorded years (Christiansen et al 2010). During the past 30–40 years, in the sediments of the glacial marine and erosional plains with low or intermediate ice content, the ALT in the Vorkuta research region of Russia increased by 4–7 m (Romanovsky et al 2010b).
Undoubtedly, not only the high-latitude permafrost but also the middle-low-latitude and high-altitude permafrost represented by mountain permafrost in the QTP regions have degraded quickly and widely due to climate warming over the past several decades. Observed evidence along the Qinghai–Tibetan highway showed that, under the increase of mean annual air temperature of about 0.6–1.6 °C, MAGT at 6.0 m depth had increased 0.1–0.7 °C with an average increase of about 0.4 °C during the past decade (Wu and Zhang 2008), and ALT had increased by a rate of about 6.3 cm yr−1 over a period from 2006 to 2010 (Wu et al 2012).
The ground temperature monitoring of permafrost zones through 20 boreholes up to 15 m depth has been conducted since 2009, which is currently short-term in the upstream regions of the Shule River Basin. However, a spatial–temporal shifts method of the spatial pattern that is represented by different types of permafrost shifting to the temporal series that stands for different stages of permafrost degradation, has been used widely (Wang et al 2006). The method was applied to discuss response characteristics of the soil environment and vegetation throughout the entire permafrost degradation in later sections. As a result, permafrost degradation scenarios would arise from H-SP to UP accompanied by the rise of MAGT (∼3.6 °C) at a 15 m depth, as well as the increase of ALT (∼1.7 m) in the study area (table 3).
4.2. Response of soil environment to permafrost degradation
It is well known that the permafrost environment, as the matter and energy foundation, is essential to maintain the balance of the alpine ecosystem. Permafrost degradation accompanied by ground temperature increasing, permafrost table declining and ALT deepening, ineluctably altered the soil environment of the active layer. One thing to be mentioned is that the permafrost table played a positive role in preventing surface groundwater and soil moisture of the active layer from infiltrating and migrating downward, thus it could be called anti-permeable table. Some observed results in the Arctic showed that the degraded permafrost caused drought habitat moistening and SW increasing gradually (Christensen et al 2004, Jorgenson et al 2006). However, previous studies on the QTP found that owing to permafrost degradation, a thickened active layer and lowered permafrost table weakened the support action of the permafrost table to soil moisture and improved soil drainage, sequentially brought about SW decreasing progressively (Guo et al 2007, Chen et al 2010, Yang et al 2010). Our results showed that accompanied by permafrost degradation with stability decline from H-SP to EUP, ALT, ST and Ecb increased gradually from one permafrost type to the next, SW increased initially and reached its highest in the TP phase, and then decreased step by step in the upstream regions of the Shule River Basin (table 3). Furthermore, it more clearly exhibits the change trend of topsoil water-heat conditions in the processes of permafrost degradation in the alpine meadow ecosystem (figures 3(A), (B) and 5). The phenomena may be caused by the existence of a threshold value for the support action of the permafrost table in the TP phase. Although the event of permafrost degradation has occurred in the former stage from H-SP to TP, support action of the permafrost table did not exceed the threshold value. It resulted in soil drainage of the active layer still being poor and SW remaining high. In contrast, support action greatly exceeded the threshold value in the latter stage from TP to EUP, which led to soil drainage obviously improving and SW constantly decreasing.
The variations of SMC and TN content were not obvious throughout the entire permafrost degradation with stability decline from H-SP to EUP (table 3). However, in the stages from SSP to UP, soil sandy fractions gradually increased and silty fractions decreased significantly in the alpine meadow ecosystem (figure 3(B)), which exhibited the surface soil materials becoming coarse and gravelly (Wang et al 2006). Additionally, SOC and TN contents first increased and reached their highest in the TP phase, and then decreased (figure 3(C)). Some studies showed that TN content was significantly higher in the thermokarst caused by permafrost degradation than that in tussock (Schuur et al 2007), and the content of soil organic material (SOM) was much higher in alpine marsh meadow than that in others (Guo et al 2007, Chen et al 2011). Moreover, the results by Baumann et al (2009) exhibited that SW was the dominant parameter of SOC and TN content in the permafrost zones of the central-eastern QTP, and those by Liu et al (2012) reported that SOC content was predominantly influenced by SW in the upstream regions of the Shule River Basin. Therefore, it is estimated that accompanied by permafrost degradation with stability decline from SSP to TP, and to UP in the alpine meadow ecosystem, increased ST and SW resulted in SOM content increasing in the former stage from SSP to TP. In addition, SOCD and TND accordingly increased about 1.39 and 0.10 kg m−2 for a thickness of 0.40 m, respectively, which showed carbon/nitrogen sink effects. Subsequently, SOM content decreased in the latter stage from TP to UP due to consistently increased ST and dramatically decreased SW by improving soil drainage. In accordance, SOCD and TND decreased by approximately 0.53 and 0.05 kg m−2 for a thickness of 0.40 m, respectively, which indicated carbon/nitrogen source effects. Irrespective of permafrost degradation with stability decline from H-SP to EUP or from SSP to UP in alpine meadow ecosystem, three types of SCM quantities first decreased and reached their lowest in the TP phase, and then increased (table 3, figure 3(D)). This may be caused by improved SW making aerobic microorganisms decrease sharply in this phase.
4.3. Effects of permafrost degradation on vegetation characteristics
Soil of the active layer provides water-heat and nutrients for plant growth in the permafrost regions as an essential carrier. Obviously, the changes of soil environment resulting from permafrost degradation inevitably lead to alteration of the vegetation structure and function. From tables 1 and 2, wetland species such as Kobresia tibetica, K. capillifolia and Carex parva are gradually replaced by xerophytes such as Stipa basiplumosa, Achnatherum splendens and Limonium aureum var. dielsianum as the dominant plant within species composition, and the species number of sedge with high feeding value gradually diminished while weeds increased with the decline of permafrost stability. Further, the response of species composition to permafrost degradation is significantly correlated with SW (Yang et al 2010), and the changes of species composition caused by variation in the soil environment certainly had an effect on species diversity. The recent findings indicated that permafrost degradation had already resulted in shrub expansion and an increased abundance in the Arctic (Sturm et al 2001, Bonfils et al 2012, Elmendorf et al 2012). However, some results exhibited that accompanied by permafrost degradation, species diversity at first increased and then decreased in the QTP (Guo et al 2007, Chen et al 2011). Likewise, our results revealed that H' and S first increased and reached their highest in the SSP phase, and then decreased with the decline of permafrost stability from H-SP to EUP (table 2). However, the species diversity index first decreased and then increased from the SSP to the TP, and to the UP in the alpine meadow ecosystem (figure 2). It is estimated that SW variation throughout the entire permafrost degradation, brought about species' ecological niche differentiation, further led to changes of species composition and diversity, and eventually aroused community succession (Guo et al 2007, Yang et al 2010, Chen et al 2011). Obviously, an appropriate habitat was provided for species diversity in the SSP phase.
In addition, permafrost degradation has significantly influenced vegetation coverage and productivity through changes of soil moisture (Christensen et al 2004, Yang et al 2010). The degradation of ice-rich permafrost in Arctic tundra triggered by climate warming has caused the SW increase, which made vegetation coverage and productivity increase gradually (Christensen et al 2004, Blok et al 2010, Beck and Goetz 2011). In the QTP, it has been widely accepted that permafrost degradation resulted in a decrease of vegetation coverage and productivity (Wang et al 2006, Guo et al 2007, Chen et al 2010, 2011). However, our results showed that community coverage and biomass at first increased and reached their highest in the TP phase, and then decreased (table 2), the same trend was exhibited in SW variations (table 3) throughout the entire permafrost degradation with the stability decline from H-SP to EUP. Meanwhile, community coverage and biomass in the alpine meadow ecosystem increased initially and reached the highest in the TP phase, and then decreased in the stages from SSP to UP (figure 2), which were closely correlated with SW (P < 0.05; figure 4). As a consequence, it was concluded that soil water-heat conditions in the TP phase were very suitable for vegetation coverage and biomass in the study area. Overall, SSP and TP phases could provide a favourable environment for plant growth throughout the entire permafrost degradation, and SW of active layer was the dominant ecological factor limiting vegetation distribution and growth, as well as community structure and function in the permafrost zones of the upstream regions of the Shule River Basin. Of course, the long-term monitoring should be performed to further test these primary results.
5. Conclusions
In this paper, we focused on identifying the response characteristics of vegetation and soil environment caused by permafrost degradation with stability decline in the upstream regions of the Shule River Basin on the northeastern margin of the QTP. The results showed that ALT, as well as ST and Ecb of 0–40 cm depth increased gradually throughout the entire permafrost degradation with stability decline from H-SP to EUP. Whereas, SW first increased and reached the highest in the TP phase, and then decreased. This may be caused by the existence of a threshold value for the support action of the permafrost table in this stage. However, the quantities of SCM at a depth of 0–20 cm and SOC content first decreased and then increased, while TN content and SMC showed obscure trends. In the alpine meadow ecosystem, SOC and TN contents at first increased and then decreased, and soil sandy fractions gradually increased but silty fractions decreased significantly in the stages from SSP to TP, and to UP. Meanwhile, SOCD and TND increased in the former stage, respectively, which showed carbon/nitrogen sink effects. In contrast, it indicated that carbon/nitrogen source effects occurred contributing to a decrease of their storages in the latter stage.
With the changes of topsoil environment resulting from permafrost degradation, the characteristics of vegetation structure and function are ineluctably altered. Wetland species is basically replaced by xerophytes as the dominant plant within species composition. Species diversity, community coverage and biomass first increased and then decreased with a decline of permafrost stability from H-SP to EUP. In summary, response characteristics of vegetation and soil environment were varied throughout the entire permafrost degradation, and it showed that SSP and TP phases could provide a favourable environment for plant growth. Furthermore, SW was the dominant ecological factor limiting vegetation distribution and growth in the study area. However, it is essential to continue the long-term comprehensive field monitoring to further understand the response dynamics of vegetation characteristics and soil environment in the alpine ecosystem throughout the entire permafrost degradation in the future.
Acknowledgments
This work was supported by the National Natural Science Foundation of China (Nos 41171054, 40901040, 31070357 and 41121001), the Foundation for Excellent Youth Scholars of Cold and Arid Regions Environment and Engineering Research Institute, the Freedom Project (No. SKLCS-ZZ-2012-02-02) and the Open-ended Fund (No. SKLCS 10-08) of the State Key Laboratory of Cryospheric Sciences, Cold and Arid Regions Environmental and Engineering Research Institute, Chinese Academy of Sciences. We thank Dr Xiaojun Ma for providing soil culturable microorganism data and Dr Shihai Yang for identifying plant specimens.