
Abstract
Little is known about the frequency and potential mass balance impact of winter glacier melt events. In this study, daily atmospheric temperature soundings from the Puerto Montt radiosonde (41.43°S) are used to reconstruct winter melting events at the glacier equilibrium line altitude in the 38°–42°S region of southern Chile, between 1960 and 2010. The representativeness of the radiosonde temperatures to near-surface glacier temperatures is demonstrated using meteorological records from close to the equilibrium line on two glaciers in the region over five winters. Using a degree-day model we estimate an average of 0.28 m of melt and 21 melt days in the 15 June–15 September period each year, with high inter-annual variability. The majority of melt events are associated with midlatitude migratory high pressure systems crossing Chile and northwesterly flows, that force adiabatic compression and warm advection, respectively. There are no trends in the frequency or magnitude of melt events over the period of record, but the annual frequency of winter melt days shows a significant, although rather weak and probably non-linear, relationship to late winter and early spring values of a multivariate El Niño Southern Oscillation Index (MEI).
Export citation and abstract BibTeX RIS

Content from this work may be used under the terms of the Creative Commons Attribution-NonCommercial-ShareAlike 3.0 licence. Any further distribution of this work must maintain attribution to the author(s) and the title of the work, journal citation and DOI.
1. Introduction
The study of glacier fluctuations in Chile is important for several reasons. Glaciers are an important freshwater resource for public supply, agriculture irrigation and hydropower (Masiokas et al 2006); the Patagonian Icefields contribute significantly to current global sea level rise (Rignot et al 2003, Willis et al 2012); and many glaciers are located on active volcanoes, representing a significant flood (lahar) hazard (Rivera et al 2006b). Most glaciers in Chile are now in a state of retreat (Rivera et al 2006a, Carrasco et al 2008), but the exact climatic controls on glacier behaviour are not well known. Better understanding is hampered by the small number of glacier mass (Casassa et al 2006) and energy balance (Brock et al 2007) studies that have been conducted in the region, and the lack of high elevation meteorological station data representative of glacier localities (Rivera et al 2005, Falvey and Garreaud 2009). Transferring meteorological forcing variables in space can create large errors in glacier ablation models (Charbonneau et al 1981, Hock 2005, MacDougall and Flowers 2011). This is a particular issue in Chile where contrasting temporal temperature trends above and below about 500–1000 m elevation, and strong temperature stratification in the lower troposphere (Rosenblüth et al 1997, Bown and Rivera 2007, Falvey and Garreaud 2009), largely invalidate the use of more plentiful low-level meteorological station data for glacier studies.
In recent years, short-term investigations on glaciers in Patagonia and southern and central Chile have improved understanding of glacier–climate interactions during the summer ablation period (Schneider et al 2006, Brock et al 2007, Pellicciotti et al 2008, Konya and Matsumoto 2010). However, conditions and processes operating during the winter remain largely unknown, due to the difficulty of maintaining meteorological stations at high elevation under extreme climatic conditions, which often lead to the damage and burial of meteorological stations by snow (Brock et al 2007). In particular, the frequency and magnitude of winter melting events are not recorded in current mass balance observations using direct (Rivera et al 2005) and geodetic remote sensing (Rivera et al 2006b) techniques, which integrate their effects with snow accumulation over the winter period. Elsewhere, short-term winter melt rates of more than double the mean summer melt rate have been recorded on the Franz Josef Glacier, South Island, New Zealand (Marcus et al 1985). Better knowledge of winter melting events in the similar maritime climate of southern Chile, where sea level temperatures rarely fall far below 0 °C, could improve understanding of the impacts on glaciers of both anthropogenic climatic warming and variability in natural modes of atmospheric circulation such as the El Niño Southern Oscillation (ENSO).
This letter aims to improve understanding of temporal patterns in the frequency and magnitude of winter glacier melt events, and their underlying causes, in an important climatic transition zone. The study takes advantage of rare winter meteorological records from two glaciers located in the Chilean Lake District region (38°–42°S). As a first objective, these short-term high elevation records are used to validate the regional representativeness of tropospheric temperature soundings from the Puerto Montt radiosonde, 41.43°S. In a second objective, winter melting events are identified in the radiosonde record extending back to 1958, using a temperature threshold of +1 °C at the approximate regional equilibrium line altitude (ELA), and the ablation generated is estimated using a degree-day model. As a final objective, the winter glacier melt record, which is >80% complete for most years since 1958, is analysed for temporal trends and correlation with ENSO indices, and gridded climate data are used to identify the patterns of atmospheric circulation associated with high mid-tropospheric temperatures.
2. Study area, data sources and methods
The 38°–42°S region is located in the transition zone between the wet-temperate and dry-Mediterranean climates of southern and central Chile, respectively (figure 1). The contrasting influences of the prevailing westerlies and southern Pacific depression track, which dominate in the winter, and the semi-permanent subtropical high pressure area, which exerts a greater influence in the summer, generate a strong seasonality in the climate. For example, at Valdivia (39.63°S, 73.08°W, 19 m above sea level, a.s.l.), the April–September (winter) precipitation is >2000 mm, while the October–March (summer) precipitation is <650 mm. In an analysis of radiosonde data, Falvey and Garreaud (2009) found no significant temperature trends in the low-mid-troposphere for the region in the last 50 years. Significant trends of decreasing precipitation of up to −15 mm year−1 between 1961 and 2000 (Bown and Rivera 2007) are thought to be the main reason that glaciers in the region have been retreating during recent decades (Rivera et al 2002). While there has been a clear warming trend in Chile north of 33°S, more detailed research is required to separate the anthropogenic and natural influences on climate change in the study region and to uncover the underlying physical mechanisms.
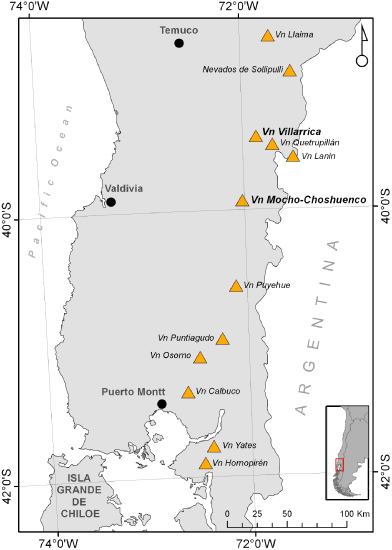
Figure 1. Study area in southern Chile 38–42°S, showing locations of volcanoes (Vn), Temuco weather station and Puerto Montt radiosonde.
Download figure:
Standard imageThe Chilean Andes between 38° and 42°S has over 50 glaciers covering an area of 140 km2 (Rivera et al 2012) and the regional ELA is approximately 2000 m a.s.l. (Rivera et al 2006b). There was a 34% reduction in ice-covered area between 1961 and 2011, with frontal retreat rates of up to 150 m a−1 (Rivera et al 2012). Most glaciers are located on active volcanic cones and tephra deposited during eruptive activity can have an insulating effect on glaciers where the cover is extensive and thick (Brock et al 2007). Fine ash deposition from low-intensity activity or distal eruptions, however, can dramatically enhance snow melt rates, through albedo reduction (Rivera et al 2008).
As part of recent research projects investigating glacier–climate–volcano interactions in southern Chile, automatic weather stations (AWSs) were installed on the glaciers of Villarrica Volcano (VAWS; 39.42°S, 71.94°W) and Mocho–Choshuenco Volcano (MAWS; 39.73°S, 72.03 °W) (figure 1). These stations provide in situ temperature data used in the study. The AWSs were installed at similar elevations of 1890 m a.s.l. (VAWS) and 1966 m a.s.l. (MAWS), but the available winter data cover different periods. The VAWS has continuous data for 8 July–9 September in 2004 and 19 May–22 July 2005 only, while the MAWS has continuous data since 2008. Both AWSs record air temperature and humidity at approximately 2 m height in naturally ventilated radiation shields, at hourly (VAWS) or 15 min (MAWS) intervals.
Daily atmospheric soundings from the Puerto Montt radiosonde (PMR, 41.43°S, 73.1°W; 1200 UTC, 0800 local time in winter), approximately 200 km south of the MAWS, were obtained from the Chilean Weather Service (DMC), for the 1958–2010 period. These data provide vertical profiles of air temperature and other atmospheric variables at standard pressure levels. The data were linearly interpolated onto 20 m spaced heights. To generate daily air temperatures representative of the regional glacier ELA, values in the 1500–2500 m elevation range were averaged (PMR 2000 m temperature, hereafter). The representativeness of the PMR 2000 m temperature to near-surface air temperatures on the volcanoes is investigated through comparison with the volcano stations. We also make use of low elevation air temperatures recorded at Temuco (38.75°S, 72.63°W, 114 m a.s.l.; figure 1), the closest DMC weather station to the volcanoes.
Gridded atmospheric data from the National Centers for Atmospheric Prediction (NCEP) and the National Center for Atmospheric Research (NCAR) reanalysis project (Kalnay et al 1996) are used to examine patterns of sea level pressure, and air temperature, horizontal wind vectors and vertical wind velocity in pressure co-ordinate (omega) at the 775 hPa level, both during melt events and under average winter conditions. The 775 hPa height data were calculated as the average of the 700 and 850 hPa values, to correspond approximately with the regional ELA. Only data from 1980 onwards are used in this study due to uncertainties in the reliability of the data prior to the beginning of satellite data assimilation. Finally, we analyse possible relationships between the pattern of melt events and large-scale ocean–atmosphere oscillations in the Southern Pacific using monthly values of the extended reconstructed global sea surface temperature version 3 dataset (ERSST.v3, Smith et al (2008)) and the multivariate ENSO index (MEI) of Wolter and Timlin (2011).
3. Results
3.1. Identification of positive temperature events
Days with positive air temperatures at the glacier ELA level occur frequently during all winters and the warmest days have a mean temperature >10 °C (figures 2(a)–(e)). Mean daily temperatures at the VAWS and MAWS correspond very closely with the PMR 2000 m temperature (figures 2(a)–(e)). In particular, the timing and magnitude of positive temperatures at the volcano stations are matched very closely in the PMR 2000 m temperature, indicating that these events have a regional extent, covering at least 200 km in the meridional direction. The correlations between daily mean temperatures at the volcano stations and the PMR 2000 m level are positive and highly significant, for both all winter days and days with temperature >1 °C (left and right sides of table 1, respectively). Significant positive correlations also exist between the glacier ELA level (PMR 2000 m level and the volcano stations) and the low-level Temuco station, for all winter days (left side of table 1). However, these positive correlations become weak and non-significant negative correlations during days with temperature >1 °C (right side of table 1). In other words, as positive temperatures increase at the ELA level, temperatures decrease at Temuco, indicating slack temperature lapse rates or inversions in the lower troposphere, which are evident in the temperature graphs (figures 2(a)–(e)). The correlation between mean daily temperatures at the volcano stations and the PMR radiosonde is strong and positive for all levels of the low-mid-troposphere, except for the lowest few 100 m where it is weak (figures 3(a) and (b)). This illustrates the effect of strong temperature stratification and inversions in the lower troposphere, analogous to those documented for central and northern Chile (Falvey and Garreaud 2009).
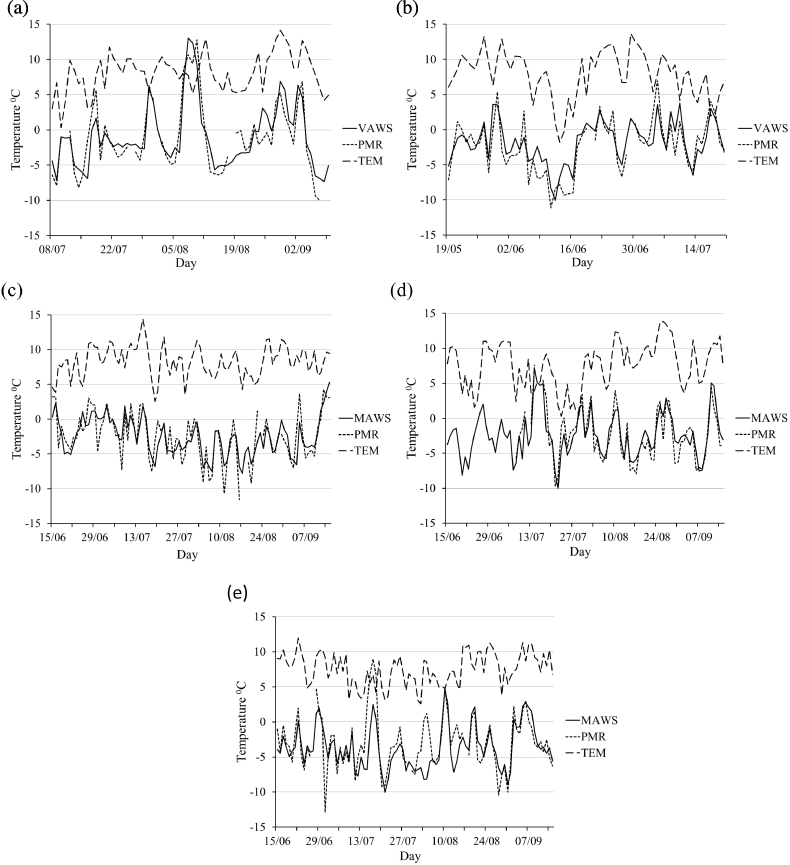
Figure 2. Comparison of daily mean temperatures at Villarrica automatic weather station (VAWS, 1890 m a.s.l., panels (a)–(b)), Mocho–Choshuenco automatic weather station (MAWS, 1966 m a.s.l., panels (c)–(e)) and Temuco Station (TEM, 114 m a.s.l.), and the daily mean of the 1500–2500 m level Puerto Montt radiosonde temperatures (PMR), during the: (a) 2004, (b) 2005, (c) 2008, (d) 2009 and (e) 2010 winters. Note different date ranges in (a) and (b) are due to incomplete data in 2004 and 2005. See figure 1 for site locations.
Download figure:
Standard imageTable 1. Pearson's correlation coefficient matrices between the daily mean temperature (T) at the Villarrica and Mocho–Choshuenco volcano stations (VOL), the daily mean 1500–2500 m level Puerto Montt radiosonde temperature (PMR) and the daily mean temperature at Temuco station (TEM) during the 2004, 2005, 2008, 2009 and 2010 winters. VOL data are from Villarrica station in 2004 and 2005 and Mocho–Choshuenco station in 2008, 2009 and 2010. P is the significance level of the correlation. Days with VOL T > 1 °C are interpreted as melt days at the regional glacier equilibrium line elevation (∼2000 m).
| All days n = 368 | Days with VOL T > 1 °C n = 60 | ||||
|---|---|---|---|---|---|
| VOL | PMR | VOL | PMR | ||
| PMR | 0.826 | PMR | 0.711 | ||
| P =< 0.000 | P =< 0.000 | ||||
| TEM | 0.345 | 0.218 | TEM | −0.173 | −0.105 |
| P =< 0.000 | P =< 0.000 | P = 0.19 | P = 0.43 | ||

Figure 3. Pearson's correlation between Puerto Montt radiosonde temperatures at 0–4000 m elevation levels and daily mean temperatures at: (a) Villarrica weather station (1890 m a.s.l.) and (b) Mocho–Choshuenco weather station (1966 m a.s.l.). Data for 8 July–9 September in 2004 and 19 May–22 July in 2005 (Villarrica), and 15 June–15 September in 2008, 2009 and 2010 (Mocho–Choshuenco).
Download figure:
Standard image3.2. Vertical structure of a high-temperature event
An example of the vertical tropospheric temperature structure during a high-temperature event, which occurred between 7 and 10 August 2004, is shown in figure 4. This was a very high-magnitude event, with daily average temperatures at the VAWS between 6.7 and 13.0 °C over the 4 day period. The atmospheric temperature profiles on the days before (6 August) and after (12 August) the event are close to the environmental lapse rate (6.5 °C km−1). In contrast, the days from 7 to 10 August 2004 had highly elevated temperatures between 500 and 4000 m altitude, with strong inversions below 500 m. The zero degree isotherm rose above 3500 m elevation on 8–10 August, giving the potential for snow and ice melt at all elevations in the region (highest point, Volcán Lanín, 39.63°S, 71.5°W, 3747 m a.s.l.; figure 1).

Figure 4. Vertical tropospheric temperature profiles recorded by the Puerto Montt radiosonde between 6 and 12 August 2004. The 11 August 2004 trace has been removed for clarity.
Download figure:
Standard image3.3. Construction and analysis of a regional 50 year winter glacier melt record from the Puerto Montt radiosonde
As shown in section 3.1, PMR 2000 m and volcano station temperatures are strongly correlated. Furthermore, the mean PMR 2000 m and volcano station temperatures are identical for both all winter days and days with T > 1 °C (table 2, row 1). Slight differences between the PMR 2000 m and the VAWS and MAWS mean temperatures (table 2, rows 2 and 3, respectively) reflect the small differences in the elevations of the two stations. The root mean squared (RMS) differences between daily PMR 2000 m level temperature and mean daily volcano station temperatures are 2.2 °C for all winter days and 2.1 °C for melt days. Hence, PMR 2000 m temperatures can be used as a reliable indicator of near-surface temperatures at the regional glacier ELA. Integrated over a winter season, the mean bias is zero (table 2, row 1), although for individual events there is a mean error of approximately ±1 °C according to the RMS difference.
Table 2. Mean temperature (T > 1 °C) at the volcano (VOL) and Temuco (TEM) stations, and the mean 1500–2500 m level Puerto Montt radiosonde temperature (PMR), during the 2004, 2005, 2008, 2009 and 2010 winters. Days with VOL T °C are interpreted as melt days at the regional glacier equilibrium line elevation (∼2000 m).
| All days | Days with VOL T > 1 °C | |||||
|---|---|---|---|---|---|---|
| VOL | PMR | TEM | VOL | PMR | TEM | |
| All years: n = 368 (all days), n = 60 (days with T > 1 °C) | −2.4 | −2.4 | 7.9 | 3.3 | 3.3 | 8.8 |
| 2004–05: n = 119 (all days), n = 26 (days with T > 1 °C) | −1.3a | −1.7 | 7.9 | 4.4a | 4.2 | 8.7 |
| 2008–10: n = 249 (all days), n = 34 (days with T > 1 °C) | −2.9b | −2.6 | 7.8 | 2.5 b | 2.6 | 8.8 |
aVOL =Villarrica station in 2004 and 2005. bVOL = Mocho–Choshuenco station in 2008–2010.
The daily PMR 2000 m temperature record between 1958 and 2010 was used as a basis for calculating winter daily melt at the approximate level of the regional ELA. The winter season was defined as 15 June–15 September. Winters which had more than 20% of daily launches missing were considered too incomplete and not used further in the analysis. Total melt, M (mm), during each winter was estimated using the degree-day model (Hock 2005):
where n = number of days, d, in a winter (93) and T+ is the sum of positive degree days over the season. A degree-day factor, DDF, of 3.5 mm d−1 K−1 was used, which is the mean value for winter snow at the ELA of 60 glaciers reported by Braithwaite (2008). A melt threshold temperature of +1 °C was applied. The degree-day model is the simplest method to estimate glacier ablation from meteorological data, and relies on the high correlation between air temperature and incoming (atmospheric) longwave radiation and the turbulent heat fluxes, which normally provide the majority of latent heat energy used in melting ice and snow in the winter (Ohmura 2001).
The reconstructed series of total winter melt at the regional glacier ELA is shown in figure 5. The mean winter melt is 0.28 m, giving a total of 14.28 m of melt over the 51 winter series, with high inter-annual variability (standard deviation = 0.12 m). The minimum and maximum winter melt totals are 0.04 m (1967) and 0.58 m (1979), respectively. These values are significant considering measured annual net mass balances are in the −0.88 to +0.36 m range at Mocho–Choshuenco volcano (Rivera et al 2005, Bown et al 2007). There are on average 21 melt days per winter, with a minimum of 5 (1967) and a maximum of 38 (1979). Temperatures of 10 °C or higher were recorded on 29 days, with a maximum of 16.3 °C on 30 July 1970.

Figure 5. Total melt at the regional glacier equilibrium line altitude during each winter (15 June–15 September) between 1960 and 2010 estimated using a degree-day model and the daily mean of the 1500–2500 m level temperatures from the Puerto Montt radiosonde. Years with less than 80% of daily observations (1958, 1959, 1970, 1982, 1984, 1985, 1986, 2003, 2009) are omitted.
Download figure:
Standard imageThere are no significant trends in total winter melt (r = 0.05,P = 0.771) or winter melt day frequency (r =− 0.03,P = 0.84) over time. Similarly, correlations with sea surface temperature anomalies across the tropical Pacific north of 23°S are weak and not significant (r values in the range 0.1–0.2). However, both melt day frequency and total winter melt show a significant positive correlation with winter sea surface temperature anomalies in the subtropical Pacific south of 23°S (r > 0.40,P < 0.05). More interestingly, the winter melt day frequency is also significantly positively correlated with the August–September, September–October and October–November bimonthly values of the MEI index (r > 0.31,P < 0.04; figure 6), but not with the early winter bimonthly values (r < 0.3,P > 0.05 for May–June, June–July and July–August MEI values). The highest winter melt day frequencies occur at neutral and low-positive August–November MEI values, i.e. weak El Niño conditions, with frequencies tending to decrease at extreme ENSO phases (figure 6).

Figure 6. Relationship between the frequency of winter (15 June–15 September) melt days and the mean of the August–November values of the MEI Index (Wolter and Timlin 2011) between 1960 and 2010 (44 data points). Winters with less than 80% of daily radiosonde launches have been omitted.
Download figure:
Standard image3.4. Analysis of regional atmospheric circulation during melt events
This section examines the relationships between melt events and regional circulation patterns based on sea level pressure, and temperature, horizontal and vertical wind vectors at the 775 hPa level, across the southern Pacific and South America (20°–60°S, 30°–140°W) using NCEP/NCAR reanalysis project data (Kalnay et al 1996). The 775 hPa values are calculated from the mean of the 850 and 700 hPa levels, corresponding approximately with the regional glacier ELA. Composites (figure 7) were generated using daily data in the 15 June–15 September period between 1980 and 2010, for: (a) all winter days; (b) all first days of melt events; (c) the warmest 5% of winter days (days with air temperature >6.7 °C at 2000 m); and (d) the 2 days preceding the warmest 5% of winter days. In the left panels of figure 7 the temperature and horizontal wind vectors give an indication of horizontal heat advection, with arrows crossing from warmer to colder regions suggesting a gain of heat energy and vice versa. In the right panels of figure 7, positive (negative) omega values are indicative of adiabatic warming (cooling) due to downward (upward) air displacement. Sea level pressure in the right panels characterizes the synoptic circulation.

Figure 7. Atmospheric patterns across the South Pacific–South America–South Atlantic region, 20–60°S, 140, 0–30°W, NCEP/NCAR reanalysis project data for 1980–2010. Left panels: air temperature (shaded) and wind vectors (arrows) at 775 hPa; right panels: vertical velocity (shaded) at 775 hPa, and sea level pressure (lines). Composites for all winter days ((a) and (b)), for all first days of melt events ((c) and (d)), the warmest 5% of winter days ((e) and (f)) and the 2 days preceding the warmest 5% of days ((g) and (h)).
Download figure:
Standard imageThe average winter climatological circulation is characterized by westerlies along the midlatitudes, with zonally oriented isotherms (figure 7(a)). Average winter temperatures in southern Chile (38°–42°S) at 775 hPa, i.e. ELA level, are between −1 and −3 °C. At the surface, the subtropical high pressure system dominates from 35°S to the north, while south of 35°S, upward (downward) motions are present along the windward (leeward) side of the Andes, forced by the westerlies interacting with topography (figure 7(b)). During the first day of melting events widespread warming of up to 3–4 °C at 775 hPa is noticeable across southern Chile (figure 7(c)). This is associated with the presence of high pressure over Argentina at subtropical and midlatitudes, and downward air movement and northwesterly flows at 775 hPa (figures 7(c) and (d)). Hence, both warm air advection and adiabatic processes are likely to explain the warming in southern Chile. During the warmest 5% of winter days, the temperature increase of 5–7 °C at 775 hPa over southern central Chile (figures 7(a) and (e)) seems to be exclusively a consequence of strong adiabatic compression (figure 7(f)). This is associated with the southward expansion and intensification of the Argentinian high pressure which blocks the prevailing westerlies (figures 7(e) and (f)). According to Garreaud et al (2002), this anomalous circulation, with high pressure to the south and low pressure off coast to the north, forces easterly downslope flows and adiabatic warming. The warmest events are preceded by the intensification of the high pressure cell off the Chilean coast at midlatitudes and adiabatic warming over southern Chile, concurrent with low pressure off the northern Chile coast (figure 7(h)).
4. Discussion and conclusions
Differences between near-surface and free-air temperatures at high elevation sites (Pepin and Seidel 2005) and the development of relatively cold boundary layers over glaciers (e.g. Oerlemans 2001) are well documented. In this context, the close correspondence between PMR 2000 m temperatures and 2 m air temperatures at the volcano stations (tables 1 and 2) seems surprising. The explanation probably lies in the particular geometry of glaciers located on volcanoes, which are essentially large conical structures protruding into the troposphere, with little topographic shelter from prevailing winds. Under these conditions, a surface-adjusted boundary layer is less likely to develop than on a mountain valley glacier, particularly in a region characterized by a strong and persistent wind regime. Hence, while successful in this study, radiosonde temperatures may not be applicable to valley glaciers elsewhere, without adjustment for boundary layer effects.
Based on the RMS difference of ±1 °C between volcano station and PMR 2000 m temperatures, and an average frequency of 21 melt days per winter, there is an uncertainty of ±0.074 m in the calculated annual winter melt total of 0.28 m. The actual error is likely to be lower, however, given the mean bias difference of zero (table 2). The degree-day factor of 3.5 mm °C−1 d−1 is a conservative value, given that the majority of glaciers in the Braithwaite (2008) dataset are from higher latitudes than southern Chile, with lower levels of incoming shortwave radiation during the winter months. Furthermore, many glaciers in the study region are affected by fine volcanic ash deposition, which enhances melt through albedo reduction of snow surfaces (Rivera et al 2008). Hence, the total amount of melt is probably underestimated in our calculations.
Melting events are generated by horizontal heat advection from the subtropical Pacific and/or adiabatic warming associated with downslope flows. It is likely that most winter melt events are associated with midlatitude migratory anticyclones, and so the occurrence of melt days will be sensitive to the frequency, directional track and developmental stage of high pressure systems crossing Chile during the winter months. Inter-annual variations in these parameters can account for much of the high inter-annual variability in winter melt totals (figure 5). Infrequent high-magnitude events are associated with a well-developed coastal low in north-central Chile, that is related to the eastward displacement of a strong midlatitude high pressure system. During these events, the study region is affected by intense adiabatic warming due to easterly downslope flows. These events can lead to snow melt rates of around 50 mm d−1 at the regional ELA, which are more typical of summer conditions (Brock et al 2007).
The absence of trends in the frequency or magnitude of winter melting events since 1960 corresponds with the lack of a significant regional temperature trend over the same period (Falvey and Garreaud 2009). A correlation between subtropical sea surface temperatures and winter melt would be expected, due to warm air advection. The significant relationship identified between winter melt day frequency and late winter and spring bimonthly values of the MEI index is harder to explain. The MEI index is comprised of 6 variables: sea level pressure, the zonal and meridional components of the surface wind, sea surface temperature, surface air temperature, and total cloudiness fraction of the sky (Wolter and Timlin 2011). Given that the winter melt frequency (June–September) correlates with spring values of the MEI index (August–September through to October–November) it is likely that the association is due to the particular atmospheric circulation over the Pacific and south America prior to, and during the onset of, spring ENSO events, rather than raised sea and surface air temperatures. This interpretation is supported by the observation that MEI values correlate more strongly with winter melt day frequency than total winter melt, and also that the correlations between the mean temperature of melt days each winter and MEI index values are very weak (r < 0.1). Other workers (e.g. Vimont et al 2003, Chang et al 2007) have also identified links between extratropical atmospheric circulation changes and the onset of ENSO. The finding that a change in the frequency of winter mid-troposphere high-temperature events in southern Chile may pre-empt spring ENSO (El Niño or La Niña) events is intriguing and warrants more detailed investigation.
In this study we have analysed tropospheric temperature soundings at Puerto Montt, in conjunction with a degree-day melt model, to reconstruct winter melting events on glaciers in southern Chile, 38°–42°S, between 1960 and 2010. The main conclusions are:
- Winter melt events occur frequently at the regional glacier ELA, with an average of 21 melt days each winter. We conservatively estimate an average of 0.28 m of melt per winter, and a total of 14.28 m of winter melt over the 1960–2010 period. Thus, winter melting is significant to glacier mass balance and snow hydrology in the region.
- The majority of melt events are associated with midlatitude migratory high pressure systems crossing Chile, and northwesterly flows at glacier equilibrium line elevation, that force adiabatic compression and warm advection, respectively. Infrequent high-magnitude events, when 2000 m elevation temperatures can reach +16 °C, occur exclusively under strong eastward downslope winds associated with migratory high pressure systems.
- There are no trends in the frequency or magnitude of melt events over the study period, however, we identify a link between winter melt day frequency and late winter to spring values of the MEI ENSO index (Wolter and Timlin 2011). Future work aiming to explain the links between atmospheric circulation changes associated with mid-troposphere high-temperature events in southern Chile and the subsequent onset of ENSO events would be valuable.
- Low-level station temperatures do not correlate with 2000 m temperatures during melt events, due to slack lapse rates and inversions in the low to mid-troposphere. Consequently, low-level station data are of little benefit to glacier studies in the region. The paucity of high altitude meteorological data is a significant hindrance to understanding of glacier–climate interactions in Chile and more permanent glacier stations, similar to the Mocho–Choshuenco AWS are needed.
Acknowledgments
This work was funded by FONDECYT research grant 1090387 and international cooperation grant 7050177, the Royal Society, the University of Dundee and Centro de Estudios Científicos (CECs). CECs is funded by the Chilean Government through the Centres of Excellence Base Financing Programme of CONICYT. We thank J Carrasco for providing meteorological data, and the Dirección Meteorológica de Chile for supplying the radiosonde data. We thank two anonymous reviewers whose comments helped to improve the original version of this letter.