
Abstract
The methodology for using uncertainty factors in health risk assessment has been developed for several decades. A default value is usually applied for the uncertainty factor UFL, which is used to extrapolate from LOAEL (lowest observed adverse effect level) to NAEL (no adverse effect level). Here, we have developed a new method that establishes a linear relationship between UFL and the additional risk level at LOAEL based on the dose–response information, which represents a very important factor that should be carefully considered. This linear formula makes it possible to select UFL properly in the additional risk range from 5.3% to 16.2%. Also the results remind us that the default value 10 may not be conservative enough when the additional risk level at LOAEL exceeds 16.2%. Furthermore, this novel method not only provides a flexible UFL instead of the traditional default value, but also can ensure a conservative estimation of the UFL with fewer errors, and avoid the benchmark response selection involved in the benchmark dose method. These advantages can improve the estimation of the extrapolation starting point in the risk assessment.
Export citation and abstract BibTeX RIS

Content from this work may be used under the terms of the Creative Commons Attribution-NonCommercial-ShareAlike 3.0 licence. Any further distribution of this work must maintain attribution to the author(s) and the title of the work, journal citation and DOI.
1. Introduction
One key objective in the risk assessment of chemicals is to determine the acceptable exposure level for humans. It is assumed that, for non-carcinogenic chemicals, there is a threshold under which no adverse effects can be observed. A traditionally used approach in human health risk assessment of non-carcinogens based on this threshold assumption is the establishment of the NOAEL (no observed adverse effect level). NOAEL is the highest exposure level at which there are no statistically or biologically significant increases in the frequency or severity of adverse effects between the exposed population and its control. Some effects may be produced at this level, but they are not considered adverse or precursors of adverse effects. Using NOAEL as the point of departure (POD), together with the application of uncertainty factors (UFs), the health based guidance value such as reference dose (RfD) can be derived (USEPA 1988, USEPA IRIS 1993).
However, NOAEL is not always available, and the LOAEL (lowest observed adverse effect level) is used as an alternative. A LOAEL of a test is the lowest experimentally determined exposure level at which there is statistically or biologically significant increase in the frequency or the severity of adverse effects over the control level. To quantify the uncertainty that stems from the gap between LOAEL and NOAEL, an uncertainty factor designated UFL is needed, and the most frequently used UFL is a single default value, although different values have been suggested. For instance, the United States Environmental Protection Agency (USEPA) and the Agency for Toxic Substances and Disease Registry (ATSDR) set a default value of maximum 10, or a possibly smaller factor judged on a case-by-case basis (Pohl and Abadin 1995, USEPA 2000b), while the European Centre for Ecotoxicology and Toxicology of Chemicals (ECETOC) and Vermeire et al suggested that a factor of 3 is sufficient (ECETOC 2003, Vermeire et al 1999). EPA IRIS also suggested the application of an UFL 3, when minimally adverse effects were observed at LOAEL (Stedeford et al 2007). Several research groups have examined the sufficiency of the value 10 as the uncertainty factor default value (Dourson et al 1996, Dourson and Stara 1983, Kadry et al 1995), yet these investigations face two main criticisms. First, the studies only used LOAEL/NOAEL ratios and these ratios usually reflect the historical use of various dose intervals (Filipsson et al 2007), which means that if 95% toxicologists used value X or less as experimental dose intervals, then the UFL is X. In fact, when NOAEL is unavailable, it is unlikely to know whether the next dose level below an experimental LOAEL is the NOAEL or just another LOAEL. Second, these studies usually contained a relatively small number of data (50 or less) (Brand et al 1999). Progresses have been made by some researchers supporting non-default UFL. A probabilistic method was proposed to derive UFL based on the historical distribution of the ratio between LOAEL and NOAEL (Hasegawa et al 2010). However, the method may face the same criticism as we described above.
As an alternative, the benchmark dose (BMD) approach was proposed in order to derive POD or NAEL (no adverse effect level) (Crump 1984). BMD methodology was claimed to be superior to NOAEL/LOAEL, since it considers the whole dose–response curve rather than a single point estimate (Filipsson et al 2003). This advantage has brought notable attention to the method, and various organizations and agents have recommended the regulatory adaptation of this methodology, including USEPA (USEPA 1995, WHO/IPCS 1994, 1999). Nevertheless, it has also been questioned and criticized by many researchers due to two inherent flaws: first, the method of benchmark response (BMR) selection, which is required for the BMD method, has aroused a great deal of controversy. Crump believed that BMR should be 'set at the lower boundary of the range of response that can be detected experimentally, in order to avoid uncertainties associated with low-dose extrapolation using models that may not reflect biological realities' (Crump 1995), but at the same time should be 'large enough so that the BMD is relatively insensitive to the choice of mathematical model' (Slikker and Crump 1996). Several default values of BMR, such as 1%, 5% and 10%, have been suggested, and the recommendation of a 5% risk level for quantal data was generated from numerous developmental toxicity data (Allen et al 1994, Reiss and Gaylor 2005). The basis for the BMR selection was based on whether the benchmark dose lower confidence limit (BMDL) is close to the NOAEL on average, though it was thought not to have a scientific rationale (Allen et al 1994, Barton and Das 1996, Setzer and Kimmel 2003). When other endpoints were considered, the risk at the NOAEL was found to be 10% or higher (Gronlund et al 1995). Fowles et al (1999) found that the BMDLs corresponding to additional risk of 1–10% were lower than the NOAEL from acute inhalation lethality data, and BMDL10 was closest to the NOAEL. However, Murrel et al (1998) argued that choosing BMR in a linear range of dose–response (which usually includes 10% of risk level) fails to take advantage of all the information available from a model using all the data for the point estimate of BMD. Another new way to select BMR for quantal data involves looking for the lowest BMR while the corresponding BMDL becomes relatively independent on model selection (Sand et al 2002). However, this method brings about the issue of how to determine what difference value between BMDLs from different models would indicate model dependent or not.
Second, a frequently cited advantage of BMD method is the introduction of lower confidence bound, which takes into account the quality of experiment design. However, Murrel et al (1998) suggested that the confidence limit itself is an estimate and also subject to all the same assumptions and uncertainties as the point estimate. Their claim argues that the confidence limit may be affected by the small sample size and poor study design, when in contrast, the point estimate depends more on the dose–response relationship.
Furthermore, the appropriate model selection for dose–response relationship is also an issue that has been discussed extensively. The basic strategy is firstly to screen the models with an adequate model fit (USEPA 2000a). However, when several models pass this criterion, further model selection is necessary, including the use of the likelihood ratio test, Akaike's Information Criterion (AIC), the average of several models' BMDLs, or directly use the smallest BMDL (Bailer et al 2005, Fitzgerald et al 2004, USEPA 2000a). What is missing is a science policy decision explaining when to apply the various techniques. All of these weaknesses limit the extensive use of the BMD method.
The NOAEL/LOAEL approach has been criticized for having many drawbacks, however, its promising advantage is that the routines for use are well established, such as how to deal with various practical problems like limited data. In this work, in order to improve the NOAEL/LOAEL method, we hypothesized that the risk level at LOAEL is an important factor that affects the value of UFL, and we propose a new approach to establish the relationship between UFL values and the risk level at LOAEL, integrating the information of dose–response. We found a linear correlation within a certain range of additional risk, and the comparison between this method and BMD approach was discussed.
2. Material and methods
2.1. Data collection
We retrieved data from the National Toxicology Program (NTP), which evaluates chemicals of public health concern and maintains a large number of experimental toxicity reports. In our work, we reviewed reports from 1980s to the most recent records. The long-term toxicological data was chosen; the dataset, which was defined as data from a set of dose groups for one chemical, one test endpoint (noncancer quantal endpoint), one exposure route and one species, was selected if it had at least one more dose group higher than LOAEL. In the NTP reports, all the effects data are shown with statistical analysis which facilitates the screening process.
2.2. Data processing
Figure 1 gives an ideal dataset with four data points: D1=control, D2=NOAEL, D3=LOAEL, D4=higher effect dose. This is an example of 'good' data, which was previously used to estimate UFL. However, when UFL needs to be applied to a dataset to estimate NOAEL, there is no way to know how close the LOAEL is to the actual NOAEL, if the ideal experiment has not been performed. It is quite possible that the LOAEL (d2) of this dataset is higher than the LOAEL from the ideal dataset, for example d2 may be equal to D4 (figure 1) and hence represent an LOAEL with a higher risk level. Therefore, only using the LOAEL-to-NOAEL ratios to estimate UFL is far from accurate.
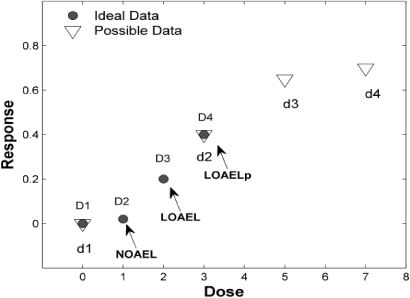
Figure 1. Illustration of a possible LOAEL (LOAELP) with high risk level. The ideal data often used in UFL estimation are obtained at the dose of D1–D4, while a possible real experimental data could be d1–d4. In this case d2/D4 corresponds to a LOAELP with higher risk level than the LOAEL from the ideal dataset.
Download figure:
Standard imageIn this study, dose levels higher than NOAEL in one dataset were all considered as possible LOAELs (LOAELPs). Each LOAELPi was divided by NOAEL in that dataset to get LOAELPi/NOAEL ratios (Ri).

The corresponding additional risk of each ratio is the increment of effect (expressed as the percentage of affected individuals) under each treatment group (pi) relative to the background effects from control (p0), i.e.

The dose–response curve fit was obtained using the Benchmark Dose Software (BMDS 2.1.2). In brief, the model selection was performed as suggested by US EPA and eight models, namely: gamma, logistic, log-logistic, log-probit, probit, multistage, quantal linear and Weibull were run. The models with p-values larger than 0.1 were deemed as qualified. If the BMDLs' estimates from these qualified models were within a factor of 3, they were considered indistinguishable, and the model with the lowest AIC was selected. If the BMDLs' estimates were not within a factor of 3, the model with the lowest BMDL estimate was selected and some model dependence is assumed. Out of 141 datasets, 64 datasets whose largest dose levels were greater than or equal to 10× NOAEL were fitted by BMDS, and the additional risk size of certain dose levels (5× to 10× NOAEL) were calculated from the fitting model.
An estimate of the fit of a normal distribution for the additional risk levels at dose level of 5× to 10× NOAEL was conducted using the cumulative distribution functions in Matlab R2010a, and Lilliefors test was used to judge the fit. The inverse cumulative distribution function was applied to calculate additional risk level at fifth quantiles of each dose.
3. Results
Previous studies typically employed data in which only NOAEL and LOAEL were used to estimate UFL. Since the LOAEL and NOAEL are separated by only one dose interval, the risk level at LOAEL is often relatively low. In this work, we hypothesized that all dose levels higher than NOAEL are possible LOAELs (LOAELPs, see section 2). Thus, the risk levels for these LOAELPs will have a wider range, from nearly no risk to approximately full risk. This helped us analyze the relationship between UFL and risk level. The ideal dataset for this analysis should have enough dose groups to cover the full range of effect. But this kind of dataset is not abundant enough to give a reliable distribution. Therefore, we chose datasets containing at least one additional dose group other than NOAEL and LOAEL. At last, 141 datasets from 47 chemicals passed our quality check, and subsequently, additional risks and LOAELP/NOAEL ratios were calculated. In total 323 ratios were acquired, given that each dataset provided at least two LOAELPs. The possible propensities of the datasets were also analyzed, and proved to be unbiased (table 1 and S1 available at stacks.iop.org/ERL/7/034036/mmedia).
Table 1. Description of the datasets selected from NTP.
| Category | Description |
|---|---|
| Organ | Test endpoints are from 21 organs, mainly from liver, lung and nose |
| Chemical | 42 organic, 5 inorganic |
| Species | 49 from mouse, 92 from rat |
| Gender | 89 female, 52 male |
| Exposure | 21 food, 62 gavage, 47 inhalation, 11 water |
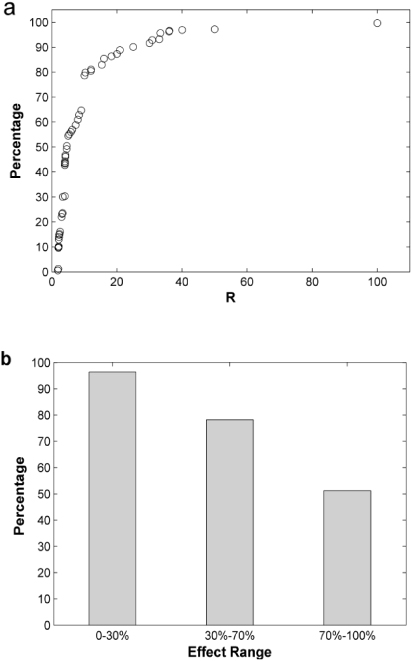
Figure 2. Cumulative distribution diagram of all 323 LOAELP/NOAEL ratios (R) (a) and the coverage rate of UFL value 10 in different effect range (b). Data applied in (a) was divided into three effect groups in (b) according to their additional risk levels. For example, 70%–100% group included the data whose additional risk sizes at LOAELP are between 70% and 100%. The ordinate in (b) represents the percentage of R values less than or equal to 10 in all the data within that group, which means the percentage of cases that value 10 can cover.
Download figure:
Standard image3.1. Effect of additional risk level on UFL
To describe the relationship between risk level and the corresponding UFL, the cumulative distribution was drawn in figure 2(a). The coverage of traditional default UFL value (10) was only 79%, which suggests the inadequacy of applying this default UFL value, when all the possible LOAELs were considered. Moreover, when data were divided into three groups according to the range of additional risk, the result roughly showed the relationship between the LOAELP/NOAEL ratios and risk levels. The coverage rate of default value 10 for each group was calculated respectively, as shown in figure 2(b). When the additional risk was restricted within 30%, the coverage of UFL 10 was 96% (133 data points out of 138), which was considered to provide sufficient protection as most previous studies have shown. On the other hand, when the range of additional risk was between 30% and 70%, this coverage decreased to 78% (79 out of 101). Moreover, in the highest risk group, UFL 10 only covered 51% of data (43 out of 84) when the additional risk is higher than 70%.
3.2. Establishment of relationship between UFL and risk level at LOAEL
At first, we tried to use all 323 data points to retrieve the relationship between LOAELP-to-NOAEL ratio and additional risk level at LOAEL directly. Unfortunately we were unsuccessful, because even though visually there was a roughly positive correlation, the data points were too scattered to get a well fitted curve (data not shown). Next, we wondered within what risk level of LOAEL, a default UFL could provide protection for 95% cases. In other words, we tried to find out what risk is usually induced at the dose of UFL × NOAEL, so that the lower 5% risk level can ensure a conservative enough UFL. To this end, we re-screened data from our collection, and 64 datasets having the highest dose larger than or equal to 10 times NOAEL (10× NOAEL) were selected. The additional risk levels at 10× NOAEL were calculated from the fitted curves, which were obtained from BMDS. Although we can calculate this 10× NOAEL risk level from all the data sets, we considered that the calculated points located within the original dataset can ensure high accuracy. Therefore only 64 datasets met the requirement. We could have also screened the data for higher dose levels, for instance 11× NOAEL. However, the number of qualified datasets would have been even lower and could not provide a reliable distribution.
These calculated additional risk levels were also highly scattered, and they were normally distributed by Lilliefors Test (histogram in figure 3(a)). The resulting probability density curve is also shown in figure 3(a). The lower fifth percentile is located at additional risk 0.162, which means that when the additional risk is less than or equal to 16.2%, the default value of 10 can provide at least 95% degree of protection. The same way was used to derive the risk levels at 5× to 9× NOAEL, and the lower fifth percentiles were calculated respectively (figure 3(b)). Surprisingly, the fitting result shows a nicely linear correlation between pre-set UFL and the lower limit of additional risk.

Figure 3. The correlation between UFL and additional risk level. (a) Describes the distribution of additional risk levels at the dose of 10× NOAEL. Histogram shows the frequency (number of datasets) in 10 uniform additional risk intervals that range from 10 to 100%. The fitted normal distribution density curve is also shown. (b) Shows the relationship between UFL and the fifth percentile of additional risk size.
Download figure:
Standard image3.3. Comparison with BMD method
To compare with the BMD method, we used the datasets with additional risk sizes at LOAEL within the range of 5.3%–16.2%. This range corresponds to the UFL value 5–10, since we are not sure whether the linear correlation derived from figure 3(b) can be extrapolated. This requirement was met by 25 out of 141 datasets. For each dataset, firstly, we used BMDS to get the BMDL at BMR of 10% for the original data. Secondly, to imitate the dataset without NOAEL, we deleted the NOAEL group and any other lower dose levels for each dataset. BMDL was calculated again by BMDS for the truncated dataset, and the new BMDL was named BMDLT. Thirdly, the UFL was calculated by the formula in figure 3(b) according to the risk level at LOAEL. The extrapolated NOAEL (NOAELE) equals LOAEL/UFL. All these three values were divided by NOAEL for every dataset, and the logarithms of their quotients were plotted (figure 4). In average, most NOAELE were smaller than NOAEL, while the BMDLs were always larger than NOAEL. However, the standard deviation from NOAELE groups is the smallest (table 2).
Table 2. Statistical analysis the data derived from BMD and new UFL method.
| Logarithm value (base 2) | BMDL/NOAEL | BMDLT/NOAEL | NOAELE/NOAEL |
|---|---|---|---|
| Median (M) | 1.12 | 0.76 | −1.49 |
| Standard deviation (SD) | 0.85 | 1.19 | 0.71 |
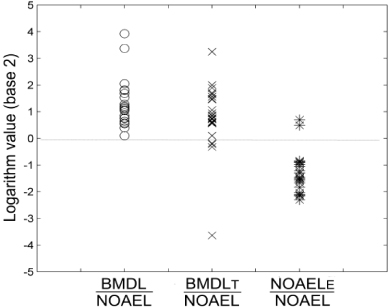
Figure 4. Comparison of BMD method and new UFL method. The logarithm (base 2) of BMDL/NOAEL, BMDLT/NOAEL, and NOAELE/NOAEL from 25 datasets was shown. BMDL was calculated by BMDS. BMDLT was calculated from the same datasets after deletion of NOAEL and any lower dose group. A 10% additional risk was chosen as the BMR for both calculations. NOAELE equals LOAEL/UFL (UFL was calculated from the equation in figure 3(b)).
Download figure:
Standard image4. Discussion
The main purpose of this study is to present a new method to determine the value of UFL, based on the dose–response relationship. In most cases, the dose–response curve is monotonically increasing. This intrinsic property determines a positive correlation between UFL and risk size. This idea is also supported by US EPA, who considered that severity of the response at LOAEL is one of the driving forces to apply a reduced UFL other than 10 (Stedeford et al 2007). However, no concrete relationship has been reported.
BMD methodology can overcome this problem by considering the shape of dose–response. Although BMD is a better method theoretically, there is not a good way to determine BMR level scientifically. In this work, we proposed an assumption that every dose level higher than NOAEL can be a possible LOAEL. This assumption not only makes it possible to study the LOAEL with high effect level, but also integrates the dose–response information which was not considered for deriving traditional UFL. However, this assumption itself is not enough to build up the UFL–risk size relationship directly, since the data points were too scattered as mentioned in the results. The key breakthrough of our method is to solve the problem in an opposite direction by answering what risk level of a LOAEL can be protected by a specified UFL, and then use this information to deduce UFL–additional risk level relationship. Although the risk level distribution should be analyzed one by one for each specified UFL, the relationship between UFL and risk size can be generated from the paired data. For the details of the method, a flow diagram was drawn in figure 5.
With this new method, we found a linear formula to express the relationship in a certain range of effect level, that is, from 5.3% to 16.2%. This short range may be one of the reasons for the nearly perfect linear relationship. Within this range, the UFL is from 5 to 10. This is much better than one default UFL value for all the cases. Lower UFL will lead to higher quality standard, which will decrease the expense for example in waste water treatment. The cost-benefit analysis should be included in the adoption of uncertainty factors other than precautionary principle (Steel 2011). However, the risk range is relatively narrow, which limits the use of this result. There are two major causes: one is the nature of the wide risk distribution at a certain dose interval higher than NOAEL. For 10× NOAEL, the median of risk distribution is 0.56, while the standard deviation is 0.24, which places the risk low at fifth percentile. The other is that limited datasets are available to meet the requirement for a normal distribution. Thus the higher the pre-set UFL is, the fewer datasets we can get. It is unclear whether the linear formula can be used to extrapolate UFL with higher risk level (>16.2%). More qualified datasets are needed to solve this problem. Furthermore, this result tells us default value 10 is not conservative enough at high risk (>16.2%) for chronic noncancer data.
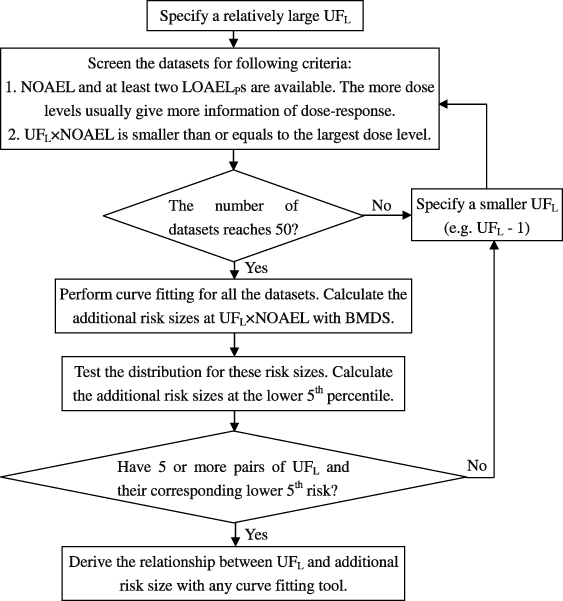
Figure 5. A flow diagram of the novel method for deriving a risk-size-based UFL.
Download figure:
Standard imageWhen the results from this new method were compared with the BMD approach, three differences were noticed. First, BMDL10s from chronic quantal data were all higher than NOAELs. This is different from the BMDL analysis from developmental toxicity data (Allen et al 1994, Faustman et al 1994), which showed that BMDL1, BMDL5 and BMDL10 are all smaller than NOAELs in average with BMDL10 most close to NOAEL. Since the selection of 5–10% BMR was largely based on these results, the 10% BMR seems to be higher for these chronic quantal data. However, the NOAELE was lower in average than NOAEL. This result is predictable from the method we used, because the dose interval from LOAEL at a certain risk level to NOAEL will be shorter than the distance represented by calculated UFL by a 95% chance. One criticism of NOAEL is its statistically-based derivation and consequently the fact that the possibility of adverse effect at NOAEL cannot be excluded (Gaylor 1992); additionally, since it has to be one of the experimental doses, the value of NOAEL also depends on the number and spacing of these predetermined doses. Our method can provide a conservative extrapolation starting point as well as that achieved by BMD method. If 95% of protection gives too conservative result, 90% could be another choice. One of the advantages of our method is that we do not need to select different BMRs subjectively for different datasets, which is still a disputed issue.
Furthermore, when the data points at NOAEL and other lower dose were deleted, BMDLT was lower than BMDL in average. This is also predictable, since most dose–response curves are 'S' shaped and deletion of NOAEL will usually lead to a less steep curvature between LOAEL and dose zero. The result makes the BMDLT more conservative, which is not favored by the present rule of BMR selection. Thus, if NOAEL is absent for an 'S' shaped dataset, the analytical result suggests a possible adjustment of BMR to make it comparable with the common selection for that type of data (10% for quantal data, 5% for reproductive and developmental data, and 1% for epidemiological data suggested by EPA Benchmark Dose (BMD) methodology).
Additionally, the standard deviation of BMDL/NOAEL and NOAELE/NOAEL are comparable. This is partially supported by Slob and Pieters' opinion that BMD method relies on the experiment errors comparable to the NOAEL/LOAEL approach (Slob and Pieters 1998). However, the SD of BMDLT/NOAEL increases. Since the BMDLT was derived from truncated data, in theory, the estimation is not as accurate as BMDL from the intact dataset. This indicates that our approach has relatively less errors when NOAEL is not available.
In conclusion, this study provided a new method to establish the relationship between the UFL and additional risk level at LOAEL for the first time. This method incorporates dose–response information, and has some advantages over BMD approach, such as ensuring conservativeness, avoiding BMR selection and giving better extrapolation when NOAEL is not available. It can be an alternative method for NAEL estimation when BMD methodology is not fully mature.
Acknowledgments
This work is supported by Youth Science Fund (No. 21007030) and National Science Fund for Distinguished Young Scholars (No. 50825801). We also appreciated the supports from National water pollution control and governance major projects of science and technology, research of water quality criteria about priority control pollutants in key watershed (2012ZX07501-003).