

Abstract
Institutional settings play a key role in shaping land cover and land use. Our goal was to understand the effects of institutional changes on agricultural land abandonment in different countries of Eastern Europe and the former Soviet Union after the collapse of socialism. We studied ∼273 800 km2 (eight Landsat footprints) within one agro-ecological zone stretching across Poland, Belarus, Latvia, Lithuania and European Russia. Multi-seasonal Landsat TM/ETM + satellite images centered on 1990 (the end of socialism) and 2000 (one decade after the end of socialism) were used to classify agricultural land abandonment using support vector machines. The results revealed marked differences in the abandonment rates between countries. The highest rates of land abandonment were observed in Latvia (42% of all agricultural land in 1990 was abandoned by 2000), followed by Russia (31%), Lithuania (28%), Poland (14%) and Belarus (13%). Cross-border comparisons revealed striking differences; for example, in the Belarus–Russia cross-border area there was a great difference between the rates of abandonment of the two countries (10% versus 47% of abandonment). Our results highlight the importance of institutions and policies for land-use trajectories and demonstrate that radically different combinations of institutional change of strong institutions during the transition can reduce the rate of agricultural land abandonment (e.g., in Belarus and in Poland). Inversely, our results demonstrate higher abandonment rates for countries where the institutions that regulate land use changed and where the institutions took more time to establish (e.g., Latvia, Lithuania and Russia). Better knowledge regarding the effects of such broad-scale change is essential for understanding land-use change and for designing effective land-use policies. This information is particularly relevant for Northern Eurasia, where rapid land-use change offers vast opportunities for carbon balance and biodiversity, and for increasing agricultural production on previously cultivated lands.
Export citation and abstract BibTeX RIS
1. Introduction
People and the way they use land are the most important drivers of global land-cover change, affecting biodiversity, ecosystem services, and ultimately, human well being (Foley et al 2005). All land-use decisions are made by local actors (e.g., land owners), but their actions are constrained by broad-scale factors, such as institutions (e.g., national policies and governance) and global markets (Geist et al 2006, Ostrom et al 1999). Increasing evidence suggests that these broad-scale factors are at the heart of land-use and land-cover change trends (hereinafter, LULCC) and that globalization is rapidly changing the way that countries interact with and affect one another (Eickhout et al 2007, Erb et al 2009). For example, drastic declines in the domestic meat production in post-Soviet Russia after 1990 resulted in a steep increase in meat imports from Brazil (Novozhenina et al 2009), which contributed to deforestation in Amazonia (Kaimowitz et al 2004). However, the effects of broad-scale factors on local decision making and LULCC are not well understood, partly, because high-level causes of land-use change, such as socio-economic and institutional transformation, often occur gradually, which makes it difficult to assess their relative importance.
When societies and institutions change rapidly, opportunities arise to better understand the drivers and processes of land-use change. One of the most drastic socio-economic and political changes in the late 20th century was the collapse of socialist governments in Eastern Europe and the former Soviet Union and the subsequent transition from state-command to market-driven economies. The dismantling of the state-command system, introduction of free-market principles, withdrawal of governmental regulation and support, and land reforms caused fundamental changes in all sectors of the economy, including agricultural land use (Lerman et al 2004, Lioubimtseva and Henebry 2008). Official statistics and case studies suggest that the transition in Eastern Europe and the former Soviet Union countries, including Russia, resulted in urban sprawl (Boentje and Blinnikov 2007), increased logging in some areas (Achard et al 2006, Brukas et al 2009, Kuemmerle et al 2009, Urbel-Piirsalu and Bäcklund 2009), decreased logging in others (Bergen et al 2008, Eikeland et al 2004, Pallot and Moran 2000), and caused widespread agricultural land abandonment (Baumann et al 2011, Bergen et al 2008, de Beurs and Henebry 2004, Hostert et al 2011, Ioffe and Nefedova 2004, Kovalskyy and Henebry 2009, Kuemmerle et al 2008, Lioubimtseva and Henebry 2008). In post-Soviet Russia alone, more than 40 million hectares of arable land was abandoned within 20 years (Rosstat 2010).
Agricultural land abandonment has strong environmental and socio-economic consequences. Reforestation on abandoned agricultural lands can defragment forests, sequester carbon (Smith et al 2007, Vuichard et al 2009) and improve hydrological regimes and water quality (Sileika et al 2006). However, the early successional vegetation that grows on abandoned fields provides fuel for wildfires (Dubinin et al 2010, Lloret et al 2002) and increases the propagule pressure of weeds, pests and pathogens on the remaining agricultural fields (Smelansky 2003). Abandonment may also cause spillover effects that lead to marginalization of historic agricultural landscapes (Angelstam et al 2003, Elbakidze and Angelstam 2007). In the globalized world, widespread agricultural land abandonment in one area may shift agricultural production and land use to elsewhere, which potentially threatens vulnerable ecological systems (Lambin and Meyfroidt 2011). However, recultivation of abandoned areas may also result in increased agricultural production and reduce the pressure on world food markets (FAO 2010). In sum, changes in agricultural land use have multiple repercussions on ecosystem services, biodiversity and the economy. Therefore, better monitoring and understanding of agricultural land-use change is important and can be used to guide land-use policy and management.
The patterns and rates of agricultural land abandonment varied between and within the post-socialist countries in Eastern Europe, which is likely a result of different socio-economic and institutional trajectories regarding land use after the collapse of the Soviet Bloc (Müller and Munroe 2008, Müller et al 2009, Kuemmerle et al 2008, Lioubimtseva and Henebry 2008). Unfortunately, direct comparisons among case studies on agricultural land abandonment are difficult because of different study designs and varying definitions of agricultural land abandonment. Nevertheless, case studies suggest that diverse post-socialist reform policies resulted in different country-specific land-use trajectories (Hostert et al 2011, Kuemmerle et al 2008). For example, during the 1990s, agricultural land abandonment rates in the cross-border region of the Eastern Carpathians differed markedly among Poland, Slovakia and Ukraine (14%, 13% and 21%, respectively, (Kuemmerle et al 2008), which are three countries that had different land reform policies. Agricultural land abandonment rates were almost double in Lithuania when compared with Belarus during the 1990s in the Belarus and Lithuania cross-border area (28% and 14%, Prishchepov et al 2012). The institutions that affect agriculture also changed very differently in Belarus and Lithuania. This occurrence suggests that the type of institutional change fundamentally influences the local response to land use and land-use outcomes. Cross-border studies can help distinguish the effects of institutional changes on land use because borders demarcate contrasting macro-environments in areas where the natural conditions are often similar (Hostert et al 2011, Kuemmerle et al 2008). Therefore, studying cross-border changes is a useful for deriving insights about broad-scale drivers of agricultural land abandonment.
The classic model for a thriving agricultural sector is an open-market economy that is accompanied by secure land ownership, available credit, and a functioning land market that mediates between successful and unsuccessful farmers (Deininger 2003, Lerman et al 2004). Agricultural production will also attempt to increase the yield on fertile agricultural lands, while abandonment on marginal agricultural lands will be reduced via land market redistributions. Nevertheless, no country in Eastern Europe satisfies all of these conditions, and land privatization strategies and land market characteristics are highly variable (Lerman et al 2004). Thus, in similar agro-ecological conditions, we hypothesized that there would be less agricultural land abandonment where land titles were more secure, such as in Poland, where the majority of the agricultural land was privately owned during socialism and no change in ownership was necessary (Turnock 1998). Additionally, we hypothesized that lower agricultural land abandonment rates would exist where market mechanisms were complemented by stronger connections of the landowners to their former properties and who may still work in agricultural sector (e.g., in the Baltics, where collectivization of agricultural land occurred later than in Belarus and Russia, Macey et al 2004, Lerman et al 2004, Sakovich 2008, Stuikys and Ladyga 1995, Turnock 1998). Conversely, we expected higher rates of agricultural land abandonment where land markets were lacking, land tenure was unsecure (e.g., Russia) (Lerman et al 2004, Macey et al 2004, Turnock 1998, Sakovich 2008), and people were disconnected from their former properties for longer durations (e.g., Belarus and Russia) (Macey et al 2004, Lerman et al 2004, Sakovich 2008).
We utilized the natural experiment of the collapse of socialism in Eastern Europe and the former Soviet Union (we will subsequently label this as Eastern Europe because this study deals only with the European part of the former Soviet Bloc) to investigate whether the rates of agricultural land abandonment responded to different types of institutional changes. Eastern Europe provides a particularly compelling natural experiment because its countries responded to the change from plan to market economies with contrasting transition policies while the region as a whole is relatively environmentally homogeneous and the socio-economic environments are comparable. This setup allows the connection of broad-scale land-use changes with the political and institutional environment.
Our major goal was to assess differences in rates and patterns of agricultural land abandonment among and within post-socialist countries with similar agro-environmental conditions. Our specific objectives were as follows:
- (1)map agricultural land abandonment from 1990 to 2000 in one similar agro-climatic region across several post-socialist countries by classifying multi-temporal Landsat TM/ETM + satellite images;
- (2)summarize the rates and spatial patterns of agricultural land abandonment among and within the countries;
- (3)discuss the differences in abandonment rates in relation to institutional and socio-economic changes.
2. Methods
2.1. Study area
To define our study area, we selected a part of Eastern Europe that contained as many countries as possible while still being as homogeneous as possible in terms of its agro-ecological conditions. We stratified Europe using the following agro-ecological products: using average annual mean temperature for January and July, the number of days with a mean temperatures over 10 °C, and an average annual evapotranspiration (New et al 2002), which we grouped into 80 clusters using ISODATA clustering (Leica Geosystems 2006), and then selected two clusters that stretched across several countries. Finally we constrained two selected clusters using: (a) Soviet agro-natural zoning (Kashtanov 1983); (b) geobotanical maps (Alexandrova and Yurkovskaja 1989) (c) agro-ecological zoning (AEZ) climatic limitations on wheat growth (IIASA 2000) (figure 1). The final study area includes part of Belarus, Latvia, Lithuania and Russia, which are all part of the former Soviet Union and part of post-socialist Poland (table 1).

Figure 1. Study area and Landsat footprints. Soil fertility is based on reclassification of soils taken from Batijes (2001). Climatic constraints are taken from IIASA (2000). Agro-ecological zoning is based on agro-ecological stratification described in this letter. Country boundaries are bold grey and province boundaries and fine grey. To interpret correctly the colors in this figure legend, please refer to the web version of the article.
Download figure:
Standard imageTable 1. Summary of the transition approaches in Eastern European countries within study area. Adapted with permission from Lerman et al (2004).
| Country | Potential private ownership after 1990 | Privatization strategy | Allocation strategy | Legal attitude to transferability after 1990 | Relevant legislation |
|---|---|---|---|---|---|
| Belarus | Household plots only | None | None | Use rights non-transferable; buy-and-sell of private plots dubious | Law and Land ownership, June 1993 |
| Latvia | All land | Restitution | Plots | Buy-and-sell, leasing | Land Reform in Rural Areas Act, November 1990 |
| Lithuania | All land | Restitution | Plots | Buy-and-sell, leasing | Law on Land Reform, June 1991 |
| Poland | — | Sell state land | Plots | Buy- and-sell, leasing | — |
| Russia | All land | Distribution | Shares | Leasing, buy-and-sell dubious | Law on Land Reform, November 1990; Constitution, December 1993; Land Code, January 2002 |
The study region is well suited for agriculture, especially after melioration, liming and fertilization of Podzolic soils (Folch 2000). During the last decades of the Soviet era, the region became one of the primary agricultural areas of the Soviet Union, especially after the failure of the Soviet government to expand wheat cultivation in Kazakhstan (Ioffe 2004, Ioffe et al 2006). The primary summer crops are barley, rye, oats, sugar beets, fodder maize and potatoes, and the primary winter crops are winter wheat, winter barley and winter rapeseed (Gataulina 1992). Cattle breeding, dairy farming and poultry production are also common.
During the Soviet era, the agricultural sector was highly subsidized and markets were guaranteed. While land tenure and agricultural management were similar in the countries, with the exception of Poland, differences still existed in rural development (Lerman et al 2004, Nefedova and Treivish 1994). For instance, the density of paved roads in Soviet Lithuania was four times higher than in the Soviet central European Russian provinces (table 2). Soviet Belarusian, Latvian and Lithuanian agricultural enterprises were also better equipped than those in Soviet Russia, and more tractors were available for Polish farmers (table 2). After the collapse of the Soviet Union, the official national statistics reported substantial declines in cultivated areas up to 39% in Russia and 38% in Latvia during the first decade of transition, while the amount cultivated area remained stable in Poland and Belarus during the same period (figure 2). Similarly, livestock numbers declined drastically by up to 62% in Lithuania and 34% in Russia during the first decade of transition, while there were few changes in Poland (CSB 2010, Goskomstat 2002, GUS 1999, 2012, Lithstat 2001).

Figure 2. Agricultural change in the study region ((A): livestock decline; (B): crop decline).
Download figure:
Standard imageTable 2. Socio-economic and environmental conditions of selected regions in 1989, i.e., the pre-transition time from state-command to market-driven economies.
| Provinces | Landsat TM/ETM + footprint (path/row) | Country after 1990 | Rural population density (people km−2)a | Road density (km km−2)a | Milk production (kg/cow)a | Grain yield (centners/hectare)a | Tractors (hectares of arable land/tractor)a | Average annual precipitationb | Temperature growing periods > 5 °C b | Percentage of podzolic soils c | Percentage of agricultural land before 1990d |
|---|---|---|---|---|---|---|---|---|---|---|---|
| Kaliningrad | 188/022 | Russia | 14 | 35 | 3152 | 12 | 720 | 2803 | 74 | 55 | |
| — | 188/022, 186/021, 186/022 | Lithuania | 27 | 51 | 3733 | 28.5 | 47 | 629 | 2744 | 60 | 48 |
| — | 186/021 | Latvia | 12 | 28 | 2880 | 23.5 | 44 | 630 | 2598 | 34 | 36 |
| Mogilev | 182/022 | Belarus | 15 | 22 | 3219 | 25.8 | 55 | 594 | 2705 | 83 | 57 |
| Vitebsk | 182/022 | Belarus | 12 | 20 | 3031 | 21.8 | 50 | 640 | 2658 | 98 | 43 |
| Grodno | 186/022 | Belarus | 20 | 25 | 3486 | 30.8 | 48 | 631 | 2780 | 87 | 37 |
| Smolensk | 182/022 | Russia | 7.4 | 11 | 2478 | 11.3 | 82 | 649 | 2649 | 89 | 31 |
| Kaluga | 180/022 | Russia | 11.0 | 14 | 2527 | 13.8 | 54 | 680 | 2663 | 86 | 35 |
| Tula | 178/022 | Russia | 13.5 | 18 | 2645 | 19.2 | e | 638 | 2735 | 39 | 55 |
| Rjazan | 176/022 | Russia | 11.8 | 12 | 2881 | 16.8 | 70 | 566 | 2791 | 36 | 49 |
| Vladimir | 176/021 | Russia | 11.8 | 15 | 2880 | 16.2 | 74 | 605 | 2684 | 79 | 23 |
| Olstyn | 188/022 | Poland | 24.0 | 41 | 2914 | 34.8 | 23 | 713 | 2818 | 100 | 67 |
| Suwałki | 188/022 | Poland | 20.0 | 34 | 2958 | 28.5 | 20 | 642 | 2808 | 69 | 51 |
aStatistical data from Belstat (2002), Goskomstat (1991), Goskomstat LitSSR (1989), GUS (1987, 1992), Latvstat (1990). bClimatic data from IIASA (2000). cSoil data are taken from Batijes (2001). dPercentage of agricultural land are calculated from classified multi-date Landsat TM/ETM + images. eNot available.
After the collapse of the Soviet Union, each country in the study region, except for Latvia and Lithuania, followed a unique transition approach especially in regard to land reforms and the restructuring of the agricultural sector (Lerman et al 2004, Macey et al 2004) (table 1). In Russia, agricultural lands and former state and collective farm assets were privatized, and the shares were distributed among former farm employees. Farms often continued to operate in the form of corporate farms (e.g., joint-stock enterprises) and cooperatives (Lerman et al 2004). However, a moratorium on private agricultural land purchases and sales was enacted that lasted until 2003 (Lerman and Shagaida 2007). The restructuring of the agricultural sector did not facilitate the emergence of family farming. By 1998, Russia's agricultural sector was dominated by corporate farms with an average size of 6000 ha. Furthermore, 88% of these farms were essentially bankrupt (Goskomstat 2002, Ioffe and Nefedova 2004, Ioffe et al 2004, Lerman et al 2004). By 2000, more than 60% of the agricultural land was still owned by the government (Shagaida 2002).
Lithuania and Latvia restituted nationalized agricultural lands to previous owners and their heirs (nationalization had been accomplished by forcibly abolishing private ownership, and the land was transferred to the government, which created state and collective farms to manage nationalized agricultural lands) (Goetz et al 2002, Stuikys and Ladyga 1995). By 2003, 89% of all the agricultural land in Lithuania was owned by family farms, and 78% was in holdings of less than 5 ha (Lithstat 2010, Stuikys and Ladyga 1995). The Belarusian government allowed privatization of only a small part of its agricultural lands early in the transition period. In 1994, the Belarusian government reversed course and limited land ownership to small parcels and restricted land leases. By 2000, the state controlled 98% of Belarus's agricultural lands (Drager 2002, Ioffe 2004, Sakovich 2008). Poland was the only country in our study area that allowed private land ownership during socialism, albeit with strong governmental regulations (Turnock 1998). However, some agricultural lands were nationalized following the forced migrations immediately after World War II (especially in the north and south-eastern corners of Poland) (Kuemmerle et al 2008, Turnock 1998), and the state owned 24% of all agricultural land (Csaki and Lerman 2002, GUS 1992). During the transition, state and collective farms were dismantled, but the percentage of state-owned agricultural lands declined to only 20% by 1997 (Csaki and Lerman 2002).
2.2. Satellite image processing
The quality of official statistics is variable, dubious in regard to extraction of agricultural land abandonment and difficult to compare over time and among Eastern European countries. To overcome this limitation, we used satellite images to monitor agricultural land abandonment to ensure that a consistent approach was used across countries. To detect abandoned agricultural lands and highlight differences between the countries in our study area, we selected four Landsat TM/ETM + footprints that covered cross-border regions (figure 1) and four footprints within Russia to investigate the differences in agricultural land abandonment rates at the provincial level. We intentionally omitted Moscow province because of the disproportional allocation of welfare, foreign direct investment, and the speculative value of lands in the vicinity of Moscow (Bater 1994, Ioffe and Nefedova 2004, Rosstat 2002) (figure 1). We note that when we report the results for a specific country or province, the results refer only to the portion of the country or province covered by our satellite imagery. Altogether, we classified 46 Landsat TM/ETM + images for eight footprints to map agricultural abandonment circa 1990 (images ranged between 1985 and 1992) and circa 2000 (images ranged between 1999 and 2002). The images were ordered from the US Geological Survey (USGS) (glovis.usgs.gov), Eurimage (www.eurimage.com) and the R&D 'Scanex' archives (www.scanex.com). The selected images captured key multi-seasonal dates, which allow accurate detection of agricultural land abandonment (table 3, Kuemmerle et al 2008, Prishchepov et al 2012).
Table 3. Images used and cloud contamination for each Landsat TM/ETM + footprint.
| WRS2 path/row | 176/021a | 176/022a | 178/022 | 180/022a | 182/022a | 186/022a | 186/021 | 188/022 |
|---|---|---|---|---|---|---|---|---|
| Image dates | 01/06/1987 | 21/07/1988 | 01/06/1985 | 01/05/1986 | 28/05/1988 | 03/05/1989 | 25/06/1985 | 22/05/1985 |
| (dd/mm/yyyy) | 21/07/1988 | 22/08/1988 | 20/06/1986 | 04/07/1986 | 10/07/1992 | 06/07/1989 | 08/09/1989 | 14/05/1988 |
| 22/08/1988 | 06/09/1999 | 05/09/1989 | 05/10/1986 | 27/04/2000 | 24/09/1989 | 10/07/1999 | 16/10/1986 | |
| 06/09/1999 | 11/05/2000 | 22/09/2000 | 08/07/1999 | 08/09/1999 | 05/05/2000 | 23/04/2000 | 21/05/2002 | |
| 09/05/2002 | 14/07/2000 | 31/07/2001 | 10/09/1999 | 06/06/2000 | 10/07/1999 | 10/06/2000 | 06/06/2002 | |
| 28/07/2002 | 23/05/2002 | 20/09/1999 | 30/09/2000 | 16/07/2002 | ||||
| 05/11/2002 | ||||||||
| Clouds (%) | 7 | 9 | 3 | 10 | 0 | 4 | 6 | 8 |
aPath/row—landsat footprints visited during 2007–8 field campaign.
Images were co-registered using automatic tie point search (Leica Geosystems 2006) and USGS systematically terrain corrected L1T images were used as base maps. Positional accuracy for co-registered images measured by root mean square error (RMSE) was less than 15 m. No atmospheric correction was performed because it does not significantly improve the classification accuracy when multi-date composite images, which we used to group and classify images, are classified simultaneously (Song et al 2001, Prishchepov et al 2012). We used Landsat TM/ETM + bands 1–5 and band 7. Clouds and cloud shadows were masked out using image segmentation software (Definiens Imaging 2004).
Our classification catalog consisted of the following five classes: 'forest and wetland', 'permanent shrubs, tree lines and riparian vegetation', 'stable agricultural land', 'abandoned agricultural land' and 'other'. 'Stable agricultural land' consisted of tilled agricultural land and grasslands that were intensively used for grazing and hay cutting during the pre-transition era circa 1990 and after the first decade of transition circa 2000. We defined 'abandoned agricultural land' from a remote-sensing perspective as agricultural land used before 1990 for crops, hay cutting and livestock grazing that was no longer in use by 1999–2002 for any of the described land uses. On the ground, these areas typically represented non-managed grasslands that often contained early successional shrubs. Shrub encroachment in the study area usually takes place within three to five years after abandonment with faster shrub advancement on well-drained and formerly plowed fields (Karlsson et al 1998, Lyuri et al 2010, Utkin et al 2005). Our analysis of the official statistics and visual assessments of satellite imagery did not suggest any increases in agricultural land at the expense of 'forest and wetland', 'permanent shrubs, tree lines and riparian vegetation' and 'other' classes. Thus, we excluded such change classes from our classification catalog.
Validation data were collected primarily during field visits, from high-resolution satellite images (IKONOS and Quickbird images available via GoogleEarth™ mapping service), and from multi-seasonal Landsat TM/ETM+ images. Our validation data were collected independently from training samples. For accuracy assessment, we used a three-step, stratified-random sampling approach (Prishchepov et al 2012) modified from Edwards et al (1998). First, we selected cloud-free 1.28 m resolution QuickBird and IKONOS images that were obtained from GoogleEarth™. For the Landsat footprints with limited coverage by high-resolution images (WRS 2 path/row 182/22 and 180/22), we randomly generated 20 km×20 km blocks, similar in size to a QuickBird image. Second, to concentrate field data collection on agricultural lands, we derived a forest/non-forest mask for the QuickBird and IKONOS images and for the generated blocks. For Latvia, Lithuania, and Poland, we used the 100 m-resolution land-cover product from the Coordination of Information on the Environment program (CORINE) for the year 2000 (EEA 2006). For the forest/non-forest mask in Belarus and Russia, we used 1:500 000 digital Soviet topographic maps from circa 1989 (VTU GSh 1989). Third, we randomly placed validation points within the forested part of the forest/non-forest mask and within the non-forested part of the forest/non-forest mask that were within 300 m of roads, which we had digitized from topographic maps, the QuickBird and the IKONOS images, to facilitate field visits. We reduced the spatial autocorrelation by 0.14–0.25 (Moran's I) across our classified maps by placing a distance lag of at least 500 m among validation points based on the assessment of variograms constructed with GS + geostatistical package (www.gammadesign.com).
During fieldwork that was conducted in 2007 and 2008, we visited five out of the eight Landsat footprint regions (table 3). Validation points were geolocated using a non-differential GPS. Using semi-structured questionnaires, we reconstructed land management in 1990 and in 2000, wherever possible, by interviewing local farmers and agronomists. Within the forested part of the forest/non-forest mask, we assessed the accuracy of the 'forest and wetland' classification using only high-resolution images and expert interpretation of the reflection of the multi-seasonal Landsat TM/ETM + images. For points within the forested part of the forest/non-forest mask that corresponded to 'stable agricultural land' and 'abandoned agricultural land', we used spectral similarity and textural information to assign the land cover type from the imagery. Additionally, field observations were used if the points that were close to the forest edge and were accessible. Approximately 100 validation points for each class within each Landsat footprint were assessed for accuracy using ground reference and ancillary data.
To select training data for LULCC classification, we used field observations, the high-resolution images, and information obtained from multi-seasonal Landsat images. We used a Support Vector Machines classifier (SVM) to monitor agricultural land abandonment (Baumann et al 2011, Hostert et al 2011, Kuemmerle et al 2008, Prishchepov et al 2012). We selected ∼150–1000 training pixels per class depending on class proportion for each of eight footprints. We used the IDL tool ImageSVM (www.hu-geomatics.de) to automatically select the optimal SVM parameterization (Chang and Lin 2011, Hostert et al 2011, Kuemmerle et al 2008, Rabe et al 2009, Prishchepov et al 2012).
The classification accuracy was estimated using contingency matrices. We calculated the area weighted overall accuracy, the Kappa coefficient (KHAT), producer's and user's accuracies, and conditional kappa coefficients for each class (Congalton and Green 2008). We also adjusted the calculated areas and the rates of abandoned agricultural land on the basis of our accuracy assessments using an inverse calibration estimator with a Monte Carlo simulation technique (Czaplewski and Catts 1992). We constructed a normal curve of the error distribution with its mean and confidence intervals (α = 0.05) based on 10 000 Monte Carlo simulation runs for our area weighted contingency matrices for each classified Landsat footprint.
3. Results
We produced accurate LULCC maps using multi-seasonal imagery and the SVM change-detection approach. The conditional Kappa coefficients for 'abandoned agricultural land' were above 76% (table 4). The accuracy of 'abandoned agricultural land' varied for the selected footprints with user's accuracies between 80.6% (table 4, figure 1, Landsat TM/ETM + footprint 6) and 92.7% (table 4, figure 1, footprint 8), and the conditional Kappa values were between 76% and 91.7%. The highest overall accuracies were above 90% for footprint 3, footprint 8, footprint 2 and footprint 7 (95.2%, 92.8%, 92.6% and 90.7%, respectively) (table 4).
Table 4. Accuracy of the land-cover classifications in each Landsat footprint (UA = user's accuracy (%), PA = producer's accuracy (%), CK = conditional Kappa (%), OA = overall accuracy (%), KHAT = overall Kappa (%)) .
| WRS 2 path/row | Forest and wetland | Stable agricultural land | Abandoned agricultural land | Permanent Shrubs, tree lines and riparian vegetation | Other | OA | KHAT | ||||||||||
|---|---|---|---|---|---|---|---|---|---|---|---|---|---|---|---|---|---|
| UA | PA | CK | UA | PA | CK | UA | PA | CK | UA | PA | CK | UA | PA | CK | |||
| 176/021 | 96.4 | 97.5 | 94.8 | 96.3 | 89.6 | 93.4 | 92.7 | 76.2 | 91.7 | 63.9 | 86.5 | 59.2 | 100.0 | 81.2 | 100.0 | 92.8 | 87.5 |
| 176/022 | 100.0 | 99.2 | 100.0 | 86.8 | 94.3 | 83.6 | 85.8 | 83.7 | 81.8 | 82.6 | 81.8 | 76.4 | 100.0 | 35.2 | 100.0 | 90.7 | 87.1 |
| 178/022 | 95.3 | 92.9 | 94.4 | 89.6 | 91.5 | 79.6 | 80.6 | 51.7 | 76.0 | 46.9 | 80.3 | 41.3 | 88.9 | 79.5 | 88.2 | 83.7 | 77.3 |
| 180/022 | 97.4 | 83.0 | 95.5 | 89.0 | 88.2 | 86.4 | 89.1 | 92.7 | 85.5 | 60.0 | 88.2 | 54.4 | 100.0 | 100.0 | 100.0 | 86.7 | 81.0 |
| 182/022 | 95.1 | 76.8 | 92.9 | 95.1 | 91.2 | 91.9 | 92.3 | 85.7 | 91.2 | 63.7 | 94.2 | 57.0 | 100.0 | 70.6 | 100.0 | 86.1 | 81.0 |
| 186/021 | 98.2 | 98.0 | 97.2 | 96.4 | 93.8 | 94.7 | 90.7 | 98.6 | 88.7 | 83.8 | 87.6 | 82.4 | 96.3 | 82.5 | 96.0 | 95.2 | 93.2 |
| 186/022 | 99.3 | 98.7 | 98.6 | 97.4 | 89.0 | 96.0 | 84.0 | 76.8 | 81.7 | 50.0 | 89.9 | 48.6 | 97.9 | 98.0 | 97.8 | 92.6 | 89.0 |
| 188/022 | 97.5 | 92.8 | 94.4 | 90.1 | 88.2 | 89.3 | 82.5 | 79.2 | 80.0 | 62.2 | 77.8 | 56.3 | 96.4 | 97.0 | 96.2 | 84.1 | 81.5 |
Our results indicated widespread agricultural land abandonment across the study area. Of the 9 million ha with 95% confidence intervals (±99 600 ha) that were in agricultural use in 1990 in our eight footprints, 27% ± 1% (2.5 million ha ±82 300 ha) were abandoned by 1999–2002. The highest abandonment rates for any country were observed in Latvia with 42% ± 2.6%, (176 700 ha, ±4700 ha, figure 3(A)). We also observed widespread agricultural land abandonment for the studied part of Russia comprising 31.3% ± 1.4% (1.7 million ha ±23 300 ha) of the agricultural land that was managed in 1990. Abandonment rates in Lithuania were somewhat lower (28.4% ± 1.4%, (543 900 ha ± 7600 ha) and were the lowest in Belarus (13.5% ± 1.2%, 133 000 ha ± 1600 ha) and Poland (14% ± 2.0%, 101 000 ha ± 2020 ha).

Figure 3. Agricultural land abandonment rates ((A): by country; (B): separately for Belarus and Russia by provinces).
Download figure:
Standard imageCross-border areas revealed marked differences in the rates of agricultural land abandonment between neighboring countries. For example, in the cross-border area of Belarus and Russia (figure 4(C)), the abandonment rates were 10% ± 1.2% and 47% ± 2.2%, respectively. This was the strongest cross-border difference in land-use change observed in our study area. In the cross-border region of Russia, Lithuania, and Poland (footprint 1, figure 1), the rates of agricultural land abandonment were 43% (±2.0%), 19% (±2.0%), and 14% (±2.0%), respectively (figure 4(A)). In the cross-border region of Lithuania and Belarus (footprint 2, figure 1), the abandonment rates were 29% (±1.0%) and 15% (±1.2%), respectively (figure 4(B)).

Figure 4. A: Agricultural land abandonment pattern in the cross-border Poland and Kaliningrad province of Russia. B: Agricultural land abandonment pattern in the cross-border Grodno province of Belarus and Lithuania. C: Agricultural land abandonment pattern in the cross-border Mogilev province of Belarus and Smolensk province of Russia. D: Agricultural land abandonment pattern in Iznokovskij district, Kaluga province of Russia. E: Agricultural land abandonment pattern between Moscow and Tula province of Russia. F, G: Agricultural land abandonment pattern in Rjazan province of Russia. H: Agricultural land abandonment pattern in Vladimir province of Russia.
Download figure:
Standard imageWe observed even higher rates of abandonment within some provinces in Russia, and the highest rates were observed in Smolensk province (46% ± 1.4% of abandoned agricultural land, figure 3(B)). Abandonment rates varied less within Belarusian and were consistently lower than in the other countries (figure 3(B)).
Abandonment rates also varied greatly at the district level, both across and within countries ('rayons' in Belarus, Latvia and Russia; 'apskritys' in Lithuania, and 'gminy' in Poland) (figure 5). Again, the highest rates of abandoned agricultural land were found in Russia (figure 5). During the 1990s, abandonment rates at the district level were as high as 60% in the Russian districts of Smolensk and Rjazan province. Most of the districts with exceptionally high abandonment rates had a smaller initial share of agricultural lands, were distant from provincial capitals, experienced strong rural population decline and had a low density of roads (figure 5).
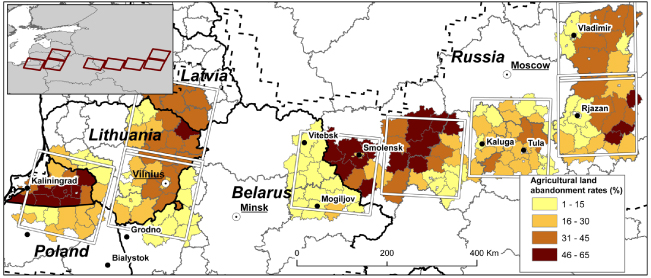
Figure 5. Agricultural land abandonment rates by districts. Country boundaries are bold black, province boundaries are bold grey and district boundaries are fine grey. Defined agro-ecological zoning—black dotted line. To interpret correctly the colors in this figure legend, please refer to the web version of the article.
Download figure:
Standard image4. Discussion
We produced very accurate LULCC maps particularly in those cases where Landsat TM/ETM + multi-seasonal image dates combinations were optimal (table 4, WRS 2 path/row 176/021, 186/021, 186/022) (Kuemmerle et al 2008, Prishchepov et al 2012). Our satellite image analyses showed widespread agricultural land abandonment after the collapse of socialism with marked regional differences in the amount and rates of abandonment. These regional differences are most likely related to broad-scale political and institutional factors and to diverging socio-economic developments during the post-Soviet phase. Our study design curtailed agro-ecological differences among countries, and the socio-economic conditions between countries were similar prior the transition, particularly among countries that were part of the Soviet Union.
Abandonment rates in the Baltics were among the highest, potentially because of the restitution of land to previous owners and their heirs who live in cities or are retired and thus have limited interest and opportunities in agriculture (Bušmanis et al 2001, Goetz et al 2002, Grinfelde and Mathijs 2004, Nefedova and Treivish 1994, Nikodemus et al 2005). An additional challenge was that many reforms were not completed by 1999–2002, and land-market mechanisms did not function properly during the 1990s, which prevented quick transfer of land assets from less to more entrepreneurial farmers (Bušmanis et al 2001, Goetz et al 2002). The collapse of the Soviet Union eliminated the guaranteed market for agricultural inputs and outputs within the USSR and contributed to the sharp decline of the agricultural sector in Latvia and Lithuania (World Bank 2011). The lower abandonment rates in Lithuania compared with Latvia are likely due to the larger economic importance of the agricultural sector in Lithuania and the better socio-economic and rural infrastructure prior the transition (Goetz et al 2002) (table 2).
Abandonment rates were high in all Russian provinces. The dramatic decline of government support for agriculture from $ 39 billion in 1990 to just $ 2 billion in 2000 (Goskomstat 2000), a lack of a functional land market and the limited availability of credit, are likely the primary reasons for the contraction of the agricultural sector in Russia (Lerman and Shagaida 2007). The nearly complete elimination of subsidies for producers and consumers caused a subsequent drop in fertilizer use and resulted in high rates of abandonment and in decreased crop yields on the remaining utilized agricultural lands during the first decade of the transition (Trueblood and Arnade 2001).
The abandonment rates were lower in the Polish part of the study area than in the Baltics and in Russia but higher than in other parts of Poland (GUS 1992, 1999, Turnock 1998). Similar to the Polish Eastern Carpathians (Kuemmerle et al 2008), more agricultural land was nationalized in the Polish part of our study than in other parts of Poland because the German population here was forcefully relocated after World War II. Furthermore, the agricultural lands were nationalized, and state farms were established (Turnock 1998). After the dissolution of the Soviet Bloc, many previously state-owned lands remained unused because of institutional hurdles to privatize previously state-owned agricultural land assets (Milczarek 2000). Nevertheless, relatively low abandonment rates were observed in Poland compared with other countries in our study area, which suggests that the partial continuation of private agriculture during the socialist period allowed the Polish agricultural sector to quickly adjust to the post-socialist framework.
Abandonment rates were similar in Belarus and Poland despite the diverse policy approaches to the post-socialist transition. The Belarus government abolished the privatization of agricultural land and the capital assets of the state and collective farms in 1994. Similar to the Soviet period, government subsidies and a complex system of offsets within Belarusian state enterprises ensured that state and collective farms continued to receive inputs and outputs at favorable and fixed prices (Ioffe 2004, Sakovich 2008). As a result, the contraction of the agricultural sector after the collapse of socialism was lower in Belarus than in the other countries of the region, and the rate of abandonment remained low (Hostert et al 2011).
The differences in government support between Belarus and Russia may also explain the substantial differences in abandonment rates in the border region of these countries. For example, in 2000, the share of unprofitable agricultural enterprises was very similar in the neighboring provinces of Mogilev in Belarus and Smolensk in Russia (65% versus 75%, Belstat 2002, Rosstat 2002). However, agricultural abandonment was much lower in Mogilev province (10%) than in Smolensk province (46%). This lower agricultural abandonment was likely the result of higher state support for agriculture in Belarus.
The different trajectories of transition in post-socialist Eastern Europe resulted in large differences in agricultural land abandonment rates among countries and are still affecting decisions regarding agricultural land use. While official statistics can be dubious in regard to the actual estimation of agricultural land abandonment rates and patterns, which is why we used the more accurate method of remote sensing to derive agricultural land abandonment rates during the first decade of the transition, recent official statistics suggest that the arable lands in Latvia, Lithuania and Poland have expanded following EU accession in 2004. We postulate that both the advanced institutional conditions and access to agricultural and infrastructural subsidies stimulated the recultivation of abandoned agricultural lands (CSB 2010, GUS 2012, Lithstat 2010). During the same period, recent official statistics highlighted a continuing decline in arable land in Belarus (Belstat 2011) and Russia (Rosstat 2010) despite governmental stimulation of the agricultural sectors in Belarus and more recently in Russia. We attribute this continued decline to the postponed (Belarus) or incomplete (Russia) institutional transitions in the agricultural sector that, to date, contribute to ongoing agricultural land abandonment and its strong socio-economic and environmental implications.
5. Conclusion
Our analysis demonstrated that post-Soviet institutional changes in Eastern Europe after the collapse of the Soviet Union triggered widespread agricultural land abandonment during the first decade of transition. Broad-scale, country-specific reforms mediated by local and regional socio-economic and environmental conditions resulted in large differences in the rates of agricultural abandonment. Where institutions governing agricultural land use changed relatively little (e.g., Belarus) and where institutional change was quick and new institutions were relatively strong during the transition (e.g., Poland), we observed the lowest abandonment rates. Conversely, higher abandonment rates were found in countries where the establishment of new institutional regulations for agricultural production was delayed (e.g., Latvia, Lithuania and Russia).
After 20 years of transition, many abandoned agricultural fields slowly but steadily reverted to forest. This reversion has widespread implications on the carbon balance and on biodiversity but also increases the environmental and economic costs of recultivation. These implications are particularly relevant to Northern Eurasia where rapid land-use changes offer vast opportunities for conservation and for increasing agricultural production on previously cultivated lands. Improved knowledge of the effects of broad-scale and continuing institutional change following the collapse of socialism is essential for designing effective land-use policies. Such insights can also provide information regarding how drastic changes in external framework conditions shape land use in others parts of the world.
Acknowledgments
We gratefully acknowledge support by the NASA Land-Cover and Land-Use Change Program, the Einstein Foundation in Berlin, the European Commission (VOLANTE, FP7-ENV-2010-265104), a University of Wisconsin-Madison International Travel Grant Award, the Earth and Space Foundation Award, and the R&D 'Scanex'. We also express our gratitude to I Plytyn who helped during the field visits. We thank A Sieber, C Alcantara and M Dubinin for technical assistance and constructive comments; N Keuler for statistical assistance and A Burnicki, D Lewis, M Ozdogan and P Townsend for their valuable comments on an earlier version of this manuscript. We would also like to thank S van der Linden, A Rabe and P Hostert for sharing the software package imageSVM. We thank three anonymous reviewers for their constructive comments that helped to improve this manuscript.