

Abstract
How the greening of Arctic landscapes manifests as a change in ecosystem structure and function remains largely unknown. This study investigates the likely implications of plant community change on ecosystem function in tundra near Barrow, Alaska. We use structural data from marked plots, established in 1972 and resampled in 1999, 2008 and 2010 to assess plant community change. Ecosystem functional studies were made close to peak growing season in 2008 and 2010 on destructive plots adjacent to marked plots and included measurement of land–atmosphere CH4 and CO2 exchange, hyperspectral reflectance, albedo, water table height, soil moisture, and plant species cover and abundance. Species cover and abundance data from marked and destructive plots were analyzed together using non-metric multi-dimensional scaling (NMS) ordination. NMS axis scores from destructive plots were used to krig ecosystem function variables in ordination space and produce surface plots from which time series of functional attributes for resampled plots were derived. Generally, the greatest functional change was found in aquatic and wet plant communities, where productivity varied and soil moisture increased, increasing methane efflux. Functional change was minimal in moist and dry communities, which experienced a general decrease in soil moisture availability and appeared overall to be functionally more stable through time. Findings suggest that the Barrow landscape could have become less productive and less responsive to change and disturbance over the past few decades. This study is a contribution to the International Polar Year-Back to the Future Project (512).
Export citation and abstract BibTeX RIS
1. Introduction
In the Arctic, shifts in ecosystem function have important implications for predicting the future state of the Arctic system and how these changes may affect the rest of the globe (McGuire et al 2006, 2010, Qian et al 2010). Perhaps most concerning is the future state and fate of the substantial Arctic soil organic carbon pool (Tarnocai et al 2009, Hollesen et al 2011). Relative to the size of this carbon pool, Arctic land masses are relatively small and have low productivity and standing biomass (Zimov et al 2006, Schuur et al 2008), suggesting that if there is a substantial loss of soil organic carbon, recovery of this carbon pool in the near future is unlikely. A reduction in carbon uptake capacity and/or a net loss of soil carbon to the atmosphere as CO2 or CH4 from Arctic landscapes has strong global consequences (Schuur et al 2009). Although time series of satellite-derived normalized difference vegetation indices (NDVI) suggest Arctic tundra landscapes have become 'greener' over the past three decades (Bhatt et al 2010), signifying increased carbon uptake potential, changes in ecosystem structure (e.g. plant species composition and abundance) and function (e.g. biogeochemical cycling) associated with these changes remain relatively poorly investigated over similar time frames.
To understand the future state of the Arctic and Earth systems, improved understanding of key terrestrial ecosystem processes over decade time scales are needed (Luo et al 2011). For Arctic terrestrial ecosystems, ecosystem structure appears to be strongly coupled to ecosystem functional processes. For example, several key studies highlight associations between plant functional types and species composition and nutrient cycling (Hobbie 1992, Hobbie et al 2002, Edwards and Jefferies 2010), surface albedo (Chapin et al 2005), net primary production (Webber 1978, Chapin et al 1995), and trace gas emissions of CO2 and CH4 (Joabsson and Christensen 2001, Strom and Christensen 2007). Based on first principles, these findings suggest that a shift in species composition will likely alter ecosystem function.
For the majority of the Arctic, assessing change in ecosystem structure and function over decade time scales is challenged by the absence of long-term monitoring. Several recent studies have demonstrated the benefits of resampling old research sites throughout the Arctic to assess change over time (see Callaghan et al 2011a). To date, few of these retrospective studies have coupled change detection of ecosystem structural and functional attributes over decade time scales.
This study is a companion paper to Villarreal et al (2012), which documents change in terrestrial plant community structure between 1972 and 2010 through repeated resampling of plots established during the International Biological Program (IBP) near Barrow, Alaska. In this study we link functional to structural change reported by Villarreal et al (2012), and solely focus on modeling functional changes in response to reported structural change. Our findings are based on the strict assumption that within ecosystems, (i) plant communities change because plant species that comprise these communities change in cover and abundance in response to a gamut of environmental conditions and/or due to succession (sensu Epstein et al 2004, Walker et al 2006, La Puma et al 2007, Hudson et al 2011), (ii) such community change can manifest to affect ecosystem function (sensu Johansson et al 2006, Oberbauer et al 2007), and (iii) that the relationship between ecosystem structure and function does not change over time when plant communities and environmental conditions do not change. This study is a contribution to the International Polar Year-Back to The Future (IPY-BTF) project, which aimed to determine the impacts of Arctic plant community change on ecosystem function over decadal time scales by revisiting and resampling historic research sites more than 25 yr in age (Callaghan et al 2011b).
2. Methodology
2.1. Site description
This study was conducted at the former IBP research site (71°17'N, 156°41'W) near Barrow, Alaska. Mean annual temperature, precipitation, and snowfall are −12 °C, 11 cm, and 69 cm respectively (1971–2000; NCDC http://cdo.ncdc.noaa.gov/climatenormals/clim20/state-pdf/ak.pdf). The landscape has a low relief best characterized as poorly drained polygonized tundra (Brown et al 1980). Maximum depth of thaw ranges from 30 to 40 cm (Nelson et al 1998, Hinkel and Nelson 2003) and the snow free period is variable in length but generally begins in early June and lasts until early September (Brown et al 1980).
The IBP (1967–74) produced some of the earliest quantitative descriptions of plant community assemblages in the North American Arctic. In 1971, 43 1 m × 10 m sites (here after referred to as 'historic sites') comprised of ten contiguous 1 m2 plots were established in a range of plant communities representative of the coastal tundra in the area. The sites, which are marked with wooden stakes, were first sampled in 1972 (Webber 1978, Webber et al 1980). Villarreal et al (2012) determined that these 43 IBP historic sites represent nine plant communities common in the Barrow landscape: aquatic Carex graminoid tundra (ACG), creek Arctophila graminoid tundra (CAG), pond Arctophila graminoid tundra (PAG), seasonally flooded graminoid tundra (FG), wet graminoid tundra (WG), moist graminoid tundra (MG), dry-moist dwarf shrub graminoid tundra (DMSG), dry dwarf shrub graminoid tundra (DSG), and successional-dry dwarf shrub graminoid tundra (SDSG). Historic data from the IBP were rescued in 1998 and 33 of the sites (330 1 m2 plots) were relocated and resampled in 1999, 2008 and 2010 using the same protocols for estimating species cover and abundance used in 1972. A detailed description of structural change from this resampling effort is described in Villarreal et al (2012).
2.2. Field sampling of functional attributes
To examine the relationship between plant community structure (species cover and abundance) and ecosystem function, we established 14 sites in close proximity to the historic sites that were resampled. Each site included three 50 cm × 50 cm plots (here after called 'functional plots', N = 42). Using a similar approach to other studies that have conducted short term plot level trace gas measurements (Shaver et al 2007, Lund et al 2009), aluminum chamber bases were inserted 5 cm into the soil and left for a minimum of 12 h to equilibrate. Species cover and abundance were estimated visually for all vascular and non-vascular plant species in each functional plot (bryophytes were lumped).
The following functional attributes of each plot were measured in early to mid August 2010 close to peak growing season (3 through 15 August 2010). Land-atmosphere CO2 fluxes were measured using a LI-COR 6200 Photosynthesis System (LI-COR Inc., Lincoln, NB, USA), and four different thicknesses of shade cloth from which ecosystem light response curves were generated (sensu Shaver et al 2007, Lasslop et al 2010). Calculations of net ecosystem CO2 production (NEP), ecosystem respiration (RE), and gross ecosystem photosynthesis (GEP) were made following Oberbauer et al (2007). Methane (CH4) flux was measured using a photo-acoustic multi-gas analyzer (INNOVA 1312 AirTech Instruments A/S, Denmark; sensu Lund et al 2009, Sachs et al 2010) and processed following (Lund et al 2009). To evaluate the combined greenhouse warming potential (GWP) of ecosystem CO2 and CH4 flux, we converted CH4 fluxes to CO2 equivalents assuming a 100 yr atmospheric residence time (GWP100 = 23 for CH4, Ramaswamy et al 2001). Hyperspectral reflectance was measured with a portable PP Systems Dual detector narrowband Unispec DC spectrometer (350–1150 nm) and used to calculate a normalized difference vegetation index (NDVI = (RIR − RVIS)/(RNIR + RVIS)) and water band index (WBI = R970/R900) (Penuelas et al 1993, Gamon et al 2006). Surface albedo (short-wave reflectance of the surface) was measured using a net radiometer (CNR 2 Kipp and Zonen, Inc.) by isolating incoming and outgoing short-wave radiation (310–2800 nm) and calculating the percentage of reflected radiation. Soil volumetric water content (VWC) was measured using a time domain reflectometer probe (TDR-300 spectrum technologies) at 10 cm depth. Depth of thaw was measured using protocols described by the circumpolar active layer monitoring program (CALM, Brown et al 2000). Water table height (WTH) was measured by drilling a hole to the depth of permafrost into which a 4 cm diameter PVC tube was placed and allowed to equilibrate with water table for 12 h, after which a ruler was used to determine the height of the water table relative to the depth of thaw (i.e. depth of inundated soil). Aboveground plant biomass was harvested during the period of maximum biomass using the same method applied by Webber (1978). Climate data were collected using a portable automatic weather station (Hobo AWS, Onset Computer, Bourne, Massachusetts, USA) setup near the historic plots for the duration of the field study. This measured air temperature (2 m), relative humidity (2 m), soil temperature (−1 cm), barometric pressure (1 m), soil moisture (−10 cm), photosynthetically active radiation (3 m), solar radiation (3 m), and wind speed/direction (3 m) at 1 min intervals.
2.3. Data analysis
To link the historic plots with the functional plots and assess how change in ecosystem structure has likely affected ecosystem function, we used a single non-metric multi-dimensional scaling (NMS) ordination (McCune and Grace 2002) and several geostatistical techniques. The NMS was run in PCOrd 5.10 (MjM Software Design, Gleneden Beach, OR, USA) set to 'slow and thorough' using Sørensen's similarity coefficient. Data included in the NMS were comprised of species cover from both historic (1972, 1999, 2008 and 2010; n = 1320) and functional plots (2010; n = 42; total n = 1362 plots and 82 species). To derive estimates of functional properties for the historic plots, NMS axis scores for the 42 functional plots were imported to ArcGIS 10 (ESRI, Redlands, CA, USA) as x–y coordinates (supplementary document 1, available at stacks.iop.org/ERL/7/015507/mmedia). For each functional attribute, surface maps were derived using the 'ordinary kriging' function in the Geostatistical Analyst extension of ArcGIS 10. The 1320 historic plots were then overlaid on the surface map derived for each functional attribute to extract a value for each plot, plant community, sampling year combination. Within the NMS, some historic plots fell outside the distribution of the functional plots in ordination space (supplementary document 1(C), available at stacks.iop.org/ERL/7/015507/mmedia) and were not included in further analysis. Although less than 3% of the 1320 historic plots were excluded, the community PAG, which comprised one site and ten plots, was omitted as a result. To assess the validity of the interpolative method, actual VWC, WBI and NDVI were collected independently on the historic IBP plots in 2010 and were compared to VWC, WBI and NDVI values predicted for the corresponding historic plots derived from the kriging models using Pearson's correlation. Data were transformed where necessary to meet the assumptions of normality (VWC—arcsine, WBI and NDVI—natural log).
To determine if the modeled functional attributes varied among plant communities and between sampling dates, we used a multivariate analysis of variance (MANOVA) for each functional attribute—plant community combination. Modeled values for the functional attributes of each plot were used as the response variable, plant community as the within subject factor, and sampling date as the among subject factor. Wilk's λ was used to determine if each functional attribute varied between sampling dates (time) and among plant communities at various sampling dates (time × community). When MANOVA results indicated a significant difference among plant communities, univariate ANOVA post hoc tests were used to explore the change between resampling dates within each plant community. MANOVA/ANOVAs were performed in JMP version 9 (SAS, Cary, NC, USA).
3. Results
3.1. Functional description of plant communities
The NMS ordination, using plant community data from the historic plots (Villarreal et al 2012) and functional plots, yielded a two-dimensional solution with a final stress and instability of 28.1 and 0.007 respectively after 500 iterations. The proportion of the variance explained by the ordination represented 68.8% of the cumulative variance with axis one and two representing 38.1% and 30.7% respectively. Within the NMS, the variability between sampling times for each plant community is similar to that reported by Villarreal et al (2012), suggesting the addition of the 42 destructive plots affected the ordination very little. Modeled aquatic and wet plant communities were the most functionally dynamic among sampling dates, followed by moist and dry communities which appeared to be more functionally stable and changed little within ordination space between resampling dates. Modeled and actual VWC had a linear relationship (supplementary document 2 y = 1.3362x − 0.2397, R2 = 0.69, p ≤ 0.0001, n = 285, available at stacks.iop.org/ERL/7/015507/mmedia), although the modeled values slightly under predicted estimates for dry plots and slightly over predicted VWC for wet plots. Correlations between modeled and measured WBI and NDVI were weaker but linear (supplementary document 2; y = 0.7853x + 0.0233, R2 = 0.39, p ≤ 0.0001, n = 80; y = 1.0201x + 0.0428, R2 = 0.31, p ≤ 0.0001, n = 80 respectively, available at stacks.iop.org/ERL/7/015507/mmedia) and modeled values slightly over predicted estimates for both attributes. Although modeled attributes differed from one-to-one relationships, results indicate that derived surface maps were effective at approximating measured functional attributes.
From the surface maps of functional attributes in ordination space (figure 1), aquatic CAG had the highest VWC and WTH of all plant communities. CAG had the lowest albedo of all plant communities while GEP, RE, NDVI and CH4 emissions were highest. The aquatic–wet community ACG was functionally similar to CAG, although ACG had slightly lower values for all functional attributes except albedo, which was approximately the same. Wet–moist communities, FG and WG, function similarly to each other; however, FG had a higher NDVI, WBI, albedo and WTH relative to WG. Moist–dry communities MG and DMSG overlapped considerably in ordination space and has similar functional characteristics (figure 1). DSG was the driest of all plant communities containing a relatively high albedo while GEP, RE, and CH4 were low. The modeling approach suggested that dry communities DSG and SDSG functioned markedly similarly; therefore for simplicity and clarity these communities were combined.
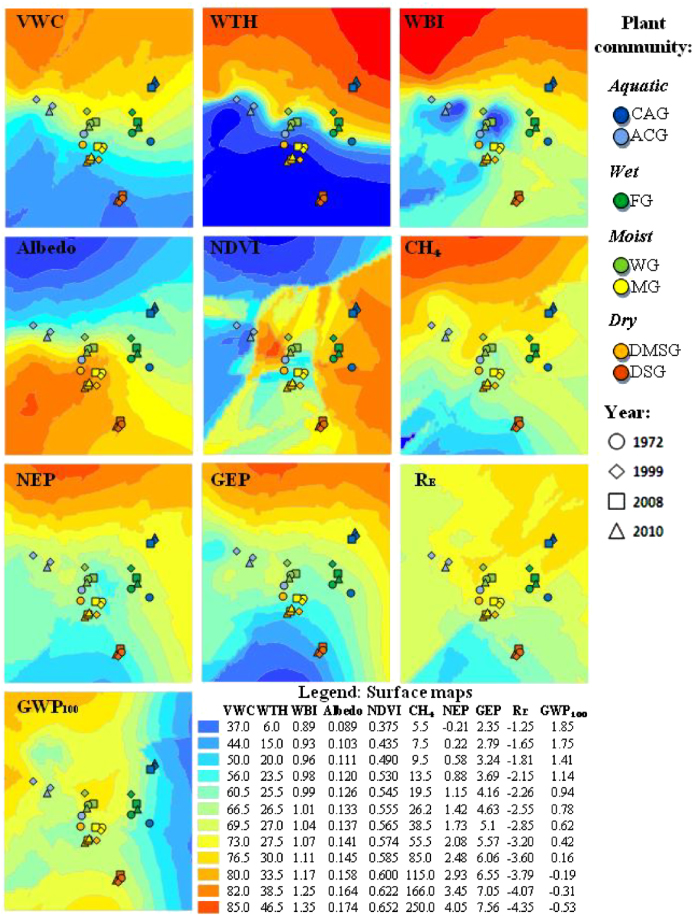
Figure 1. Surface maps of functional attributes (VWC, WTH, WBI, Albedo, NDVI, CH4, NEP, GEP, RE and GWP100) overlaid by mean plot NMS axis scores for each plant community. Surface maps were created by kriging values for attributes derived for functional plots within NMS ordination space.
Download figure:
Standard image3.2. Estimation of ecosystem functional change
We found significant time and time-community effects for all ten MANOVAs (supplementary document 3, available at stacks.iop.org/ERL/7/015507/mmedia), indicating that at least one plant community in each model varied significantly among historic sampling dates for a given functional attribute (supplementary document 3, available at stacks.iop.org/ERL/7/015507/mmedia). Significance tests using Tukey's HSD (table 1) found ACG, CAG, and WG changed the most between sampling times ( ≥ 19 significant changes; table 1), whereas FG, MG, DMSG and DSG changed the least ( ≤ 5 significant changes; table 1).
Table 1. Change in functional attributes for each plant community and sampling period derived from Tukey's HSD tests. Arrows indicate a significant increase/decrease (P ≤ 0.05). 'Total' refers to the count of all significant changes for a given time interval/plant community.
| Aqua | Aqua–wet | Wet | Wet–mst | Mst | Mst–dry | Dry | |||
|---|---|---|---|---|---|---|---|---|---|
| Attribute | Time | CAG | ACG | FG | WG | MG | DMSG | DSG | Total |
| NEP | 2008–2010 | — | ↓ | —– | ↓ | — | — | — | 2 |
| 1999–2008 | — | — | — | ↑ | — | — | — | 1 | |
| 1999–2010 | — | — | — | — | — | — | — | 0 | |
| 1972–1999 | ↑ | — | — | — | — | — | — | 1 | |
| 1972–2008 | ↑ | ↑ | ↑ | ↑ | — | — | — | 4 | |
| 1972–2010 | ↑ | — | — | — | — | — | — | 1 | |
| GEP | 2008–2010 | — | — | — | — | — | — | — | 0 |
| 1999–2008 | — | — | — | — | — | — | — | 0 | |
| 1999–2010 | — | — | — | — | — | — | — | 0 | |
| 1972–1999 | ↑ | — | — | — | — | ↓ | — | 2 | |
| 1972–2008 | ↑ | — | ↑ | — | — | — | — | 2 | |
| 1972–2010 | ↑ | ↓ | — | — | — | ↓ | — | 3 | |
| CH4 | 2008–2010 | — | ↓ | — | ↓ | — | — | — | 2 |
| 1999–2008 | — | ↑ | — | ↑ | — | — | — | 2 | |
| 1999–2010 | — | — | — | — | — | — | — | 0 | |
| 1972–1999 | ↑ | ↑ | — | — | — | — | — | 2 | |
| 1972–2008 | ↑ | ↑ | — | ↑ | — | — | — | 3 | |
| 1972–2010 | ↑ | ↑ | — | — | — | — | — | 2 | |
| RE | 2008–2010 | — | — | — | — | ↓ | — | — | 1 |
| 1999–2008 | — | — | — | — | — | — | — | 0 | |
| 1999–2010 | — | — | — | — | ↓ | — | — | 1 | |
| 1972–1999 | — | — | — | — | — | ↓ | — | 1 | |
| 1972–2008 | ↑ | ↓ | — | ↓ | — | ↓ | — | 4 | |
| 1972–2010 | ↑ | ↓ | — | — | ↓ | ↓ | — | 4 | |
| GWP100 | 2008–2010 | — | — | — | — | — | — | — | 0 |
| 1999–2008 | — | — | — | ↑ | — | — | — | 1 | |
| 1999–2010 | — | — | — | — | — | — | — | 0 | |
| 1972–1999 | — | ↓ | — | — | — | — | — | 1 | |
| 1972–2008 | — | ↓ | — | — | — | — | — | 1 | |
| 1972–2010 | — | ↓ | — | — | — | — | — | 1 | |
| Albedo | 2008–2010 | — | ↑ | — | ↑ | — | — | — | 2 |
| 1999–2008 | — | — | — | ↓ | — | — | — | 1 | |
| 1999–2010 | — | — | — | — | — | — | — | 0 | |
| 1972–1999 | ↓ | ↓ | — | — | — | — | — | 2 | |
| 1972–2008 | — | ↓ | — | ↓ | — | — | — | 2 | |
| 1972–2010 | — | ↓ | — | — | — | — | — | 1 | |
| WBI | 2008–2010 | — | ↓ | — | ↓ | — | — | — | 2 |
| 1999–2008 | — | — | — | ↑ | — | — | — | 1 | |
| 1999–2010 | — | — | — | — | — | — | — | 0 | |
| 1972–1999 | ↑ | ↑ | — | — | — | — | — | 2 | |
| 1972–2008 | ↑ | ↑ | — | ↑ | — | — | — | 3 | |
| 1972–2010 | ↑ | — | — | — | — | — | — | 1 | |
| VWC | 2008–2010 | — | — | — | ↓ | — | — | — | 1 |
| 1999–2008 | — | — | — | — | — | — | — | 0 | |
| 1999–2010 | — | — | — | — | — | — | — | 0 | |
| 1972–1999 | — | ↑ | — | — | — | — | — | 1 | |
| 1972–2008 | ↑ | ↑ | — | — | — | — | — | 2 | |
| 1972–2010 | ↑ | ↑ | — | — | ↓ | — | — | 3 | |
| WTH | 2008–2010 | — | — | — | ↓ | — | — | — | 1 |
| 1999–2008 | — | — | — | — | — | — | — | 0 | |
| 1999–2010 | — | — | — | — | — | — | — | 0 | |
| 1972–1999 | ↑ | ↑ | — | — | — | — | — | 2 | |
| 1972–2008 | ↑ | ↑ | ↑ | — | — | — | — | 3 | |
| 1972–2010 | ↑ | ↑ | — | — | — | — | — | 2 | |
| NDVI | 2008–2010 | — | ↑ | ↑ | ↑ | — | — | — | 3 |
| 1999–2008 | — | ↓ | — | ↓ | — | — | — | 2 | |
| 1999–2010 | — | — | — | — | — | — | — | 0 | |
| 1972–1999 | ↓ | ↓ | — | — | — | — | — | 2 | |
| 1972–2008 | ↓ | ↓ | — | ↓ | — | — | — | 3 | |
| 1972–2010 | ↓ | ↓ | — | — | — | — | — | 2 | |
| Total | 2008–2010 | 0 | 5 | 1 | 7 | 1 | 0 | 0 | 14 |
| 1999–2008 | 0 | 2 | 0 | 6 | 0 | 0 | 0 | 8 | |
| 1999–2010 | 0 | 0 | 0 | 0 | 1 | 0 | 0 | 1 | |
| 1972–1999 | 7 | 7 | 0 | 0 | 0 | 2 | 0 | 16 | |
| 1972–2008 | 8 | 9 | 3 | 6 | 0 | 1 | 0 | 27 | |
| 1972–2010 | 8 | 8 | 0 | 0 | 2 | 2 | 0 | 20 | |
| Total | 23 | 31 | 4 | 19 | 4 | 5 | 0 | 86 |
Estimated soil volumetric water content (VWC) was greater in 2010 for aquatic–wet plant communities CAG and ACG than in 1972, while we found the opposite pattern to be true for MG (figure 2(a); table 1). Wet–moist communities FG and WG had considerable inter-sampling variation in VWC between sampling times but no long-term trend. There was no change in the VWC of dry communities DMSG and DSG. Trends for WTH and WBI followed similar patterns reported for VWC (figures 2(b) and (c); table 1). Plant communities with high VWC and WTH had the lowest albedo (figure 2(d); table 1). NDVI was lower in wet–moist communities CAG, ACG and WG in 2008 than in 1972, while drier communities MG, DMSG and DSG, did not vary among sampling times (figure 2(e); table 1).

Figure 2. Mean values of each functional attribute, sampling year, and plant community. A = VWC%, B = WTH cm, C = WBI index, D = Albedo%, E = NDVI index, F = CH4 mg cm−2 day−1, G = NEP g cm−2 day−1, H = GEP g cm−2 day−1, I = RE g cm−2 day−1, J = GWP100 equivalents of g cm−2 day−1. NEP positive GWP100 values indicate decreased warming potential.
Download figure:
Standard imageMethane (CH4) efflux and NEP was greater in 2008 than 1972 for aquatic–wet communities CAG, ACG and WG, while moist–dry communities MG, DMSG and DSG showed no change (figures 2(f) and (g); table 1). We found GEP in 2010 to be higher for the wet community CAG than in 1972, however the opposite trend was found for ACG and DMSG. No change in GEP was found for WG, MG and DSG (figure 2(h); table 1). Ecosystem respiration (RE) remained relatively constant among sampling dates but was slightly lower in 2010 than 1972 in ACG, MG and DMSG (figure 2(i); table 1). Global warming potential (GWP100) indicated decreased forcing potential for WG in 2008 compared to 1999 but there was no overall trend spanning the study period (1972–2010, figure 2(j); table 1). Forcing potential of ACG was higher in 2010 than in 1972 due to decreased GEP, increased CH4 efflux, and relatively high RE. No other trends in GWP100 were detected.
Peak season biomass of communities PAG, FG, WG and MG in 1972 and 2010 are reported in supplementary document 4 (available at stacks.iop.org/ERL/7/015507/mmedia). Biomass data for pond Arctophila graminoid tundra (PAG) and creek Arctophila graminoid tundra (CAG) were pooled in 2010 to improve inter-comparison with Webber (1978) (table S4, available at stacks.iop.org/ERL/7/015507/mmedia). Total vascular plant biomass increased in communities CAG (+96 g m−2; 81%) and MG (+44 g m−2; 70%) and showed little change in FG and WG. Biomass of non-vascular plants generally remained similar for the communities sampled. The biomass of graminoids in aquatic communities CAG increased markedly (+131 g m−2; 166%), as did the biomass of mosses (+33 g m−2; 182%), while that of forbs decreased (−35 g m−2; 88%) (supplementary document 4, available at stacks.iop.org/ERL/7/015507/mmedia).
4. Discussion
In this study we sought to infer decade time scale change in ecosystem function for plant communities that dominate coastal tundra near Barrow, Alaska. Our analytical approach was based on the strict assumption that within ecosystems (i) plant communities change because plant species comprising these communities change in cover and abundance in response to altered environmental conditions and/or due to succession (sensu Epstein et al 2004, Walker et al 2006, La Puma et al 2007, Hudson et al 2011), (ii) such community change can manifest to affect ecosystem function (sensu Hooper et al 2005), and (iii) that the relationship between ecosystem structure and function does not change over time when plant communities and environmental conditions do not change. Independent validation of our approach showed imperfect but adequate results for reconstructing historic ecosystem functional attributes suitable for the development of testable hypotheses of future change, assuming future change trajectories follow the same course as hindcast trends. Other studies using similar assumptions to examine time series trends in ecosystem structure and function include Johansson et al (2006) who examined the impact of land cover change on ecosystem function near the Stordalen Mire in subarctic Sweden to assess change in global warming potential over time, and Swann et al (2009), who assessed the potential radiative forcing change due to large vegetation shifts in northern latitude ecosystems.
The ranges of functional attributes modeled in this study are generally within range of that documented by other studies in the area (Webber 1978, Oberbauer et al 2007, Olivas et al 2010, Von Fischer et al 2010, Goswami et al 2011). The most dramatic changes were observed in wet and especially the aquatic plant community types (Villarreal et al 2012). These changes are likely to have important implications for ecosystem function as these land cover types comprise approximately 24% of the tundra landscape near Barrow (Tweedie et al 2012) and, relative to dry and some moist land cover types, are important for surface hydrology and energy balance (Engstrom et al 2005, Liljedahl et al 2011), soil thermal properties (Shiklomanov et al 2010), and trace gas flux—especially methane efflux (Mastepanov et al 2008, Zona et al 2009, Von Fischer et al 2010). Based on the relationship between plant community composition and ecosystem function, our study suggests that the soils of these communities have generally become wetter, WTH has increased, albedo and NDVI have decreased, and CH4 efflux and NEP (driven mostly by GEP) have increased. Overall, however, there appears to have been little change in GWP, except for ACG, which has declined. For most functional attributes modeled for moist and dry plant community types, there has been either little or slight change in an opposite direction to that modeled for the wet and aquatic communities, suggesting the plant communities sampled have become functionally dissimilar over time.
Increases in biomass for communities CAG and MG are similar to trends reported elsewhere in the Arctic over decade time scales (Hudson and Henry 2009, Hill and Henry 2011), in experimental manipulations such as warming experiments (Hollister and Flaherty 2010), as well as to those projected from ecosystem models (Epstein et al 2000, Euskirchen et al 2009). Although these trends match decadal time scale satellite-derived increases in NDVI documented for the region (Bhatt et al 2010, Jia et al 2003), they do not always match the trends in NDVI estimated specifically for Barrow. While we cannot adequately explain this trend for some communities, the decrease in NDVI modeled for aquatic plant communities makes sense considering the modeled increase in WTH, which can result in the absorption of light in the infra red, thereby causing a reduction in NDVI (Goswami 2011). The latter example highlights the challenge of acquiring sensible NDVI measurements for tundra landscapes where WTH fluctuates above and below the ground surface, thereby leading to a potential misinterpretation of a shift in NDVI when the primary change may not be vegetation, but WTH.
Attributing change to specific drivers of change is difficult in non-experimental studies where the impacts from a gamut of drivers (e.g. climate and hydrologic change, succession) prevail (Luo et al 2011). Most of our documented changes match other long-term observations made in the Arctic (Bhatt et al 2010), as well as those results from both experimental manipulations (Goswami et al 2011, Hill and Henry 2011) and ecosystem models (Shaver et al 2007); with the largest changes observed for most functional attributes among 1999, 2008 and 2010. The most obvious explanation for these modeled dynamics is the occurrence of a lemming population outbreak that spanned 2007–8 (Villarreal et al 2012). In many instances, there was a greater degree of change over this decadal period than between 1972 and 1999 or 1972 and 2010, highlighting the important role lemmings can play in mediating plant community dynamics and ecosystem function in tundra landscapes (Johnson et al 2011). Lemmings unequally use habitats depending on seasonal flooding (Batzli 1980), which may explain the different magnitudes of potential impact between plant community types between 2008 and other sampling years.
This study demonstrates that (i) different plant communities within a tundra landscape have changed at different rates over decadal time scales—aquatic and wet communities changed more than moist and dry communities, (ii) drivers of change are uncertain, however long-term environmental changes and herbivore grazing may largely influence plant community structure and ecosystem function, and (iii) changes in plant community composition appear to have altered ecosystem function. This paper demonstrates a novel technique for assessing the functional implications of plant community change and the successful implementation of decade time scale changes in plant community function. We found the most functionally dynamic plant communities, with respect to change within ordination space within kriged functional maps, between resampling dates to be aquatic and wet plant communities followed by moist and dry communities which appeared to be more stable and less responsive to change over time. Assessment of the broader scale magnitude and functional implications of plant community change and herbivory in the study area requires further analysis that incorporates land cover change and the scaling of ecosystem functional attributes to the landscape level. Recently, Lin et al (2012), using multi-temporal classification of aerial and satellite imagery, have suggested that a tundra landscape a few kilometers from this study site has dried over the past 60 yr with the extent of dry and moist tundra increasing and that of wet tundra decreasing over time. These results, along with ours, suggests that the Barrow landscape could have become less productive and less responsive to change and disturbance over the past few decades. Future modeling efforts that incorporate land cover change scenarios, short term and potentially cyclical impacts like lemming outbreaks, and ecosystem functional attributes are required to establish scenarios of future ecosystem states that can serve as hypotheses testable with sustained monitoring.
Acknowledgments
This project was funded through support from the National Science Foundation, Office of Polar Programs (grant no. ANS-0732885). Lara is partly supported through a NSF GK-12 student scholarship. We are appreciative of help from David Lin in data processing and field sampling, Ryan Cody for support with geospatial analysis, and Paulo Olivas and Steve Oberbauer for their advice regarding measurement of trace gas fluxes. Additionally, we are grateful to the Ukpeagvik Iñupiat Corporation (UIC) for permitting/land access and the Barrow Arctic Science Consortium for logistical support. Any opinions, findings, conclusions, or recommendations expressed in this material are those of the authors and do not necessarily reflect the views of the National Science Foundation.