

Abstract
The feedbacks between climate, atmospheric CO2 concentration and the terrestrial carbon cycle are a major source of uncertainty in future climate projections with Earth systems models. Here, we use observation-based estimates of the interannual variations in evapotranspiration (ET), net biome productivity (NBP), as well as the present-day sensitivity of NBP to climate variations, to constrain globally the terrestrial carbon cycle feedbacks as simulated by models that participated in the fifth phase of the coupled model intercomparison project (CMIP5). The constraints result in a ca. 40% lower response of NBP to climate change and a ca. 30% reduction in the strength of the CO2 fertilization effect relative to the unconstrained multi-model mean. While the unconstrained CMIP5 models suggest an increase in the cumulative terrestrial carbon storage (477 PgC) in response to an idealized scenario of 1%/year atmospheric CO2 increase, the constraints imply a ca. 19% smaller change. Overall, the applied emerging constraint approach offers a possibility to reduce uncertainties in the projections of the terrestrial carbon cycle, which is a key determinant of the future trajectory of atmospheric CO2 concentration and resulting climate change.
Export citation and abstract BibTeX RIS

Original content from this work may be used under the terms of the Creative Commons Attribution 3.0 licence. Any further distribution of this work must maintain attribution to the author(s) and the title of the work, journal citation and DOI.
1. Introduction
The anthropogenic CO2 emissions from the burning of fossil fuels and land use changes combined with emissions of other non-CO2 greenhouse gases and aerosols are not only the primary driver for climate change, but have set in motion global-scale perturbations of the biogeochemical cycles on land and in the ocean (Ciais et al 2013). Terrestrial ecosystems currently mitigate the anthropogenic perturbation of the carbon cycle by absorbing about a third of the anthropogenic CO2 emissions (Pan et al 2011, Sitch et al 2015, Le Quéré et al 2016), but it is unclear whether this enormous ecosystem service will continue unabated into the future, since both changes in atmospheric composition and climate impact substantially the land carbon uptake and storage (Lashof 1989, Friedlingstein et al 2006, Ciais et al 2013).
The response of the terrestrial carbon cycle to changes in atmospheric CO2 concentration and temperature, known as the concentration-carbon (β) and climate-carbon (γ) feedbacks, respectively, is a major determinant of the future climate change (Cox et al 2000, Jones et al 2003, Friedlingstein et al 2006, Friedlingstein and Prentice 2010, Booth et al 2012). However, the estimates of these feedbacks based on recent Earth system models (ESMs), i.e., models that include comprehensive representations of the biogeochemical processes on land and in the ocean, show a large range in their strength (Friedlingstein et al 2006, Boer and Arora 2012, Arora et al 2013). Moreover, uncertainties in these feedbacks have the potential to trigger uncertainties in many other features of the simulated earth system in ESMs (Friedlingstein et al 2014).
Statistical relationships between observable short-term (interannual) and long-term (decadal) variations of different aspects of the Earth system might provide emergent constraints on ESM projections under the condition that there is a theoretical understanding of the identified relationship (Knutti 2010). These may include constraints on precipitation (Allen and Ingram 2002) and temperature (Gillett et al 2013, Stegehuis et al 2013, Schmidt et al 2014), as well as constraints on the snow-albedo feedback, (Hall and Qu 2006, Hall et al 2008, Qu and Hall 2014), cloud feedbacks (Klein and Hall 2015), climate sensitivity (Knutti et al 2006, Sherwood et al 2014) and sea ice (Massonnet et al 2012).
This study attempts to provide constraints on both γ and β for land based on recent ESMs. For γ, we use a multiple constraint approach making use of a range of data products which adds confidence to the constrained feedbacks since a good agreement only with respect to one metric does not necessarily guarantee good performance with respect to other metrics and/or other aspects and variables of the Earth system (Knutti 2010, Mahowald et al 2016). In contrast to recent studies, which have constrained more specific aspects of the land carbon cycle such as γ in the tropics (Cox et al 2013, Wenzel et al 2014), atmospheric CO2 mole fraction (Hoffman et al 2014), cumulative carbon sequestration (Zaehle et al 2014, Wieder et al 2015), gross primary productivity (GPP) (Mystakidis et al 2016, Wenzel et al 2016), Leaf Area Index (Mahowald et al 2016), we present constraints both on γ and β at the global scale. Constraining the two feedbacks simultaneously is important since their balance ultimately determines the long-term behavior of the terrestrial carbon sink. Thus, our approach enables to ultimately quantify the consequences of these constraints on future changes in the land carbon storage.
2. Data and methodology
2.1. Datasets
2.1.1. CMIP5 models
The basis of our analyzes are gridded estimates of GPP, net biome productivity (NBP), temperature (tas), precipitation (pr) and evapotranspiration (ET) (hfls) from 8 ESMs (table 1) that submitted results in the framework of the CMIP5 project (Taylor et al 2012). These ESMs differ widely in terms of resolution, complexity and variations of the component models and many other aspects. Most relevant in the context of this study is their differences in the handling of the terrestrial nitrogen cycle, as this has been shown to have large implications for their sensitivity to changing atmospheric CO2 concentration and climate (Thornton et al 2009, Goll et al 2012, Wania et al 2012, Smith et al 2014). Namely, only two of the studied models, i.e., CESM1-BGC and NorESM1-ME (which share the same terrestrial carbon cycle component; CLM4.0), include an interactive nitrogen cycle, i.e., they consider the nitrogen content of the soils as a factor limiting growth.
Table 1. CMIP5 models used in this study.
| Model name | Land surface model | Resolution | Reference |
|---|---|---|---|
| CanESM2 | CLASS2.7+CTEM1 | 2.8125° ⨯ 2.8125° | Arora et al (2011) |
| CESM1-BGC | CLM4.0 | 0.9° ⨯ 1.25° | Long et al (2013) |
| GFDL-ESM2M | LM3 | 2.5° ⨯ 2° | Dunne et al (2012, 2013) |
| HadGEM2-ES | JULES+TRIFFID | 1.875° ⨯ 1.25° | Collins et al (2011) |
| Jones et al (2011) | |||
| IPSL-CM5A-LR | ORCIDEE | 3.75° ⨯ 1.875° | Dufresne et al (2013) |
| MIROC-ESM | MATSIRO+SEIB-DGVM | 2.8125° ⨯ 2.8125° | Watanabe et al (2011) |
| MPI-ESM-LR | JSBACH+BETHY | 1.875° ⨯ 1.875° | Raddatz et al (2007) |
| Brovkin et al (2009) | |||
| Maier-Reimer and Wetzel (2005) | |||
| NorESM1-ME | CLM4.0 | 2.5° ⨯ 1.9° | Iversen et al (2013) |
We used output from the historical concentration-driven experiments, in which atmospheric CO2 concentrations were prescribed as an input to the different ESMs. We also used output from idealized 140 year long simulations where the atmospheric CO2 concentration was prescribed as an input to the models, increasing at a rate of 1%/yr, starting from its preindustrial value (ca. 285 ppm) until quadrupling by the end year of the simulations (year 140). The 1%/yr increase in atmospheric CO2 simulations we employed in this study include: (a) 'biogeochemically' coupled experiments (esmFixClim1) that neglect the radiative forcing effect of CO2 and are therefore considered to be uncoupled with respect to climate change (radiative forcing remained preindustrial) and (b) fully coupled experiments (1pctCO2) that include both the effect of increasing CO2 and climate change on the terrestrial biosphere and the associated feedbacks. Thus, in the first (esmFixClim1) experiment just the concentration-carbon feedback is considered, while in the second (1pctCO2) experiment, both feedbacks are active, i.e., concentration- and climate-carbon feedbacks.
2.1.2. Reference products for ET, NBP, precipitation and temperature
As reference dataset for ET we use the newly compiled LandFlux-Eval synthesis product that include in a merged manner 14 different individual gridded ET datasets (observation-based, satellite products and model estimates of ET) over the period 1989–2005 with a spatial resolution of 1.0° (Mueller et al 2013). The interquartile range (IQR) of the different ET datasets contained in the LandFlux-Eval synthesis product was taken as a measure of the likely range in ET.
For NBP, we use the estimates from the global carbon project (GCP; Le Quéré et al (2016)) where the net land carbon uptake was estimated as the residual of the different components of the anthropogenic carbon budget. By definition, this residual-based estimate of annual NBP is only available at the global scale (http://cdiac.ornl.gov/GCP/). Further, it is subject to large uncertainties since it accumulates the uncertainties in the different components of the carbon budget that are propagated to the estimate of the land sink (Li et al 2016). To take this into consideration, we employed additional reference datasets for NBP, based on results from atmospheric CO2 inversions performed within the framework of the Transcom3 inter-comparison effort (Gurney et al 2002, 2003, 2004, Baker et al 2006). Specifically, we used output from the JENA (Rödenbeck 2005), JMA (Maki et al 2010), LSCEa (Piao et al 2009), NICAM (Niwa et al 2012) and RIGC (Patra et al 2005) products. Atmospheric CO2 inversions offer a method to estimate sources and sinks of carbon (Ciais et al 2010) since atmospheric CO2 concentrations reflect the CO2 sources and sinks in natural ecosystems. Albeit they differ in spatial coverage and base periods, these model products (Gurney et al 2004, Gurney and Eckels 2011) agree well regarding the sign and the magnitude of NBP with observational products based on forest inventories (Pan et al 2011) or estimates of the land sink based on carbon isotopes (e.g. 13C/12C ratio; Ciais et al (1995)). Moreover, these observation-based inversion products are totally independent of the ESMs used in the CMIP5 models and they provide robust interannual variations for NBP at large scales (Peylin et al 2013).
We employed a total of 6 precipitation datasets to constrain the models, using datasets that are either based exclusively on rain gauge observations or based on combinations between rain gauge observations and satellite-derived estimates. These precipitation products include the CPC (Xie and Arkin 1997), CRU (Harris et al 2014), GPCC (Rudolf and Schneider 2005), GPCP (Adler et al 2003), PREC/L (Chen et al 2002) and University of Delaware (Legates and Willmott 1990) datasets. As reference datasets for temperature we use the products from CRU (Harris et al 2014), ERA-Interim (Dee et al 2011) and the University of Delaware (Willmott and Robeson 1995).
All datasets (CMIP5 models and observation-based products except for the GCP estimate) were interpolated bi-linearly to a common grid with a resolution of 0.5° × 0.5°. When integrating NBP and GPP over different regions, we also accounted for the land fraction in each grid cell.
2.2. Methods
2.2.1. Carbon cycle feedbacks
We calculated the carbon cycle feedbacks in the CMIP5 models following the methodology introduced by Wenzel et al (2014), which differs little from that used in the Coupled Climate Carbon Cycle Model Intercomparison project (C4MIP; Friedlingstein et al (2006)). Based on this approach, the 'biogeochemically' coupled ('uncoupled') simulations were used to compute the concentration-carbon feedback, which can be translated into a model's CO2 fertilization effect. In these simulations, the change in the land carbon storage ( ) is proportional to the change in atmospheric CO2 concentration in these experiments (
 ) multiplied by the concentration-carbon feedback (β):

The climate-carbon feedback was estimated from the fully coupled (1pctCO2) experiments. Since the change in atmospheric CO2 concentration is indistinguishable in the biogeochemically coupled and fully coupled experiments, the change in the land carbon storage in the fully coupled simulations ( ) equals the change in atmospheric CO2 concentration in these simulations (
 ) multiplied by the concentration-carbon feedback (β) plus the temperature change (
 ) in the coupled experiment multiplied by the climate-carbon feedback (γ):

In all models except one, the two feedbacks were calculated during the period between the year 1 and year 140 of the idealized simulations. In the case of GFDL-ESM2M the feedbacks were calculated for a different time window, since the model hold the atmospheric CO2 concentration after the year of doubling (year 70) constant. Therefore, we calculated the feedbacks for this model for the period between the year 28 (atmospheric CO2 concentration corresponds to 2000 levels in the historical experiments) and the year 70 (atmospheric CO2 concentration corresponds to 2045 levels based on the representative concentration pathway (RCP) 8.5 experiment; van Vuuren et al (2011)).
2.2.2. Response of NBP to climate variations
The response of NBP to interannual variations in temperature and precipitation was derived empirically based on a multiple regression approach as in Piao et al (2013). Based on this approach, NBP can be derived as a linear combination of anomalies in temperature and precipitation:

where  and δ are the partial regression coefficients that represent the responses of NBP to temperature (PgC yr–1 K–1) and precipitation (PgC yr–1 mm–1), respectively. The symbols xT and xPR are the detrended anomalies in annual temperature and precipitation, respectively, and
  is the error term. We calculated the observation-based responses of NBP to temperature and precipitation (
 and δ) based on a total of 108 different combinations of the reference products (6 for NBP x 6 for precipitation x 3 for temperature) for the 1989–2005 period and using the 'regmultlin' function in NCL (https://ncl.ucar.edu/Document/Functions/Built-in/reg_multlin.shtml).
2.2.3. Observational constraints approach
We constrain the full ensemble of CMIP5 models (prior ensemble) based on the emergent relationships we establish in the result section (figure 1) and using several observation-based products as constraints. The constraints are applied globally based on the annual means for the period 1989–2005, which is determined by the availability of the observation-based products. The 'constrained' ensemble is constructed by removing models not lying within the uncertainty range of the observation-based constraints. Since we applied several constraints, we decided to exclude only models that are outside the range of all constraints (i.e., a model can be retained even if it complies with only one constraint).
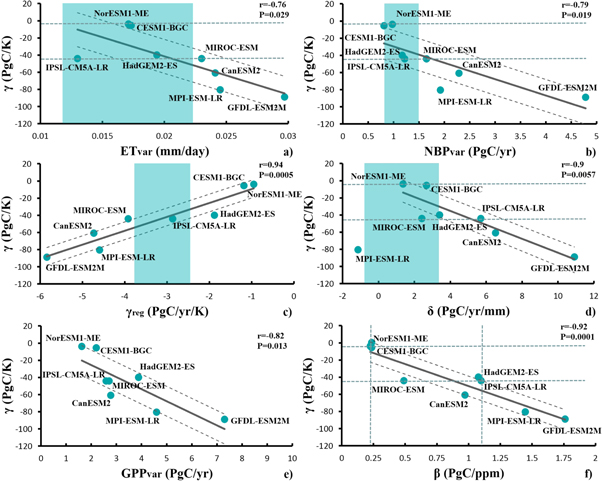
Figure 1. Inter-model correlation between (a) γ and the interannual variability in ET, (b) γ and the interannual variability in NBP, (c) γ and γreg, (d) γ and δ, (e) γ and the interannual variability in GPP and (f) γ and β. The relationships from (a) to (d) are used as a basis for constraining γ. Shaded areas correspond to the range of the reference products for the period 1989–2005. Dashed lines around the regression lines correspond to the uncertainty of the linear regression. Dashed horizontal lines correspond to the range for γ (and β, shown in (f)) that is consistent with the different observed-based constraints.
Download figure:
Standard image High-resolution imageThe climate-carbon feedback is constrained based on global contemporary variations in ET (ETvarcon) and NBP (NBPvarcon), as well as the response of NBP to variations in temperature ( con) and precipitation (δcon). A summary of the various constraints employed for γ is shown in table 2. A common characteristic in all these approaches is that the observed interannual variability of the terrestrial carbon fluxes can be used to constrain the long-term response of these fluxes, implying that the same processes operate at these different time scales. In the case of ET, the uncertainty range is defined based on the IQR of the different ET datasets contained in the LandFlux-Eval ET product. In the case of NBP and its responses to interannual variations in temperature (γ) and precipitation (δ), the uncertainty range is defined based on the full range of the various observation-based estimates.
Table 2. Summary of the various constraint approaches used for the climate-carbon feedback (γ).
| Ensemble | Rationale | Reference products | Definition of the uncertainty range |
|---|---|---|---|
| ETvarcon | ET is a proxy for GPP. | LandFlux-Eval synthesis | IQR of the different ET datasets |
| Interannual variations in GPP are | dataset (Mueller et al 2013) | contained in the LandFlux-Eval | |
| a response to climate variations | synthesis product | ||
| (figures S5, S6) and drive the variations | |||
| in the carbon sink (figure 2(b), S3) | |||
| NBPvarcon | Interannual variations in NBP | NBP from the Global Carbon | Full range of the different reference |
| (correlated with GPP variations; | Project and 5 atmospheric CO2 | products for NBP | |
| figures 2(b), S3) are a response to | inversion products | (5 inversions and GCP estimate) | |
| climate variations | |||
δcon and  con con |
The interannual variations in NBP | NBP from the Global Carbon | Full range of the 108 combinations |
| are related to variations in climate | Project and 5 atmospheric CO2 | between the various | |
| (e.g. temperature and precipitation; | inversion products, 6 precipitation | observation-based products | |
| figures S7, S8). The sensitivity of NBP | datasets and 3 temperature datasets | ||
| to temperature and precipitation | |||
| variations is related to γ |
In the absence of direct observational constraints, the concentration-carbon feedback is constrained based on the strong inter-model relationship we identify between the two feedbacks in the CMIP5 models (figure 1(f)).
3. Results
3.1. Emergent relationships
We find in the CMIP5 models a statistically significant inter-model correlation between the global climate-land carbon feedback strength (γ) and the magnitude of the interannual variations in global ET (r = −0.76, P = 0.029; figure 1(a)), NBP (r = −0.79, P = 0.019; figure 1(b)), GPP (r = −0.82, P = 0.013; figure 1(e)) and the response of NBP to variations in temperature (r = 0.94, P = 0.0005; figure 1(c)) and precipitation (r = −0.9, P = 0.0057; figure 1(d)) over the period 1989–2005. These different relationships can be used as a basis for constraining γ. While these correlations do not automatically imply a causal mechanism, we argue, in line with previous studies (Cox et al 2013, Wenzel et al 2014), that they emerge because the short-term (interannual) and the long-term (decadal to centennial) sensitivities of the terrestrial carbon fluxes to climate are highly linked.
More specifically, interannual variations in GPP, ET and NBP are essentially driven by variations in climate (figure S5,S6), as also shown in previous observational and modeling studies (Tian et al 1998, Luyssaert et al 2007, Reichstein et al 2007, Ciais et al 2009, Weber et al 2009, Friedlingstein et al 2010, Le Maire et al 2010, Jung et al 2011, Poulter et al 2014, Ahlström et al 2015, Anav et al 2015). The short-term (e.g. ET, NBP, GPP interannual variations) and the long-term (γ) sensitivities are correlated in the models (figures 1(a)–(e)) presumably because simulated GPP, ET and NBP respond to climate variations in a similar way whether these variations occur from year to year or over longer time scales. In other words, models that are particularly sensitive to interannual climate variations (i.e., larger anomalies in ET, GPP and NBP-also highly correlated each other, figures S1–S4) will also tend to have a higher sensitivity to future warming (higher γ).
GPP variations are strongly correlated with ET variations, in the CMIP5 models, both at the regional (figures 2(a), S2) and the global scale (r = 0.77, P = 0.025; figure S1(a)), reflecting the well-established coupling between plant photosynthesis and transpiration. As a consequence, the year-to-year variations in ET during the historical period are also highly correlated with γ. However, current observation-based products for global GPP do not offer robust estimates for the interannual variability (Anav et al 2015), preventing the emergent relationship between γ and the interannual variations in GPP to be used as a constraint at this time. But, the high relationship between GPP and ET variations offers the opportunity to use observation-based estimates of interannual ET variations as a proxy for interannual GPP variations and thus as a constraint on γ.

Figure 2. Inter-model correlation between: (a) interannual variations in GPP and ET and (b) interannual variations in GPP and NBP for the historical period (1989–2005). Stippling is applied over regions where the correlation coefficient is statistically significant (5% significance level).
Download figure:
Standard image High-resolution imageIn order to better understand the strong inter-model relationships between γ and the response of NBP to interannual variations in temperature ( ) and precipitation(δ) (figures 1(c), (d)), we further investigate the link between ecosystems and climate variations, which are related to the climate-carbon feedback, by analyzing in both models and observations the relationship between contemporary interannual anomalies in NBP and in the potential drivers temperature (
 ) and precipitation (δ), respectively. The analysis focuses on temperature and precipitation since these two climate variables are known to be key determinants of the productivity of ecosystems (Nemani et al 2003, Poulter et al 2014, Ahlström et al 2015, Anav et al 2015, Murray-Tortarolo et al 2016, Seddon et al 2016).
During the period 1989–2005, the different combinations between the observation-based products for NBP, temperature and precipitation agree on a negative response of NBP to variations in temperature ( ) ranging from about −3.8 to −2.5 PgC yr–1 K–1. In the case of precipiation (δ), the results range between −0.8 and 3.4 PgC yr–1 mm–1 with most of the combinations showing a positive response of NBP to interannual variations in precipitation. The negative relationship between NBP and temperature translates into a lower terrestrial carbon sink during warm years, caused either by increased respiration in response to warmer temperatures (Kätterer et al 1998, Davidson and Janssens 2006, Bond-Lamberty and Thomson 2010, Conant et al 2011, Lu et al 2013) and/or by lower photosynthesis in regions where plants operate close to their optimal temperature. The positive relationship between NBP and precipitation suggests that wet years are favorable for plant productivity, resulting in enhanced terrestrial carbon uptake. This mechanism is valid in several ecosystems in the mid-latitudes and in the tropics. In particular, in tropical ecosystems the relationship between NBP and precipitation (as well as temperature) anomalies is more pronounced during ENSO events (Jones and Cox 2001, Gurney et al 2003). Warm and dry conditions during these events cause substantial reductions in plant production and enhance respiration resulting in lower storage on land in tropical land ecosystems (Gatti et al 2014) and in a stronger climate-carbon feedback that relates to interannual variations in climate. Eventually, these anomalies in the carbon sink are mirrored in the atmospheric CO2 growth rate.
Consistent with the observation-based products, the CMIP5 models show negative and positive responses of NBP to interannual variations in temperature and precipitation, respectively, both globally (figures 1(c), (d), S9, S10) and regionally (figure S7,S8). However, they simulate a large spread in the strength of these relationships, with most of the models tending to be oversensitive to interannual variations in precipitation (figure 1(d)) compared to the reference products (as already shown in Piao et al (2013) for the global averages in the offline TRENDY simulations). The relationship between γ and the responses of NBP to variations in temperature and precipitation are strong and statistically significant also for a longer time period in the observation record where fewer reference data products are available (e.g., 1985–2009, see figures S1(c), (d)). We note here that the high soil moisture-dependence of soil respiration in MPI-ESM-LR (Wenzel et al 2014) decouples the relationship between NBP and precipitation (negative) in this model mainly owing to enhanced decomposition in wet years, which overwhelms the possible enhancement of plant productivity in response to higher soil water availability. For this reason, we have excluded MPI-ESM-LR when calculating the best fit linear regression between γ and δ (figure 1(d)).
These 'responses' of NBP to climate variations need to be interpreted carefully since the multi-linear regression approach does not take into account the effect of synergistic/antagonistic effects between the two drivers and also neglects other confounding mechanisms and drivers of plant productivity. Thus, this method for calculating  and δ might describe reasonably well the response of NBP to temperature and precipitation in the models, since most of them lack many other processes that influence the carbon cycle, while it might not always work for the observation-based products. Indeed, this seems to be the case in the models since there is a strong and significant correlation between γ and the response of NBP to interannual variations in temperature (
 figure 1(c)). Thus, the assumption that the same processes control γ in the short-term and long-term scales is valid at least in the model world.
3.2. Constrained climate-carbon feedback
The magnitude of the climate-carbon feedback varies markedly across the CMIP5 models (table 3), as already shown earlier (Arora et al 2013, Ciais et al 2013). Several reasons might explain this large range including, for instance, biases in the underlying simulated climate or the diverse and sometimes inadequate representation of land biogeochemical and biophysical processes in the different ESMs (Plattner et al 2008, Hawkins and Sutton 2009, Anav et al 2013, Piao et al 2013, Hoffman et al 2014, Friedlingstein 2015). All models simulate a negative γ ranging from about −3.7 (NorESM1-ME) to −89PgC/K (GFDL-ESM2M) with a multi-model mean of −45.9 and a model range of 85 PgC K–1, respectively. The low sensitivity in CESM1-BGC (also seen in NorESM1-ME) was attributed earlier to increased nitrogen mineralization, caused by increased respiration that provides additional nitrogen inputs to vegetation and compensates as a result, the carbon losses through the process of respiration (Arora et al 2013)—an effect not considered in the other carbon-only ESMs. The simulated magnitude of the climate-carbon feedback in the CMIP5 models lies within the range of the C4MIP models (Friedlingstein et al 2006). The different observation-based constraints suggest a substantially lower response of the terrestrial carbon cycle to climate change (γ) and a significant decrease in the inter-model range. Specifically, the magnitude of the climate-carbon feedback for the constrained multi-model mean is lowered by 40% (figure 3), from −45.9 to −27.4 PgC K–1, while the observational constraints half the inter-model spread from 85 to 40 PgC K–1. Another indication that γ might be overestimated in the CMIP5 models relates to the tendency of some models to simulate high total carbon in vegetation and soils (Todd-Brown et al 2012, Anav et al 2013, Carvalhais et al 2014) and thus high amounts of carbon, contained in these pools, are exposed to the warming.

Figure 3. Prior and constrained terrestrial carbon cycle feedbacks (γ; top and β; middle) and change in the cumulative land carbon storage (ΔNBP; bottom) in the 140 year 1% CO2 increase per year scenario. Dots represent the results from the different models and colored bars the multi-model means. Patterned dots represent models that include an explicit terrestrial nitrogen cycle (CESM1-BGC and NorESM1-ME). For all models except one, the feedbacks where calculated between the year 1 and the year 140 of the idealized experiments. For GFDL-ESM2M the feedbacks were calculated between the year 28 and the year 70.
Download figure:
Standard image High-resolution image
Table 3.
Global γ and β over land based on the idealized 1% CO2 per year experiments, change in the cumulative land carbon storage based on the RCP8.5 (Δ NBPRCP8.5;PgC; calculated between the year 2005 and 2100) and 1pctCO2 (Δ NBP1pctCO2;PgC) experiments and changes in the turnover time (yr) of vegetation (Δ τveg), soil (Δτsoil) and total ( ) carbon content in the 1pctCO2 experiment. The changes in the tunrover times are defined as the difference between the last and the first 20 years of the 1pctCO2 experiment.
| Model name | γ | β | ΔNBPRCP8.5 | ΔNBP1pctCO2 | Δτveg | Δ τsoil | Δ τ |
|---|---|---|---|---|---|---|---|
| CanESM2 | −61 | 0.97 | 102 | 492 | 0.5 | −7.3 | −2.6 |
| CESM1-BGC | −5.4 | 0.24 | −100 | 177 | −0.4 | −2.2 | −1.5 |
| GFDL-ESM2M | −89 | 1.76 | 195 | 570 | −0.3 | −4.7 | −2.6 |
| HadGEM2-ES | −40 | 1.08 | 332 | 711 | −0.9 | −5.2 | −3.3 |
| IPSL-CM5A-LR | −44 | 1.1 | 311 | 718 | 0.4 | −5.1 | −2.1 |
| MIROC-ESM | −44 | 0.49 | −82 | 152 | −0.7 | −8.0 | −4.8 |
| MPI-ESM-LR | −80 | 1.44 | 257 | 818 | −0.2 | −13.7 | −6.7 |
| NorESM1-ME | −3.7 | 0.23 | −195 | 177 | −0.4 | −4.6 | −1.5 |
3.3. Constrained concentration-carbon feedback
We find a statistically highly significant negative correlation between γ and β in the ESMs (r = −0.92, P = 0.0001; figure 1(f)) with models having a more negative γ having a more positive β. This strong relationship is likely the consequence of a pool effect. In other words, models with a higher β, i.e., stronger fertilization effect, tend to accumulate more carbon in vegetation and soils, thereby increasing the risk of carbon losses due to climate change. Keeping in mind that this relationship is a model-derived feature not directly verifiable based on observations, we examined the consequences of the constrained γ on β. All CMIP5 models simulate a positive β, but with substantial inter-model variation, ranging from about 0.24 PgC ppm–1 for CESM1-BGC and NorESM1-ME to about 1.76 PgC ppm–1 for GFDL-ESM2M, resulting in a multi-model mean of 0.91 PgC ppm–1. The much lowest response to CO2 in CESM1-BGC and NorESM1-ME originates likely from the strong limitation that nitrogen imposes on the strength of CO2 fertilization compared to carbon-only models (Thornton et al 2009, Zaehle et al 2010). In the case of the MIROC-ESM model, the relatively low response to CO2 (0.49 PgC ppm–1) can be attributed to the empirical treatment of photosynthesis in its land surface module, implicitly including the role of nutrient limitations on CO2 fertilization (Ito and Oikawa 2002, Arora et al 2013). Selecting only the models complying with the observation-based constraints described in the previous section, results in a substantially lower estimate of γ. Specifically, the constraint reduces the concentration-carbon feedback by 30% from 0.9 PgC ppm–1 to 0.6 PgC ppm–1 (figure 3) and also reduces the range by 40% (0.2–1.1 PgC ppm–1).
3.4. Resulting future land carbon uptake
By the end of the fully coupled experiments corresponding to a quadrupling of the preindustrial atmospheric CO2 concentration, all models simulate a high cumulative carbon sink in the terrestrial biosphere (table 3, figure S11(b)), ranging from 152PgC (MIROC-ESM) to 818 PgC (MPI-ESM-LR). The change in the annual net land-atmosphere flux, calculated as the difference in NBP between the last and the first 20 years of the simulation, also shows a large range, with all but two models (GFDL-ESM2M and MIROC-ESM) simulating an increased sink by the end of the simulation (figure S11(d)). In those models that simulate an increase in NBP, this change is driven by the increase in GPP, that more than compensates the increased losses stemming from the faster turnover time of total carbon in soils and vegetations (table 3). The latter is mainly driven by faster soil decomposition and to a lesser extent by faster autotrophic respiration rates in response to the warming (table 3). The decrease in NBP in GFDL-ESM2M and MIROC-ESM is due to the faster turnover time of soil carbon, that more than compensates the increase in GPP. For GFDL-ESM2M, this is a consequence of the model's setup since, as mentioned earlier, the forcing in this model stabilized at the year of CO2 doubling. Hence, GPP in GFDL-ESM2M stays constant in these experiments after this moment, allowing respiration to regulate NBP and reduce the sink strength in this model.
Obviously, the constrained feedbacks have an impact on the future change in the land carbon storage, since their balance determines NBP (see equation (2)). The observation-based constraints suggest a multi-model mean NBP that is about 19% lower (figure 3) and they reduce the inter-model range of the change in the land carbon storage by about 15% to a range of 151–718 PgC. In the constrained models, the lower CO2 fertilization effect still more than compensates the lower response to climate change, resulting in a lower terrestrial carbon uptake. These results concerning the magnitude of the future changes in NBP are not easy to extrapolate to other scenarios, since the numbers are likely quite sensitive to the specific emission/concentration scenario applied. However, the lower sink in the constrained ensembles can be related to results from other scenarios (e.g., RCP8.5 experiment) since models simulating large changes in NBP in the idealized 1%/yr increase in CO2 experiments simulate also large changes in future NBP in the RCP8.5 simulations (table 3, r = 0.96, P = 0.0012). By the end of the RCP8.5 experiment, the models simulate, on average, a cumulative change in NBP of 102 PgC (table 3) while for the same experiment the constrained models have a storage on land that is about 50% lower (53 PgC).
4. Conclusions
This study provides revised estimates of the global feedbacks involving the terrestrial carbon cycle, the atmospheric CO2 concentration and climate change as simulated by comprehensive ESMs used in the framework of CMIP5. Compared to the prior ensemble, the models constrained by several observation-based products have a ca. 40% lower sensitivity to climate change (climate-carbon feedback) and a ca. 30% lower sensitivity to CO2 (concentration-carbon feedback). Combining the two constrained feedbacks reduces the cumulative terrestrial NBP by about 19% in the mean, and reduces the model range by 17% in the 1% CO2 increase per year scenario.
The results for γ are consistent with findings from recent studies showing that the suite of models used in recent model intercomparison projects (e.g. C4MIP and CMIP5) tends to be overly sensitive to climate (see Cox et al (2013), Wenzel et al (2014) for the tropics). The identified lower response to CO2 in the constrained models is in line with the tendency of current models to likely overestimate CO2 fertilization (Hungate et al 2003, Piao et al 2013, Kolby Smith et al 2015). Moreover, the identified lower capacity of ecosystems to store carbon is consistent with results from recent studies providing nutrient availability constraints on CMIP5 model projections (Zaehle et al 2014, Wieder et al 2015), as well as with spatially and temporally explicit ET and GPP constraints on the historical and RCP8.5 CMIP5 terrestrial carbon cycle simulations (Mystakidis et al 2016).
The added value of this study can be summarized in three points. First, the findings give insights on the magnitude of the constrained feedbacks at the global scale, which leads to a better understanding of the future changes in the Earth system. Second, this study presents constraints on both β and γ using the high correlation between the two feedbacks in the CMIP5 models. The latter finding suggests that models with high atmospheric CO2 fertilization effect on NBP also have higher sensitivity of NBP to climate change, suggesting that the competition between the two feedbacks ultimately determines the land carbon storage. Third, the use of several data products as observation-based constraints adds more confidence to the constrained quantities. Encouragingly, all the different emergent constraints used in this study show consistent results and suggest that the constrained feedbacks involving the terrestrial carbon cycle and the climate system are at the low end of the ESMs range.
It is important to consider a few caveats. The most critical one relates to the identified emergent relationships and specifically to the fact that these relationships cannot be evaluated based on observations. This caveat is valid for all emergent constraints proposed in the literature. Moreover, the observational constraint approach cannot be expected to compensate for uncertainties due to processes that are either missing or underrepresented in current ESMs (Friedlingstein 2015). Some of them may include nutrient limitations on ecosystems (Norby et al 2010, Zaehle et al 2010, Fernández-Martínez et al 2014), permafrost-carbon feedbacks (Koven et al 2011, 2015, Schuur et al 2015), several disturbance processes especially, land use change (Brovkin et al 1999, 2004, 2013, Houghton et al 2012), and soil moisture stress and associated mortality (Allen et al 2015) that is not well represented in current terrestrial biogeochemistry models, at least not for tropical ecosystems (Wang et al 2014). In general, the emergent constraints work since in current ESMs the same processes appear to drive the short-term variability and the long-term sensitivity to climate change. Whether this holds true in reality is presently unknown.
Another limitation relates to uncertainties in the simulated fluxes at the regional scale. For instance, a model might show the right performance in simulating a global quantity in the historical period, but this might be a result of compensating regional biases (Jiang et al 2015, Mystakidis et al 2016). Thus, a model that matches the contemporary variations in the water and carbon fluxes at the global scale well does not automatically imply that the model correctly simulates the interannual variations in these fluxes at the regional scale. Similarly, a model might capture the correct response of NBP to interannual variations in temperature ( ) and precipitation (δ) due to a compensation between the response of photosynthesis and respiration to climate. The lack of robust observation-based global estimates of the interannual variations in photosynthesis and respiration make it difficult to address the latter caveat at this time. The development of more spatially explicit observation-based products for the terrestrial water and carbon fluxes would certainly help to address these two caveats and most importantly to better understand the mechanisms controlling the terrestrial carbon cycle.
Finally, after recognizing the above-mentioned caveats we conclude that the results of this study can provide guidance to model development and help in producing more reliable future projections of several other aspects of the Earth system.
Acknowledgments
This study was funded by the Swiss National Science Foundation (SNSF) as part of the CarboCount-CH project (grant CRSII2 136273). Moreover, we acknowledge funding by the EU project 283080 (GEO-CARBON (NG)), funded by the European Commisions 7th Framework Programme, by the Horizon 2020 European Unions Framework Programme for Research and Innovation under Grant Agreement No. 641816, (CRESCENDO (ED, SIS)), and by the ERC Consolidator Grant DROUGHT-HEAT project (SIS). We would like to thank the numerous data providers, especially Takashi Maki, Philippe Peylin, Yosuke Niwa, Christian Roedenbeck and Prabir Patra for providing the JMA, LSCE, NICAM, JENA and RIGC atmospheric CO2 inversion products, respectively. The NBP estimate based on the Global Carbon Project is available at http://cdiac.ornl.gov/GCP/. The LandFlux-Eval ET product can be download from: http://iac.ethz.ch/group/land-climate-dynamics/research/landflux-eval.html. The CPC, GPCC, GPCP and PREC/L precipitation products are available at: http://esrl.noaa.gov/psd/data/gridded/tables/precipitation.html. The CRU dataset can be downloaded from: http://cru.uea.ac.uk/data.
The University of Delaware dataset is available at: http://esrl.noaa.gov/psd/data/gridded/data.UDelAirTPrecip.html. The ERA-Interim dataset can be found at: http://esrl.noaa.gov/psd/data/gridded/data.erainterim.html
We also would like to thank Philippe Peylin and Pierre Friedlingstein for providing constructive comments on the manuscript, as well as Philippe Ciais for constructive discussions. Finally, we thank Urs Beyerle for support with downloading and storage of CMIP5 data.