

Abstract
Distinct biases are found in the pattern and teleconnections of the Arctic Oscillation (AO) in 32 climate models that participate the Coupled Model Intercomparison Project Phase 5 (CMIP5). Compared with observations, the Pacific (Atlantic) center of AO is excessively strong (weak) in most of the 32 CMIP5 models, and the AO-related surface air temperature anomalies are generally weak over the Eurasian continent and North America. These biases are closely tied to the excessively strong linkage, which is marginal in observations, between AO and the North Pacific mode (NPM)—the leading variability of the North Pacific sea level pressure. It implies that the AO in CMIP5 models may be compounded with some regional mode over the North Pacific. Accordingly, a bias-correction method was proposed via correcting the AO index (AOI) to improve the diagnostic estimates of the AO teleconnections. The results suggest that the biases in the pattern and teleconnections of AO can be significantly reduced when the NPM variability is linearly removed from the AOI.
Export citation and abstract BibTeX RIS

Original content from this work may be used under the terms of the Creative Commons Attribution 3.0 licence. Any further distribution of this work must maintain attribution to the author(s) and the title of the work, journal citation and DOI.
1. Introduction
The Arctic Oscillation (AO, also known as the northern annular mode), defined by the leading empirical orthogonal function (EOF) mode of the sea level pressure (SLP) over the extratropical Northern Hemisphere, reveals the approximately zonally symmetric seesaw of the atmospheric mass between the Arctic and the midlatitudes (Thompson and Wallace 1998). The mass redistributions associated with different phases of AO can change the meridional gradient of the atmospheric pressure and influence the Northern Hemispheric climate significantly (Thompson and Wallace 2001). For example, the positive (negative) phase of AO in boreal winter features negative (positive) SLP anomalies over the Arctic region and positive (negative) ones over the midlatitude North Atlantic and North Pacific, and it could induce large-scale warming (cooling) over the midlatitudes, especially over the Eurasian continent and North America (e.g., Thompson and Wallace 1998, 2001, Wang and Chen 2010, Chen et al 2013b).
In addition to its influences on the regional climate, the AO has significant implications for the climate change in the Northern Hemisphere (Thompson et al 2000). It is important to reproduce the pattern and related climate anomalies of AO in climate models realistically because the climate model is an essential tool to understand and project the future climate change. Unfortunately, the AO pattern in many climate models shows clear biases compared with that in observations. One notable bias is that the magnitude of the Pacific center of AO pattern is weaker than that of the Atlantic center in observations (Thompson and Wallace 1998), whereas it is exaggerated and stronger than the Atlantic one in climate models (Miller et al 2006, Stoner et al 2009, Cattiaux and Cassou 2013, Zuo et al 2013), but the causes of this bias are unclear. In this study, we revisit the bias in the pattern and teleconnections of AO in 32 Coupled Model Intercomparison Project Phase 5 (CMIP5) models and discuss the possible responsible factors. A method to correct the bias is also suggested.
2. Data and methods
The outputs of the historical experiments spanning the period from January 1960 to December 2005 are employed from the following 39 CMIP5 models: ACCESS1.0, ACCESS1.3, BCC-CSM1.1, BCC-CSM1.1(M), BNU-ESM, CanCM4, CanESM2, CCSM4, CESM1-BGC, CESM1-CAM5, CESM1-FASTCHEM, CESM1-WACCM, CMCC-CM, CNRM-CM5, CSIRO-Mk3.6.0, FGOALS-g2, GFDL-CM2.1, GFDL-CM3, GFDL-ESM2G, GFDL-ESM2M, GISS-E2-H, GISS-E2-R, HadCM3, HadGEM2-AO, HadGEM2-CC, HadGEM2-ES, INM-CM4, IPSL-CM5A-LR, IPSL-CM5A-MR, IPSL-CM5B-LR, MIROC4h, MIROC5, MIROC-ESM, MIROC-ESM-CHEM, MPI-ESM-LR, MPI-ESM-MR, MPI-ESM-P, MRI-CGCM3, NorESM1-M. Since there are a different number of available ensemble members for each individual model, and since these members are generally tightly clustered relative to intermodel spread, we consider only one member from each CMIP5 model in order to give equal weighting across models. In order to compare the model results with those obtained from reanalysis data, all the model data were interpolated onto 2.5° × 2.5° longitude–latitude grids before analyses. The observational proxies of the atmospheric variables are from the monthly mean data of the European Centre for Medium-Range Weather Forecasts Re-Analysis (ERA) dataset, including ERA-40 and ERA-interim (Uppala et al 2005, Dee et al 2011). The ERA-interim dataset was used to extend the ERA-40 dataset from September 2002 to December 2005. Forty-five winters spanning from 1961 to 2005 are considered in this study, where the winter 1961 refers to the 1960/61 winter. Winter means are considered in this study and they are constructed from the monthly means by averaging the data of December, January and February.
Following Thompson and Wallace (1998), the winter mean AO pattern is defined as the first EOF of the winter mean SLP over the Northern Hemisphere poleward of 20°N (referred to as Northern Hemisphere hereafter), and the AO index (AOI) is defined as the corresponding first principal component (PC). The regression coefficients of a climatic variable onto the normalized AOI are defined as the AO's teleconnection pattern. The multimodel ensemble (MME) was calculated by averaging the variables over all the models with equal weighting, and the MME of a regression pattern was calculated as the equally-weighting average of all model's corresponding patterns. Following Gong et al (2014, 2015), the averaged t value among each of model was used to evaluate the confidence level of the MME pattern based on a two-tailed Student's t test.
3. Results
3.1. Biases in the spatial pattern and teleconnections of AO
Figure 1(a) shows the spatial pattern of the wintertime AO in ERA dataset, which explains 31.7% of the total variance. In the positive phase of AO, strong negative SLP anomalies are observed over the Arctic, and strong positive SLP anomalies are located over the midlatitude Atlantic (figure 1(a)). Although positive SLP anomalies are present over the North Pacific, their magnitude is much weaker than that over the Atlantic. These features, which are also present in NCEP dataset (not shown), are consistent with previous studies (e.g. Thompson and Wallace 1998, 2001). The spatial correlation of AO's SLP patterns between ERA and NCEP dataset is 0.99 over the Northern Hemisphere, suggesting the robustness of the AO pattern in ERA and NCEP datasets. Therefore, the results obtained in ERA dataset are referred to as 'observations' in the following sections.

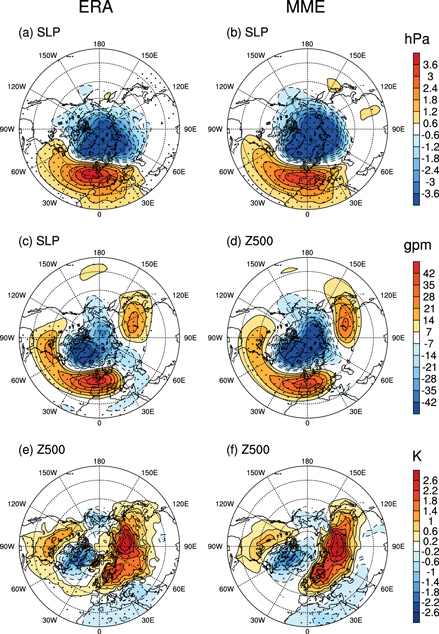
Figure 1. The winter mean SLP regressed on the normalized AO index in (a) ERA dataset and (b) MME for the period 1961–2005. (c) The difference between (b) and (a). (d)–(f) and (g)–(i) are the same as (a)–(c), but for Z500 and SAT, respectively. Shading intervals are 0.6 hPa in (a)–(c), 7 gpm in (d)–(f), and 0.4 K in (g)–(i). Dots indicates the 95% confidence level based on a two-sided Student's t test.
Download figure:
Standard image High-resolution imageIn MME, the variance explained by AO is 32.4%, similar to that (31.7%) in observations, but the pattern of AO exhibits large differences. The Pacific (Atlantic) center of AO in the SLP filed is much stronger (weaker) in MME than in observations (figures 1(a)–(c)), and this feature can be seen in most of the individual models (not shown). Similar biases are also found in the 500 hPa geopotential height (Z500) (figures 1(d)–(f)), implying the quasi-barotropic characteristics of the AO's structure and its biases. The biases of AO pattern are expected to influence the related surface air temperature (SAT) anomalies. In observations, positive AO corresponds to significant warming over the southeastern North America and northern Eurasia continent and cooling over the northeastern North America and northern Africa (figure 1(g)). In MME, by contrast, the magnitudes of SAT anomalies are much weaker throughout the Northern Hemisphere except over small regions to the south and southeast of Lake Baikal (figures 1(h) and (i)). Moreover, the warm anomalies over northwestern North America were incorrectly represented as cold anomalies in MME due to the exaggerated Pacific center of AO (figures 1(g) and (h)). Again, these biases exist in almost all the individual models (not shown). These results suggest that the CMIP5 models tend to simulate an excessively strong (weak) Pacific (Atlantic) center of AO and thereby biased teleconnections of AO. With these biases, the skill and reliability of future climate projections made by the CMIP5 models may be limited.
3.2. Possible causes of the biases
With a weak Pacific center and a strong Atlantic center, the observed AO pattern (figure 1(a)) resembles the North Atlantic Oscillation (NAO). Defining the NAO as the first EOF mode of SLP over the North Atlantic (20°N–90°N, 9°W–40°E) and the NAO index as the corresponding PC (Hurrell et al 2003), the temporal correlation coefficient between indices of AO and NAO is 0.94 for the period 1961–2005 (figure 2(a)), and the spatial correlation coefficient between the regressed SLP patterns of AO and NAO over the Northern Hemisphere is 0.98 (figure 2(b)). It suggests that the wintertime AO and NAO are somewhat difficult to distinguish in observations, consistent with previous studies (e.g. Rogers and McHugh 2002, Feldstein and Franzke 2006). In CMIP5 models, the temporal (spatial) correlation coefficient between AO and NAO is 0.83 (0.95) in MME, and it exceeds 0.55 (0.6) in all the 39 CMIP5 models (all exceeding 99.9% confidence level). It suggests that the observed similarities between AO and NAO can be generally captured by the CMIP5 models. Nevertheless, the AO seems to bear more resemblance to the North Pacific dominant mode (NPM, see the definition in section 3) rather than the NAO in some of CMIP5 models (e.g., those below the diagonals in figures 2(a) and (b)). The temporal (spatial) correlation coefficient between the AO and NAO is slightly weaker than those between the AO and NPM in these models (figures 2(a) and (b)). However, these models are not essentially different from the others, but rather may be seen as extreme cases, in which the Pacific variability is so large that it dominates. Moreover, the NAO-like pattern, with the seesaw between the Arctic and North Atlantic actually also exists in these models, although the strength is weaker than that in North Pacific section. Therefore, these models are also employed in this study. In fact, the results reported in this study remain almost the same if the models below the diagonals of figures 2(a) and (b) are removed from the analyses (not shown).

Figure 2. (a) Scatterplot of the temporal correlation coefficients between AO and NAO versus the temporal correlation coefficients between AO and NPM in 39 CMIP5 models, MME, and observations. (b) is the same as (a), but based on the corresponding spatial correlation coefficients. (c) Scatterplot of the normalized NPCI versus the normalized rAO–NPM in 39 CMIP5 models, MME, and observations. The intermodel correlation coefficient (r) between x-and y-axis variables is also shown. (d) Intermodel regression of AO-related SLP anomalies onto the normalized rAO–NPM among 39 CMIP5 models. Shading intervals are 0.4 hPa and dots indicates the 99% confidence level based on a two-sided Student's t test in (d).
Download figure:
Standard image High-resolution imageThe bias pattern of AO-related SLP in CMIP5 models (figure 1(c)) quite resembles the observed second EOF of SLP over the Northern Hemisphere (figure 3, also see lower left panel of figure 4 in Wallace and Thompson 2002), which mainly represents the leading SLP variability over the North Pacific (Wallace and Thompson 2002, Rodionov et al 2005, Zhou et al 2012). Defining the wintertime North Pacific dominant mode (NPM) as the first EOF of SLP over the North Pacific (20°N–65°N, 120°E–120°W) and the NPM index (NPMI) as the corresponding PC, the observed correlation coefficient between AO and NPM indices (rAO–NPM) is only 0.16 (figure 2(a)). However, 34 out of 39 CMIP5 models simulate stronger rAO–NPM that is higher than 0.3, exceeding the 95% confidence level. This result indicates that the linkage between AO and NPM is overestimated by the CMIP5 models, which may be the cause of the biased AO pattern.

Figure 3. The EOF2 of the wintertime SLP over the Northern Hemisphere (north of 20°N) in ERA dataset. The pattern was obtained by regressing the winter mean SLP onto the normalized PC2 for the period 1961–2005. Shading intervals are 0.6 hPa and dots indicate the 95% confidence level based on a two-sided Student's t test.
Download figure:
Standard image High-resolution image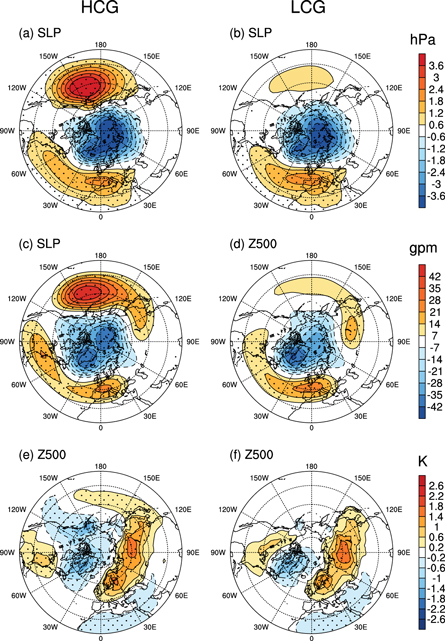
Figure 4. The winter mean SLP regressed onto the normalized AO index in (a) HCG and (b) LCG. (c), (d) and (e), (f) are the same as (a), (b), but for Z500 and SAT, respectively. Shading intervals are 0.6 hPa in (a), (b), 7 gpm in (c), (d), and 0.4 K in (e), (f). Dots indicate the 95% confidence level based on a two-sided Student's t test.
Download figure:
Standard image High-resolution imageTo validate the possible influence of the AO–NPM linkage on the intensity of the Pacific center of AO pattern, the North Pacific center index (NPCI) is defined as the area-averaged AO-related SLP anomalies (i.e., the regressed SLP anomalies onto the AOI) over the North Pacific (25°N–60°N, 150°E–120°W) to represent the intensity of the Pacific center of AO pattern. Figure 2(c) shows the scatter diagram of intermodel variability between the NPCI (y-axis) and rAO–NPM (x-axis) based on the 39 CMIP5 models, MME, and observations. The highly linear clustered dots suggest that a high and positive rAO–NPM tends to correspond to a strong Pacific center of the AO pattern both in models and observations. This inference is further supported by the high intermodel correlation coefficient between the x and y variables in 39 models, which reaches 0.91 and exceeds the 99.9% confidence level. In addition, the intermodel regression pattern, that is, the intermodel AO patterns are regressed onto the normalized intermodel rAO–NPM, was calculated. It is clearly that a Pacific high-pressure center resembling the biased AO pattern (figure 1(c)) emerges in the regression pattern (figure 2(d)). This result further confirms that a high and positive rAO–NPM is corresponding to a stronger Pacific center of the AO pattern among CMIP5 models. All these results suggest that the excessively strong Pacific center of AO in CMIP5 models is a mutual result of the excessively strong positive rAO–NPM.
To further support the above argument, the 39 CMIP5 models were divided into high correlation groups (HCG) in which rAO–NPM is higher than 0.45 and the low correlation groups (LCG) otherwise3 . Based on this criterion, 27 (12) models were classified to the HCG (LCG). In the HCG, the Pacific center of AO is stronger than the Atlantic center (figure 4(a)), and the patterns and teleconnections of AO (figures 4(a), (c) and (e)) are very similar to the MME of all 39 models (figures 1(b), (e) and (h)). In the LCG, by contrast, the Pacific center of AO is weaker than the Atlantic center (figure 4(b)), and the patterns and teleconnections of AO (figures 4(b), (d) and (f)) are quite similar to observations (figures 1(a), (d) and (g)) although the intensity of Atlantic center is still weaker than that in observations (figures 1(a) and 4(b)). This result confirms our argument that the patterns and teleconnections of AO are more reasonable if the AO–NPM linkage is weak in CMIP5 models.
In addition, the variances explained by AO (EOF1 of Northern Hemispheric SLP) were calculated in LCG and HCG, respectively. It reveals that AO explains 27.7% (34. 5%) of the total variance in LCG (HCG), which is lower (higher) than that in observations (i.e., 31.7%). Meanwhile, the EOF2 of Northern Hemispheric SLP explains 17.1% (15.7%) of the total variance in LCG (HCG). There results indicate a relatively high variance explained by EOF1 and low variance explained by EOF2 in HCG, and an opposite case in LCG. Therefore, it is inferred that the higher variance explained by AO in HCG than in LCG is because some of the NPM variability is extracted as AO variability in HCG.
3.3. Method of the bias-correction
The AO-related pattern and teleconnections in CMIP5 models and the consequent conclusions may be less reliable given the biases reported in section 3.1, so it is important to correct these biases to better represent the AO-related features in models. In observations, the Pacific center of AO is weak (figure 1(a)) and the linkage between AO and NPM is marginal (r = 0.16). In order to obtain a realistic AO variability in CMIP5 models, the NPM-related variability is suggested to be removed from the AO variability through a linear regression method (Wang et al 2007, Chen et al 2013a) as follows:

where  is the correlation coefficient of the NPMI with respect to the AOI and the
  is the NPM-independent AOI. The
 is then used as the bias-corrected AOI in models to calculate the AO-related pattern and teleconnections via linear regression. In observation, the AO-related SLP pattern changes little after removing the NPM variability (figures 1(a) and 5(a)), so do the Z500 (figures 1(d) and 5(c)) and SAT patterns (figures 1(g) and 5(e)) of AO. The spatial correlation coefficients between the original AO patterns and teleconnections (figures 1(a), (d) and (g)) and their
  -related counterparts (figures 5(a), (c) and (d)) all exceed 0.99. In MME, by contrast, the SLP pattern of AO has changed markedly when the NPM-related variability is removed. The excessively strong Pacific center is significantly weakened and the amplitude of the Atlantic center is recovered to be comparable to the observations (figures 1(a), (b) and 5(b)). Similar improvements can also be found in Z500 and SAT fields. For example, the anticyclonic center of Z500 over the North Pacific is significantly weakened and those over the North Atlantic and Northeast Asia are strengthened to be more close to observations (figures 1(d), (e) and 5(d)). Meanwhile, the spurious cold anomalies over the northwestern North America are corrected (figures 1(h) and 5(f)), and the SAT pattern in MME is more close to observations after the NPM signal is removed (figures 1(g) and 5(f)). These significant improvements can be also found in almost every model (not shown). These results suggest that the linear removal of the NPM variability from AO can significantly improve the pattern and teleconnections of AO in CMIP5 models. Of course, one should keep in mind that this bias-correction is a statistical method that does not improve the model dynamics.
Figure 5. Same as the left two columns of figure 1, but based on the normalized .
.
Download figure:
Standard image High-resolution image
4. Summary
Many investigators suggested that the climate models generally overestimate the magnitude of Pacific center in wintertime AO pattern (e.g. Miller et al 2006, Cattiaux and Cassou 2013), which may limit the skill of these models in simulating AO and its global teleconnections. This study reports the same biases in most of the 39 CMIP5 models. In observations, the wintertime AO has a weak Pacific center and shows a pattern that quite resembles the NAO. The similarity and linkage between the AO and NPM, the leading North Pacific SLP variability, are weak. In most of the CMIP5 models, by contrast, the Pacific centers of AO pattern are much stronger than that in observations although the modeled AO still resembles the NAO rather than the NPM. As a result, the AO-related Z500 and SAT are also biased. Moreover, it is suggested that the magnitude of the Pacific center of AO is closely tied to the AO–NPM linkage in CMIP5 models. An excessively high and positive correlation between AO and NPM corresponds to an excessively strong Pacific center of the AO. By classifying the 39 models into two groups (HCG and LCG) according to the temporal correlation between indices of AO and NPM, it is found that the pattern and teleconnections of AO are more similar to observations in LCG than in HCG. Finally, it is proposed that the biases in the pattern and teleconnections obtained by regressing model variability against the AOI can be significantly reduced when the NPM variability is linearly removed from the AOI.
5. Discussion
Previous studies indicated that the North Pacific climate variability is tightly related to the Pacific-North America (PNA) pattern (e.g. Rodionov et al 2005, Pinto et al 2011). In fact, the correlation coefficient between our winter mean NPMI and the PNA index defined in Wallace and Gutzler (1981) is −0.96 in observations. Meanwhile, the spatial patterns of the NPM in each of the 39 models are quite consistent with that in observations, and the pattern correlation coefficients between each model and observations all exceed 0.8 (0.94 in the MME). It suggests that the NPM defined in this study actually represents the PNA-like variability in both observations and models.
The EOF method is employed to represent the AO variability in this study. Although this method is widely used in the climate research community, debates and discussions exist on a simpler or more physical description of the AO. For example, some scholars (e.g. Christiansen 2002, Feldstein and Franzke 2006) suggested that the rotated EOF (REOF) based on the first two EOFs could provide improved physical descriptions of AO-related variability, and that the REOF approach affects the spatial structure of the AO pattern (Christiansen 2002). To examine whether the reported biases of AO in CMIP5 models are sensitive to the definition of AO, the REOF approaches were employed to extract the AO variability, and the biased Pacific center still exists (not shown). It suggests that the reported bias of AO does not arise from the way to define AO. In contrast, it is very likely to arise from imperfect physics in the models.
This study suggests that the magnitude of the Pacific center of AO is closely tied to the AO–NPM linkage in CMIP5 models, but it is still not clear why it occurs or whether it is related to other known model biases (e.g. Ceppi et al 2012, Davini and Cagnazzo 2014, Barnes and Polvani 2015). Based on observational dataset, Honda et al (2001) suggested that the significant North Pacific-Arctic linkage is contributed by a planetary wave train emanating from the North Pacific towards the North Atlantic. Castanheira and Graf (2003) proposed that the linkage of the atmospheric circulation between the North Pacific and the North Atlantic is modulated by the intensity of the stratospheric polar vortex. Further investigations of the mechanisms for AO–NPM linkage in CMIP5 models need to be done in the future.
It should be noted that the bias-correction method proposed in this study is to correct the AOI in order to improve the diagnostic estimates of teleconnections and it does not improve the model dynamics. Meanwhile, the method is based on and designed for the present-day climate conditions. It might not work in a future climate in which the pattern and associated teleconnections of AO may change under altered radiation forcing. The applicability of this method should be evaluated carefully before it is used to study the future climate.
Acknowledgments
We thank the two anonymous reviewers for their comments that helped to improve the manuscript. We acknowledge the climate modeling groups listed in section 2 for making available their model output, and the Working Group on Coupled Modeling (WGCM) of the World Climate Research Program (WCRP) for coordinating the CMIP5 project. This work was supported by the National Natural Science Foundation of China (41422501, 41230527, 41661144016).
Footnotes
- 3
This somewhat arbitrary criterion was chosen for two reasons. First, keep the sample sizes of HCG and LCG relatively comparable. Given most of CMIP5 models overestimate rAO–NPM (figure 2(a)), the sample size in LCG will reduce sharply to less than five if a smaller value (e.g. 0.3) that is more close to the observed rAO–NPM (0.16) is used. Second, a correlation coefficient falls in the 99.8% confidence level if it exceeds 0.45 for a sample size of 45 winters based on two-sided Student's t test. If a larger value (e.g. 0.5) is used, some rAO–NPM in LGC will be too high to be subject as 'low correlation'. Despite of the arbitrariness, the results reported here are not very sensitive to the choice of criterion. For example, if the correlation coefficient 0.47 that indicates the 99.9% confidence level is employed, the sample sizes of LCG and HCG and thereby the results in figure 4 remain the same.