

Abstract
China suffers from frequent summer floods and droughts, but seasonal forecast skill of corresponding summer rainfall remains a key challenge. In this study, we demonstrate useful levels of prediction skill over the Yangtze river valley for summer rainfall and river flows using a new high resolution forecast system. Further analysis of the sources of predictability suggests that the predictability of Yangtze river valley summer rainfall corresponds to skillful prediction of rainfall in the deep tropics and around the Maritime Continent. The associated dynamical signals favor increased poleward water vapor transport from South China and hence Yangtze river valley summer rainfall and river flow. The predictability and useful level of skill demonstrated by this study imply huge potential for flooding and drought related disaster mitigation and economic benefits for the region based on early warning of extreme climate events.
Export citation and abstract BibTeX RIS

Original content from this work may be used under the terms of the Creative Commons Attribution 3.0 licence. Any further distribution of this work must maintain attribution to the author(s) and the title of the work, journal citation and DOI.
1. Introduction
The Yangtze is the longest river in China with a locally rich water resource associated with intense monsoon rainfall. Additionally, it is also the most densely populated region in China and is associated with 40% of crop production in China, but suffers frequent flooding. Floods and droughts occur frequently in China and are the most serious disasters during summer time. In the last three decades, about 200 floods and 30 droughts occurred in China, associated with huge impacts (Zheng et al 2006, Strömberg 2007, Ding et al 2008). The catastrophic Yangtze river floods in 1998 resulted in more than 3000 deaths, $25 billion in economic loss and made 15 million people homeless (Huang et al 1998, Jiang et al 2008). Furthermore, future year to year changes in Yangtze river valley summer rainfall may be exacerbated by climate change (Lu and Fu 2010). However, until recently, skillful predictions of year to year variations of Yangtze river valley summer rainfall have been elusive, despite recent advances in climate forecasting. Nevertheless, the prospect of a substantial improvement in long-range forecast of Yangtze river valley summer rainfall offers enormous potential benefit to society.
It has been generally recognized that Yangtze river valley summer rainfall experiences strong interannual variation, associated with tropical air–sea interactions (Simmonds et al 1996, Shen et al 2001, Wang and Zhang 2002, Liang et al 2009). Many statistical and dynamical downscaling methods are used to predict Yangtze river valley summer rainfall (Zhu et al 2008, Zou et al 2010, Li and Lin 2015). However skill is modest and model dependent. Further development of dynamical-coupled forecast systems is the basis for objective seasonal prediction of Yangtze river valley summer rainfall. Additionally, current coupled climate models display considerable capability in skillful prediction of tropical SSTs and even the western North Pacific (WNP) subtropical high (Li et al 2012, 2014, Kosaka et al 2013). However, prediction skill decreases dramatically from the WNP to the land and has remained low for rainfall over the Yangtze river valley.
Nevertheless, summer rainfall over the Yangtze river valley may be the most potentially predictable in China. There is a strong link between summer rainfall over the Yangtze river valley and tropical WNP, which is recognized as the Pacific-Japan or East Asia-Pacific teleconnection pattern (Nitta 1987, Huang and Sun 1992). Considering the relatively high prediction skill of tropical WNP rainfall shown by current models (Li et al 2012, 2014), one might expect that Yangtze river valley rainfall could exhibit more predictability than has yet been realised.
In this study, we present estimates of the predictability of summer rainfall over the Yangtze river valley, using the Met Office Global Seasonal forecast System 5 (GloSea5) (MacLachlan et al 2015). GloSea5 has a high resolution in both the atmosphere and ocean components, and provides skillful and reliable predictions of major modes of variability, including El Niño-Southern Oscillation (ENSO) and North Atlantic Oscillation (Scaife et al 2014, MacLachlan et al 2015). For comparison with GloSea5, retrospective forecasts from the ENSEMBLES seasonal multi-model project are also assessed (van der Linden and Mitchell 2009, Weisheimer et al 2009).
2. Model, hindcast experiments and observations
The Hadley Center Global Environmental Model version 3 is used in the GloSea5 forecast system (Hewitt et al 2011, Walters et al 2011). It correponds to a high resolution, with 0.83° longitude by 0.56° latitude and 85 quasi-horizontal atmospheric levels (N216L85) in the atmosphere, and 0.25° globally and 75 quasi-horizontal levels in the ocean (0.25L75). The relatively high resolution is potentially helpful in reducing the key biases for the climatological rainfall over China (Gao et al 2006).
Retrospective forecasts in GloSea5 were performed for each summer from 1992 to 2013, initialized on 25 April, 1 May and 9 May, with ten members for each start date, totaling 30 members per summer. The European Centre for Medium-Range Weather Forecasts (ECMWFs) Re-Analysis Interim is used to initialize the atmosphere and land surface. The Forecast Ocean Assimilation Model (Blockley et al 2013) is used for the ocean and sea-ice initialization.
In ENSEMBLES, the retrospective forecasts were initialized on 1 May for each summer from 1960 to 2005. There are 45 ensemble members in total. Five fully coupled models, including an earlier version of the UK Met Office system (UKMO), Météo-France (MF), the ECMWF, the Leibniz Institute of Marine Sciences at Kiel University (IFM-GEOMAR) and the Euro-Mediterranean Center for Climate Change (CMCC-INGV) are included with nine members from each model (van der Linden and Mitchell 2009).
Several common datasets are used for validating the model hindcast, including the National Centers for Environmental Prediction/Department of Energy (NCEP/DOE) Reanalysis 2 (Kanamitsu et al 2002) and monthly precipitation data obtained from Global Precipitation Climatology Project (GPCP) (Adler et al 2003). The summer GPCP precipitation is used as the observed rainfall dataset. It is closely related to the observed 160-station rainfall data from the China Meteorological Administration over Yangtze river valley (25°N–35°N, 91°–122°E) (Zhang et al 2008), with a correlation coefficient 0.95 from 1992 to 2013. The observed river flow data from 1992 to 2008 for the middle and lower reaches of Yangtze river valley, which are represented by Hankou (30.57°N, 114.29°E) and Datong (30.78°N, 117.61°E) stations, were obtained from the Chinese Ministry of Water Resources.
3. Prediction skill of Yangtze river valley summer rainfall
Figure 1(a) shows the year to year variation of the summer rainfall over the Yangtze river valley (25°N–35°N, 91°–122°E) (Zhang et al 2008) for the model predictions and observations. The ensemble average and the observations show a correlation of 0.55 for the 1992–2013 period, exceeding the 99% confidence level according to a t test. This value indicates that a considerable level of prediction skill for Yangtze river valley summer rainfall can be obtained in operational dynamical coupled forecast systems. The skill over most of the Yangtze river valley suggests an improvement of summer rainfall predictions (figure 1(b)), over the very low skill in summer rainfall over the Yangtze river valley in previous systems (e.g., figure 1(f) in Lee et al (2011), figure 4 in Li et al (2012)). The rainfall anomalies in many years are well reproduced, especially the very strong rainfall in 1998. The notable extreme in 2010 in GloSea5 connects closely to the previous winter El Niño event, but this rainfall in observations is greatly weakened by the northward displacement of the East Asian upper-tropospheric westerly jet, which is largely controlled by the internal atmospheric variability (Lu et al 2006).
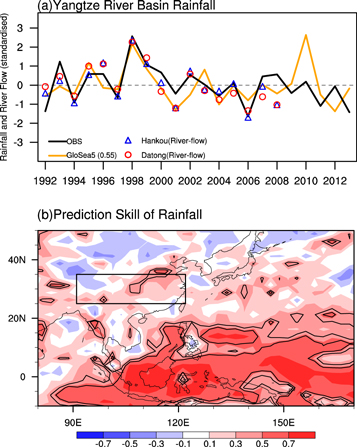
Figure 1. Prediction of summer (June to August, JJA) rainfall in the Yangtze river basin. Normalized anomaly of Yangtze river basin summer rainfall from 1992 to 2013 (a). Precipitation in observations (black line), ensemble mean forecasts in GloSea5 (orange line), river flow for the middle (Hankou (30.57°N, 114.29°E), blue triangle) and lower (Datong (30.78°N, 117.61°E), red circle) reaches of Yangtze river from 1992 to 2008 are standardised by their respective standard deviations. The correlation score of 0.55 between the ensemble mean forecasts and observation for the hindcast period from 1992 to 2013 exceeds the 99% confidence level according to a t-test. Temporal correlation coefficient of summer rainfall bewteen the forecast in GloSea5 and observations (b). The black contours represent grid-point statistical significance exceeding the 95% and 99% confidence levels. The black box indicates the Yangtze river basin domain (25°N–35°N, 91°–122°E) used in (a).
Download figure:
Standard image High-resolution imageFor the summer rainfall over the Yangtze river valley, these forecasts could also be useful in delivering risk based warning of floods over the Yangtze river valley, as the correlation coefficient between the predicted rainfall and the observed river flow for the lower (middle) reaches of Yangtze river valley is 0.79 (0.76) from 1992 to 2008. This value is close to that in observations, which is 0.74 (0.83) between the observed rainfall and river flow for the lower (middle) reaches of Yangtze river valley. This good correlation suggests that skillful prediction of Yangtze river river flow is possible. Note though that the correlation uncertainty due to the finite number of years used here means that it is not necessarily higher than the rainfall skill itself.
The interannual variability of Yangtze river valley summer rainfall from individual ensemble members also agrees well with that in observations, which is 0.60 (0.58) mm day−1 in forecast (observations) of the interannual standard deviation corresponding to 9.2% (8.1% for observations) of the climatological mean rainfall. The variability of the ensemble mean signal is 0.26 mm day−1 and after a division by the standard deviation of total ensemble members (Kumar 2009), the corresponding signal-to-noise ratio is 0.48. As has been found in other contexts (Eade et al 2014, Kumar et al 2014, Scaife et al 2014), the correlation between individual ensemble members and the observations (0.23 with a standard error 0.04) is larger than the average correlations between pairs of forecasts (0.15) and so the model may still underestimate the true predictability of Yangtze river valley summer rainfall.
Figure 2(a) shows the increase of ensemble mean forecast skill with number of ensemble members for the period common to both GloSea5 and ENSEMBLES hindcast sets (1992–2005). The average prediction skill over Yangtze river valley summer rainfall increases with the number of forecast members. The asymptote of the curve, which represents the maximum achievable skill for a large ensemble (Murphy 1990), is 0.81 for GloSea5, suggesting that greater skill would result from a larger ensemble size. The skillful prediction of Yangtze river valley summer rainfall reaches 0.74 for the existing ensemble of 30 GloSea5 forecasts and exceeds the 99.7% confidence level of significant skill. It significantly outperforms the prediction correlation of the ENSEMBLES forecasts with the same number of forecast members and for the same period: the averaged 30-member forecast skill in ENSEMBLES forecasts is only 0.38 and the maximum skill achieved from all possible 30-member forecasts is also lower, at 0.60. This suggests significant improvement of GloSea5 in comparison with the ENSEMBLES forecasts, where the correlation skill achieved even with 45 members is 0.40 and the skill of very large ensemble is extrapolated to be 0.43. In addition, there is a larger signal component in GloSea5 than that in ENSEMBLES, as shown from the ensemble-mean variability in figures 2(c) and (d). The bigger signal in GloSea5 gives rise to the faster increase of the prediction skill with increasing ensemble size (figure 2(a)). The correlation coefficient between individual ensemble members and the observations is 0.30 ± 0.05 (0.13 ± 0.04) for GloSea5 (ENSEMBLES) forecasts, further suggesting that more of the predictable signal related to the year to year fluctuations of Yangtze river valley summer rainfall are captured by the GloSea5 forecast system. We should also note that the prediction skill is higher during 1992–2005 than during the full 1992–2013 period (figure 1), so there is some uncertainty due to the choice of a finite set of years.
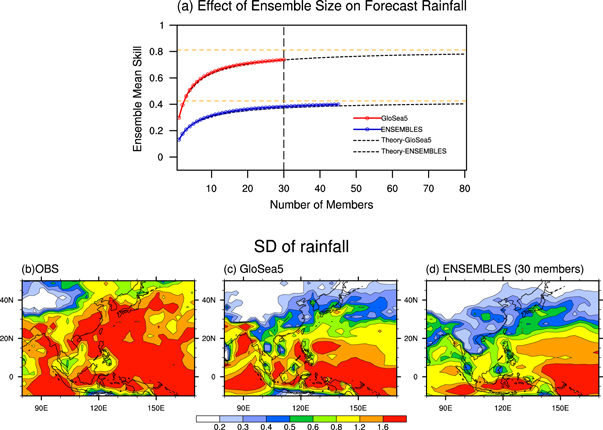
Figure 2. Prediction skill related to ensemble size and rainfall variability in ensemble mean forecasts and observations. The upper panel shows ensemble mean skill versus ensemble size for the period 1992–2005 in GloSea5 (red) and ENSEMBLES (blue) (a). A simple theoretical fit from (Murphy 1990) is applied and shown by the dotted curve. The asymptote of the theoretical fits, which represents the maximum achievable skill for an infinitely large ensemble is 0.81 in GloSea5 and 0.43 in ENSEMBLES and is shown by the horizontal dashed orange lines. Interannual variability (SD) of the summer rainfall is shown in observations and 30-member ensemble means of GloSea5 and ENSEMBLES (b)–(d).
Download figure:
Standard image High-resolution image4. Sources of prediction skill
Through linear regression of various fields onto Yangtze river valley summer rainfall, we identify sources of the prediction signal. We detect a close teleconnection between Yangtze river valley summer rainfall and anomalous convection around the Maritime Continent (figure 3). The anomalous positive convection around the Maritime Continent (figures 3(a) and (b)) is likely to excite the northward Rossby wave-like perturbation, trigger the East Asia-Pacific or Pacific-Japan teleconnection pattern and further force a negative vorticity anomaly around the Philippines and South China Sea via vorticity stretching in the low-level troposphere (Hsu and Lin 2007, Sui et al 2007, Kosaka et al 2013), enhancing the southerly winds around South China. Interannual variations of Yangtze river valley summer rainfall in these simulations and observations therefore correspond consistently to southerly winds around South China (figures 3(d) and (e)), which transport water vapor from the tropical warm ocean to Yangtze river valley.
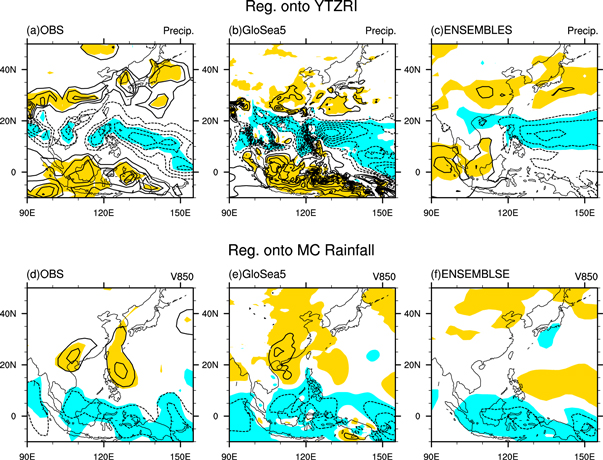
Figure 3. Predictable teleconnections between Yangtze river valley summer rainfall and convection around the Maritime Continent. Regressed anomalies of precipitation (a)–(c) onto Yangtze river valley rainfall averaged over (25°N–35°N, 91°–122°E) (YTZRI) and 850 hPa meridional winds (d)–(f) onto the Maritime Continent (MC) rainfall averaged over (5°S–5°N, 110°–140°E) during 1992 to 2005 are plotted with contour intervals of 0.4 mm day−1 and 0.2 m s−1, respectively. The shading represents statistical significance exceeding the 95% confidence level.
Download figure:
Standard image High-resolution imageFor the meridional teleconnection between the WNP and East Asia, many previous studies have emphasized convection around the Philippine Sea (Lu 2001). Here, we further suggest the importance of convection around the Maritime Continent, especially over its eastern part, on the seasonal prediction of Yangtze river valley summer rainfall. The close teleconnection between convection around the Maritime Continent and Yangtze river valley summer rainfall exists in most of the major predictable modes related to Yangtze river valley summer rainfall (Yim et al 2016), further implying the importance of predictable sources from convection around the Maritime Continent. Seasonal forecasts from GloSea5 capture this teleconnection around the Maritime Continent (figure 3(b)). The correlation coefficient between the rainfall over the Yangtze river basin and that over the east Maritime Continent (5°S–5°N, 110°–140°E) is 0.53 in GloSea5, which is close to observations (0.60). This relationship was not reproduced by the older ENSEMBLES data, where the corresponding correlation coefficient is not significant (figure 3(c)). As variation of the southerly winds around South China closely connects to Yangtze river valley summer rainfall, the relationship between convection around the east Maritime Continent and the southerly winds is also better described in GloSea5 (figures 3(d)–(f)). The corresponding correlation coefficient between the anomalous convection over the Maritime Continent and the meridional winds over South China (15°N–30°N, 100°–120°E) is 0.72 (0.57) in GloSea5 (observation), but is only 0.11 in ENSEMBLES.
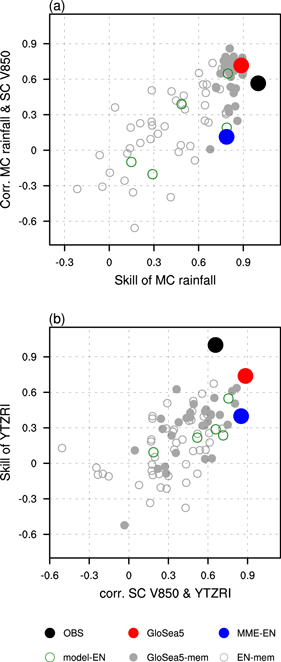
Two processes, impacts of convection around the Maritime Continent on the southerly winds and further on the rainfall over the Yangtze river basin, are further supported by the members in the forecast ensembles (figure 4). The better prediction of convection around the Maritime Continent produces a closer teleconnection with the southerly winds around South China (figure 4(a)) and favors better prediction of the southerly winds. Better description of the teleconnections between southerly winds and Yangtze river valley summer rainfall also drives predictable signals for the rainfall over the Yangtze river valley (figure 4(b)). The above processes are in agreement with idealized studies imposing diabatic warming over the Maritime Continent using a simplified global climate model (Wu et al 2016). Similar to the forecasts shown here, anomalous southerly winds around South China and enhanced rainfall over the Yangtze river valley result from enhanced heating over the Maritime Continent.
Figure 4. Connections between Maritime Continent rainfall, meridional winds and skill of Yangtze river valley rainfall predictions. Scatter plots for prediction skill of the Maritime Continent (5°S–5°N, 110°–140°E) rainfall (x-axis) and relationship between Maritime Continent rainfall and the South China (15°N–30°N, 100°–120°E) 850 hPa meridional winds (y-axis) (a); relationship between the South China 850 hPa meridional wind and Yangtze river valley summer rainfall (x-axis) against skill of Yangtze river valley summer rainfall (y-axis) (b). The skill is represented by prediction correlation between model hindcast and observations, and observations are assumed perfect with a skill of 1. Observations (black solid dot), GloSea5 (red solid dot for ensemble mean and gray solid dots for 30 ensemble members) and ENSEMBLES (blue solid dot for MME, green hollow dots for the five model ensemble means and gray hollow dots for 45 members).
Download figure:
Standard image High-resolution image
5. Summary and discussion
By reassessing seasonal predictability from this new forecast system we have shown that skillful long-range predictions of Yangtze river valley summer rainfall can be achieved. It is found that skillful prediction of Yangtze river valley summer rainfall arises from the prediction of convection around the Maritime Continent, which directly affects the water vapor transport into South China. This work emphasizes the importance of convection around the Maritime Continent onto the prediction of Yangtze river valley summer rainfall, which may be associated with different tropical air–sea interactions and tropical SST feedbacks (Wang et al 2015, Yim et al 2016). Further work could also examine proposed mechanisms for the ENSO-summer monsoon rainfall (e.g. Xie et al 2009, Zhang et al 2016). Whatever the mechanism, given the clear link to Yangtze river valley rainfall, these forecasts could also be useful in delivering early warning of floods and droughts over China.
These results on the skillful prediction of Yangtze river valley summer rainfall are achieved with the global atmosphere-ocean coupled model from GloSea5. They could also provide an important basis for further improving the prediction of Chinese rainfall through statistical or dynamical downscaling, which deserves further study. As an operational forecast system, GloSea5 now offers the prospect of useful predictions for Yangtze river valley summer rainfall and river flow in the future years and is now being applied in real time forecasts following the 2015/16 El Niño event.
Acknowledgments
We thank the three anonymous reviewers for their comments and constructive suggestions. This work was supported by the National Natural Science Foundation of China (Grant No. 41320104007). This work and its contributors were also supported by the UK-China Research & Innovation Partnership Fund through the Met Office Climate Science for Service Partnership (CSSP) China as part of the Newton Fund. AAS was also supported by the European Union Programme FP7/2007-13 under grant agreement 3038378 (SPECS).