

Abstract
Freezing rain and freezing drizzle events represent a critical feature of many regions of the world. Even at low intensities, these events often result in natural hazards that cause damage to housing, communication lines, and other man-made infrastructure. These events usually occur near the 0 °C isotherm. In a changing climate, this isotherm will not disappear, but its position in space and time will likely change as will the geography of freezing precipitation. A larger influx of water vapor into the continents from the oceans may also increase the amount and frequency of freezing precipitation events. This paper assesses our current understanding of recent changes in freezing precipitation for the United States, Canada, Norway, and Russia. The research is part of a larger GEWEX Cross-Cut Project addressing 'cold/shoulder season precipitation near 0 °C'. Using an archive of 874 long-term time series (40 years of data) of synoptic observations for these four countries, we document the climatology of daily freezing rain and freezing drizzle occurrences as well as trends therein. The regions with the highest frequency of freezing rains (from 3 to 8 days per year) reside in the northeastern quadrant of the conterminous United States and adjacent areas of southeastern Canada south of 50 °N and over the south and southwest parts of the Great East European Plain. The frequency of freezing drizzle exceeds the frequency of freezing rain occurrence in all areas. During the past decade, the frequency of freezing rain events somewhat decreased over the southeastern US. In North America north of the Arctic Circle, it increased by about 1 day yr−1. Over Norway, freezing rain occurrences increased substantially, especially in the Norwegian Arctic. In European Russia and western Siberia, the frequency of freezing rain somewhat increased (except the southernmost steppe regions and the Arctic regions) while freezing drizzle frequency decreased over entire Russia.
Export citation and abstract BibTeX RIS

Original content from this work may be used under the terms of the Creative Commons Attribution 3.0 licence. Any further distribution of this work must maintain attribution to the author(s) and the title of the work, journal citation and DOI.
1. Introduction
Many regions of the world are subjected to precipitation occurring near 0 °C during the cold and shoulder seasons (hereafter, near 0 °C precipitation). Some of these events occur as freezing rain and freezing drizzle, which are the foci of this study. These events nearly always generate hazards for infrastructure and transportation. Freezing rain events may create hazardous traffic conditions and icing on communication lines (Changnon 2003, Changnon and Bigley 2005). Furthermore, they can have major impacts on ecosystems and wildlife (Millward and Kraft 2004, Zhou et al 2011, Stien et al 2012, Stewart et al 2015). These events also affect large regions of the world. Higher latitude areas such as Russia, Fennoscandia, Canada, and the United States are particularly prone, but on occasion, lower latitude regions are affected as well (see Carriere et al 2000, Cortinas et al 2004, Zhou et al 2011).
With global climate change, future changes in temperature, storm intensity, and storm tracks will alter the likelihood and occurrence of near 0 °C precipitation (e.g. Lambert and Hansen 2011). A weakening of the atmospheric circulation in the extratropical regions (e.g., Wang et al 2012, Tilinina et al 2013) may lead to more polar jet stream meandering (e.g., Francis and Vavrus 2012) that can result in more persistent near 0 °C temperatures. This may also imply more freezing events. The overall warming, together with a larger influx of water vapor in winter from the oceans (including ice-free portions of the Arctic Ocean), will likely increase the amount of near 0 °C precipitation as well as the fraction that falls as freezing rain. Generally, near 0 °C temperatures should move poleward and arrive at many locations earlier in spring or later in autumn. This could potentially affect the seasonal cycle of freezing precipitation.
In a detailed assessment of changes in climate extremes, Kunkel et al (2013) concluded that freezing precipitation was associated with the lowest level of understanding for both detection and attribution amongst several types of hazardous weather conditions. Given this gap in the state of knowledge and recent climate changes in the extratropics, the objectives of this paper are
- to document the climatology of freezing precipitation events (frequency and intensity) over most of the northern hemisphere extratropics, and
- to document recent changes (if any) since the late 20th century, with a special focus on the last decade.
An overarching objective is to improve our understanding of future changes in hazardous freezing precipitation events and, when possible, to assess their societal impact.
2. Data
The study employed hourly surface station data from the Integrated Surface Database (ISD; Smith et al 2011). This global archive was supplemented with additional data from the Russian Institute for Hydrometeorological Information (RIHMI-WDC-B) and at the Norwegian Meteorological Institute (MET Norway). Freezing events are documented in these archives by a specific Present Weather Code (PWC) variable that adheres to WMO standards (WMO 2004). Additionally for Russia, we exploited the Atmospheric Events data set that stores information about the duration and intensity of ice on the ground (in Russian, 'gololed'). We counted days with freezing events that were defined as days with at least one such event. Thus, two separate freezing drizzles in a given day were counted only once.
Figure 1 shows the stations used in our analyses. To be included in the study, a station had to have at least 40 years of synoptic data, more than 10 years available in the 21st century, and less than 10% missing in two separate periods (1975–2004 and 2005–2014). Each station was also required to have less than 10% of its PWCs missing in year. This prevented the inclusion of stations which had significant changes in PWC reporting practice through time. In addition, major known sources of non-climatic changes were removed from each time series used for climate change analysis.
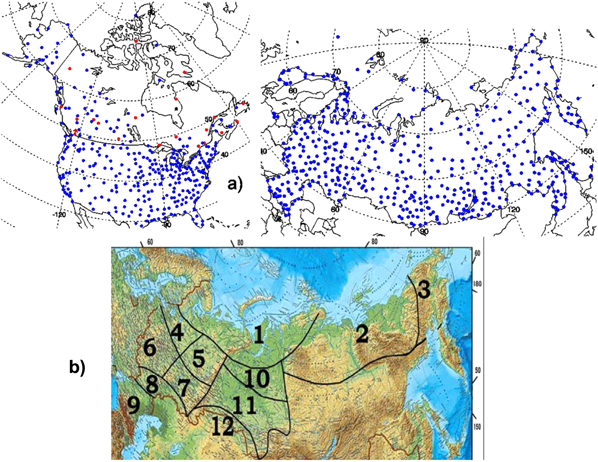
Figure 1. (A) Long-term synoptic stations used in our analyses. Red dots present composite Canadian stations used in the study. The term 'composite' is explained in appendix section
Download figure:
Standard image High-resolution imageAppendix
3. Results
The analysis consisted of two parts. The first part involved computing a long-term climatology of freezing rain and freezing drizzle events in each country for the past four decades. The second part was devoted to assessing changes in the frequency and intensity of these events (e.g., by comparing the 2005–2014 period to the previous 30 year baseline period).
3.1. Climatology
Figure 2 depicts the long-term mean annual frequency of freezing events over North America. In the eastern US, the Great Lakes, and the Maritime Provinces of Canada, freezing events are quite frequent, occurring from 4 to 15 days per year. Here we observe the highest rate of freezing rain occurrence in North America. In contrast, freezing events are very rare in the western half of the contiguous US and along the Gulf Coast. Aside from the latter, we observe freezing events throughout the humid mid-latitudes. A comparison of subplots (A) and (B) in figure 2 shows that the freezing rain climatology is stable at the 20 year-long intervals.
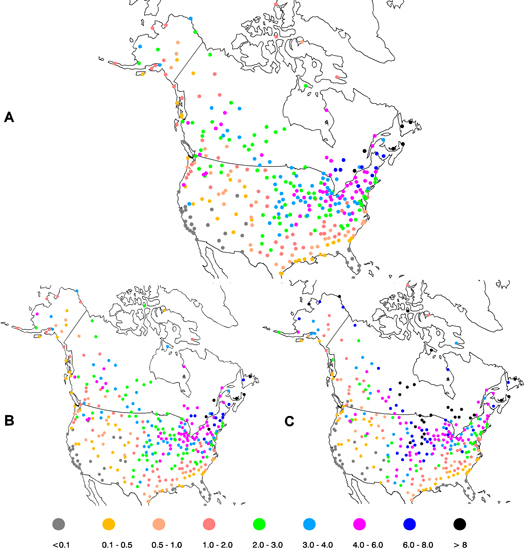
Figure 2. Long-term mean annual frequency of freezing events over North America (A) for freezing rains from 1975–2014; (B) for freezing rains from 1975–1994, and (C) for freezing drizzle from 1975–1994, respectively. The shorter period for the freezing drizzle climatology was selected in order to use only the pre-automation era (see appendix
Download figure:
Standard image High-resolution imageA comparison of subplots (B) and (C) shows that over most of North America, the frequency of days with freezing drizzle is much higher than for days with freezing rain. North of 60 °N, it is three times more frequent. The high latitudes of both countries exhibit the maximum occurrence of freezing drizzle (e.g., up to 25 days per year at Gander International Airport on the northeastern part of the Newfoundland Island).
Figure 3 shows the long-term mean annual frequency of freezing events over Russia and Norway for the past four decades. For drizzle, we also present the long-term mean values for both countries. However, the analysis for Norway was limited to 1975–1994 for the same reason as for the US and Canadian drizzle reports. Freezing rain events are most frequent in European Russia, which (a) is sufficiently exposed to moisture advection from the North Atlantic Ocean, and (b) has relatively long shoulder seasons with temperatures close to 0 °C. Further to the east, freezing precipitation is less common due to lesser near-surface atmospheric humidity and a more continental climate (with short shoulder seasons). Along the Pacific coast of Russia, a secondary small peak in the frequency of freezing rain is observed. The pattern of freezing drizzle over Northern Eurasia follows that of freezing rain, but its magnitude is higher. Across Russia, there are on average 0.8 d yr−1 for freezing rain versus two and half d yr−1 with freezing drizzle.
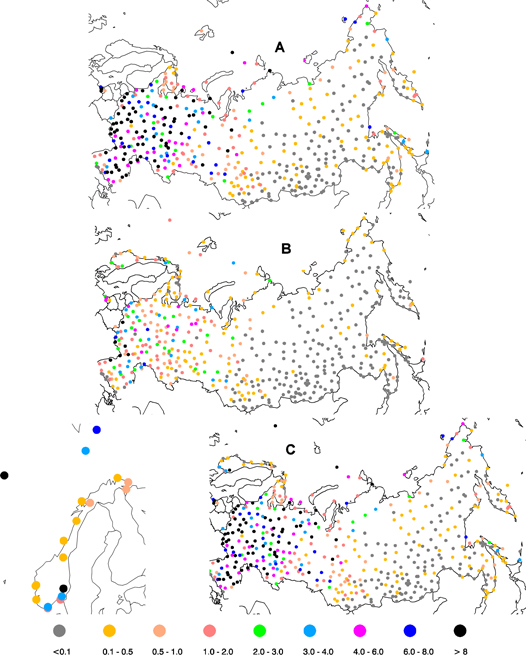
Figure 3. Long-term mean annual frequency of freezing rain and drizzle events over Russia and Norway for 1975–2014: (A) all types of freezing events are counted (for Russia only), including ice pellets and events when observers reported freezing precipitation but had difficulty distinguishing between freezing drizzle and light freezing rain; (B) only freezing rain events and (C) only freezing drizzle events. For drizzle climatology over Norway including Norwegian Arctic Islands, the 1975–1994 period was used (enlarged separately in figure 3(C)).
Download figure:
Standard image High-resolution imageIn contrast to North America, the ratio of days with freezing drizzle to freezing rain over Russia and Norway varies insignificantly with latitude. We hypothesize that the increase of this ratio in the high latitudes of North America may be related to much a higher frequency of trace rainfall reports in similar climates compared to Northern Eurasia. An intercomparison of the freezing drizzle climatologies over North America and Eurasia during the pre-automation period (figures 2 and 3) indicates that the North American drizzle reports could be inflated due to the lower precision of the rain gauges employed there: cf, 0.24 mm (or 0.01 inch) in the US versus 0.05 mm in Russia and Norway. In other words, non-zero precipitation totals may have a greater chance of being reported as rainfall instead of drizzle. As a result, over humid Norway, freezing drizzle frequency does not exceed 2 d yr−1, while over Canada and the central and northeastern US it is never below 2 d yr−1 and frequently exceeds 8 d yr−1.
Rainfall and drizzle rates above 2.5 mm h−1 and 0.1 mm h−1 respectively are considered moderate and/or heavy (WMO 2006). These events are assigned to single PWC (WMO 2004) and in this paper we use the term 'intense' to characterize them. Homogeneous information on intense freezing events is not available for the other countries, see, sections

Figure 4. Long-term mean annual frequency of intense freezing rain (left) and drizzle (right) events over the western half of Russia for 1975–2014.
Download figure:
Standard image High-resolution image3.2. Changes during the past decade compared to the late 20th century
This assessment compared freezing precipitation characteristics for the last decade (2005–2014) with those for the previous three decades (1975–2004). Maps of point estimates of the differences between these two periods are shown in figures 5 and 6. Thereafter, we conducted area-averaging of the freezing rain time series over the regions shown in figure 1(b) (for Russia), Norway south and north of the Arctic Circle, and selected regions of North America. The resulting 40 yr long time series were tested for systematic changes using comparison of mean values over the past decade (2005–2014) and over the previous three decades (t-test). The comparison of mean values over the first and second halves of the study period was also conducted (see section
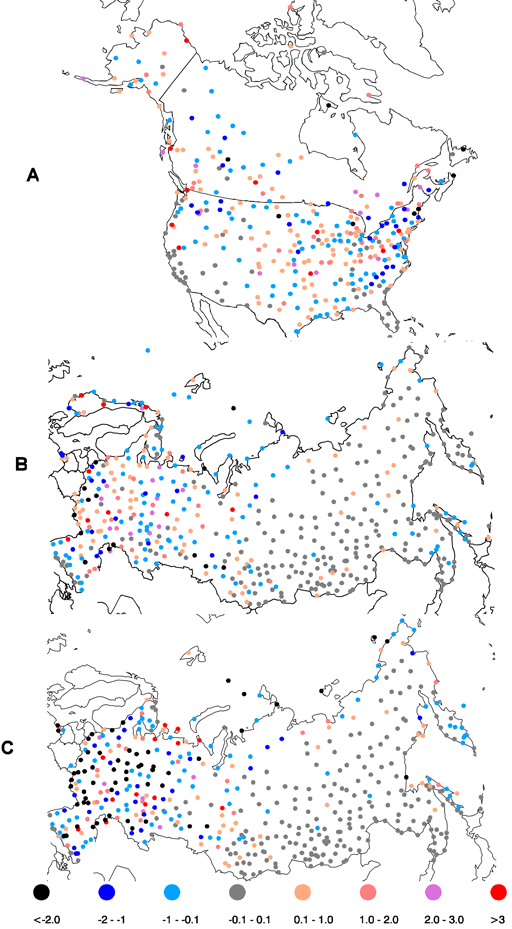
Figure 5. Changes in frequency (days per year) between the last decade (2005–2014) and the previous three decades (1975–2004) for freezing rain over North America, Norway, and Russia (a), (b) and for freezing drizzle over Russia (c).
Download figure:
Standard image High-resolution image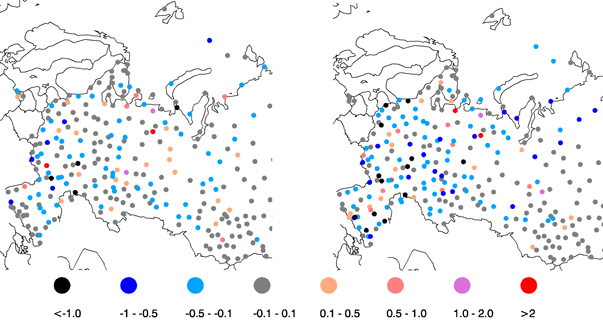
Figure 6. Changes in frequency (days per year) between the last decade (2005–2014) and the previous three decades (1975–2004) for intense freezing rain (left) and for intense freezing drizzle (right) over the western half of Russia.
Download figure:
Standard image High-resolution image
Figure 7. Light and intense freezing drizzle event frequency over the long-term stations of the Russian Federation (shown in figure 1(a)). Light freezing drizzle occurrence (LFD; left axes) is approximately ten times larger than this occurrence for intense freezing drizzle (IFD, right axes). Both frequencies are decreasing with time with the rates equal to −0.26 days (10 yr)−1; R2 = 0.35 and −0.04 days (10 yr)−1; R2 = 0.57 respectively. Statistical significance of these decreasing linear trends is well below 0.01.
Download figure:
Standard image High-resolution image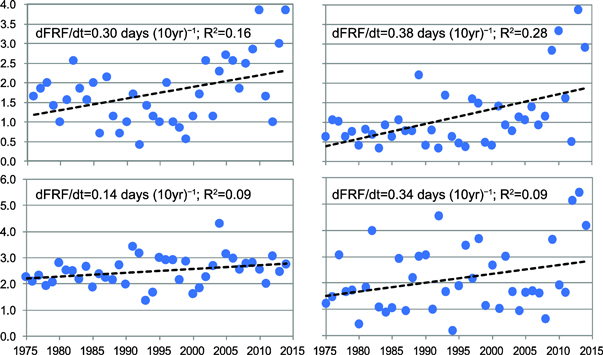
Figure 8. Annual freezing rain frequency, FRF, area-averaged over (upper row, left) North America and (upper row, right) Northern Norway, both north of the 66.7 °N; and (second row, left) North America between 50 °N and 60 °N and (second row, right) the northeastern quadrant of the Great East European Plain (region 5 in figure 1(b)). Note difference in the scale of the freezing rain occurrence in the Arctic and the boreal regions.
Download figure:
Standard image High-resolution image
Figure 9. Annual freezing rain frequency, FRF, area-averaged over (left) the Steppe Zone of European Russia and (right) the southern West Siberia (respectively, regions 8 and 11 in figure 1(b)). Note the order of magnitude scale difference between the continental Siberian region and the Steppe Region of European Russia, which is exposed to Mediterranean and Black Seas impact during the mild cold season.
Download figure:
Standard image High-resolution image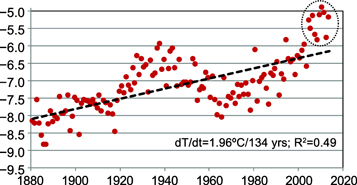
Figure 10. Arctic surface air temperatures (°C) north of 60 °N; archive of Lugina et al (2006), updated.
Download figure:
Standard image High-resolution imageIn North America (figure 5(a)), changes in the annual frequency of freezing rain were on the order of ±2 d yr−1 with no particular pattern. Except for the high Arctic, regionally averaged annual time series do not show changes that are statistically significant at the 0.05 level (figure 5; table 1). Freezing rain frequencies decreased over parts of the southeastern US (south of 36 °N, e.g., in the Southern Appalachians). Over the northernmost Western Hemisphere (north of the Arctic Circle) the frequency of freezing rain events increased by about 1 d yr−1. The sign of changes over Norway varied across the country (figure 5(b)), though regional totals show statistically significant increases over the entire country during the past decade (table 1; figure 8). In Russia (figures 5(b), 9, table 1), there were decreases in the frequency of freezing rain in the south and increases over the northeastern part of the Great East European Plain and in the northern part of the forest zone of West Siberia. Freezing events are generally infrequent in the eastern half of the country, though it is worth noting that the Russian Pacific Arctic (region 3 in figure 1(b)) experienced a decrease of 40%. Changes in the freezing drizzle events occurrence over Russia were very different from those for freezing rain occurrence (see figures 5(b) and (c)). Over most of Russia, we observed decreases in these frequencies from the Arctic to the steppe zone regions including the nationwide negative trend (figure 7).
Table 1.
Long-term regional mean values of freezing rain frequency over Norway and selected regions of North America and Russia for 1975–2014 and differences between the mean values for the last decade (2005–2014) and the previous 30 yr-long period (1975–2004). Statistically significant changes at the 0.05 level are in bold and at the 0.10 level are in bold italic, respectively. Tests that reported these significant changes are listed in the last column of the table. Section
| Region | Regional mean values days yr−1 | Diff. days yr−1 | Significant changes by following tests |
|---|---|---|---|
| North America north of 66.7 °N | 1.8 | 1.06 | t- & L- tests |
| North America, between 50 °N and 60 °N | 2.5 | 0.28 | L-test & Rs- test |
| North America, between 36 °N and 50 °N east of 95 °W | 4.0 | 0.05 | |
| North America south of 36 °N, east of 85 °W | 0.8 | −0.21 | t-test |
| Norway south of 66.7 °N | 1.1 | 1.05 | All three tests |
| Norway north of 66.7 °N | 1.1 | 1.10 | All three tests |
| Russian Atlantic Arctic | 1.4 | −0.20 | L- & Rs- tests |
| Northwest of the Great East European Plain | 1.3 | 0.28 | |
| Northeast of the Great East European Plain | 2.2 | 0.77 | L- & Rs- tests |
| Southwest of the Great East European Plain | 4.2 | 0.32 | |
| Southeast of the Great East European Plain | 1.8 | 0.28 | |
| Steppe Region of European Russia | 4.3 | −1.30 | L- & Rs- tests |
| Northern Caucasia Steppes and Piedmont | 2.1 | 0.16 | |
| Northern part of the forest zone of West Siberia | 1.0 | 0.67 | t-test |
| Southern part of the forest zone of West Siberia | 0.7 | −0.20 | L- & Rs- tests |
| Steppe zone of West Siberia | 0.9 | −0.33 |
Changes in intense freezing precipitation events over the western half of Russia are shown in figure 6. While very infrequent, these estimates nevertheless show a qualitatively substantial decrease in the frequency of intense freezing drizzle events.
Our estimates of recent changes in the frequency of freezing rain (figures 5, 8, and 9, and table 1) demonstrate several notable features. For example, figure 8 shows that changes in high latitudes occurred mostly in the past decade. Except North America between 50 °N to 60 °N with a single outlier in 2004, the anomalous years in the other three regions shown in this figure, were 2009, 2013, and 2014. The fourth anomalous year in the Arctic regions was 2010, and in the northeast of European Russia—2012. These years' values define the observed change in table 1 and in the 'trend' estimates. In contrast, statistically significant changes in the southern regions of West Siberia and European Russia (figure 9), as well as in the southeastern US (not shown) demonstrate a gradual decrease in the annual freezing rain frequency.
Table 2 presents estimates of the changes in the frequency of freezing rain in last decade for selected airports in North America and northern Eurasia.
Table 2. Frequency of freezing rain at selected stations of North America, Norway, and Russia. The second column shows the long-term mean value at each site, and the third column shows differences between the mean values for the last decade (2005–2014) and the previous 30 yr period (1975–2004).
| Station/Airport | Mean (d yr−1) | Difference (d yr−1) |
|---|---|---|
| Barrow, Alaska, USA | 3.2 | 1.4 |
| Montreal, Quebec, Canada | 3.3 | 1.8 |
| New York, JFK Intern. Airport | 1.7 | 0.27 |
| Washington, DC Area airports: | ||
| Dulles | 3.8 | −1.2 |
| Ronald Reagan | 2.0 | −0.43 |
| Baltimore | 2.7 | −0.57 |
| Atlanta, Georgia, USA | 1.3 | −0.63 |
| Oslo, Gardermoen, Norway | 2.5 | 0.93 |
| St. Petersburg, Russia | 0.14 | 0.26 |
| Moscow, Russia | 4.6 | 2.4 |
4. Discussion of research shortcomings
In the Arctic (north of 60 °N), the last decade stands apart from all previous years. Each year in this decade had higher near-surface air temperatures than the year of the record El Niňo, 1998 (figure 10). The observed difference between the Arctic temperature for the last decade and previous three decades is 1.5 °C. For the Northern Hemisphere, this difference is 0.6 °C, and nine of ten annual temperatures are above the former extreme value of 1998.
It is possible to use this peculiarity of the last decade for linking its global (or Arctic) temperatures, T, with other climate variables (see Wigley et al 1980). We did not do this for the frequency of occurrence of freezing rains because the occurrence of freezing precipitation always remains near 0 °C. The timing and location of these intervals can shift, though. However, regional averages and annual totals are not appropriate spatio-temporal scales for revealing such shifts. Thus, further studies are warranted to better document the dynamics of freezing events. Nevertheless, we found that on the southern edge of our study domain (southeastern US, southern Russia) the frequencies of freezing events decreased along with the duration of the cold season. In the Arctic (Norway, north of North America), they 'followed' the expansion of short warm season. However, in the rapidly warming Atlantic part of the Russian Arctic, our analysis does not reveal significant changes in freezing rain frequencies (figure 5(B), table 1).
We encountered several major homogeneity problems while analyzing long-term changes in specific PWC information about freezing events over each country. These include changes in observing and reporting practices and changes in instrumentation (i.e., automation). Special efforts to bypass/resolve these problems were made, but during this process several shortfalls were encountered.
First of all, we realized that long-term changes in freezing drizzle frequency over Canada, Norway, and the United States cannot be assessed beyond the pre-automation period. The reports of freezing drizzle frequency for the post-automation period are incomparable with the previous period. Given the changing nature of precipitation with global warming (see Trenberth 2011), we expected (and documented) significant changes (decreases) in the frequency of freezing drizzle over Russia (figure 6). Likewise, in Russia, automation has not yet been introduced and the 40 yr time series remain 'instrumentally' homogeneous. Freezing drizzle frequencies across the extratropics are larger than freezing rain frequencies, and in the high latitudes, the differences between them are the largest. The Arctic is a region with prominent climatic changes (see ACIA 2005, Walsh et al 2011; figure 10), and our inability to document freezing drizzle changes over half of the Arctic creates a large gap in our understanding of ongoing climatic changes.
Secondly, automation of synoptic observations and the introduction of METAR reporting codes made it difficult to document changes in intense freezing precipitation. This is particularly unfortunate given the damage that these events can cause (see Higuchi et al 2000). Therefore, further studies of the intense North American freezing precipitation are warranted. It should be done by bringing together the PWC information and the rain gauge data during all freezing events.
5. Conclusions
- In performing our study, we encountered several issues that impacted data homogeneity, including the automation of stations, the implementation of METAR, the relocation of stations, and the frequency of observations (i.e., hourly versus three-hourly data). As a result of changes in observing practice, we (at least, temporary) had to omit analyses of changes in freezing drizzle and intense freezing rain occurrences over the US, Canada, and Norway.
- We estimated the climatology of the frequency of freezing rain and drizzle occurrences for the US, Canada, Norway, and Russia using an archive of 874 long-term time series (40 years of data). The regions of high occurrence of freezing rain include the northeastern quadrant of the conterminous US, southeastern Canada, and the southwestern Great East European Plain. The frequency of freezing drizzle occurrence exceeds the frequency of freezing rain occurrence in all areas, especially in the high latitudes. There are large parts of the extratropics (e.g., Siberia, southwestern United States) where freezing events are extremely rare (less than 1 per decade).
- We estimated changes in the occurrence of freezing precipitation events by comparing the past decade (2005–2014) to the previous 30 year period. Increases in the frequency of freezing rain events were apparent over Norway and over a sizable part of northwestern Russia. Changes in the frequency of freezing rain events were also substantial over the North American Arctic (increase) and over the southernmost parts of North America and Russia (decrease). However, the pattern of changes was mixed in mid-latitude North America.
- There were substantial biases in the climatology and change estimates of freezing precipitation events based upon the 3-hourly observation routines (see section
A.4 ). - Changes in the occurrence of freezing drizzle were estimated only for Russia. We found that the comparison of the past decade with the previous 30 yr long period as well as the trend analyses revealed a statistically significant nationwide decrease in this element.
This is the first systematic climatological assessment of the frequency of freezing precipitation events over most of the extratopics of the Northern Hemisphere and their changes in the past decade (see Shakina et al 2012). We presented and analyzed only the annual summation of these frequencies. Analyses of the intra-seasonal occurrence of freezing precipitation events and estimating of shifts in regionally-averaged dates of first and last freezing events during the cold and shoulder seasons would be essential follow-up analyses but they are beyond the scope of this paper.
The results presented in this manuscript are the part of the research within the GEWEX Cross-cut Project on 'Near 0 °C Precipitation' (Groisman and Stewart 2014, Groisman et al 2015) and The Northern Eurasia Earth Science Partnership Initiative (NEESPI; http://neespi.org).
Acknowledgments
This study was supported by the NASA LCLUC Program, by the NOAA National Centers for Environmental Information, by the Ministry of Education and Science of the Russian Federation (grant 14.B25.31.0026), as well as by the International Project 'ARCTIC-ERA (ARCTIC climate change and its impact on Environment, infrastructures and Resource Availability)' supported in Russia by the Russian Foundation for Basic Research and in the United States by the National Science Foundation Polar Research Program (Arctic Research Projects).
Appendix A.: Freezing precipitation data preprocessing and homogeneity issues
There are four general issues that potentially impact the homogeneity of the data. These include the automation of stations, the implementation of METAR, the relocation of stations, and the frequency of observations (i.e., hourly versus three-hourly data).
A1. Automation of stations
Canada initiated the automation of many stations in the 1990s. A similar and more dramatic automation occurred at the same time in the United States (i.e., the deployment of the Automated Surface Observing System, ASOS). Automation was also introduced at the Norwegian meteorological network in the early 1990s and the Russian Hydrometeorological Service is on the brink of introduction new automation observing systems at its network. Automation did not impact the homogeneity of freezing rain reports because special efforts were made to secure the homogeneity of past (visual) and new observations (Starr and van Cauwenberghe 1991, NOAA 1998, Ramsay 2002, WMO 2006). However, automation did involve a new coding system for PWCs, which resulted in a reduction in the reporting of drizzle (and freezing drizzle) compared to the previous period (see figure A1).

Figure A1. Top. Average number of days with freezing drizzle reported by the US and Canadian stations (shown in figure 1(a)). Bottom. Average number of days with freezing drizzle (blue dots) and freezing rain (red dots) for the United States only.
Download figure:
Standard image High-resolution imageA threefold decrease in the number of the days with freezing drizzle around 1996 is caused by automation of observing networks in these two countries, a near simultaneous switch to the METAR coding (see section A2), and gradual retirement of skilled meteorological observers who used to re-check the automated reports and append them with manual entries when needed.
In the case of ASOS, the precipitation indicator (PI) may miss light drizzle and, when the ASOS freezing rain sensor (FRS) reports ice accretion on its probe (i.e., a light freezing event), the ASOS PWC is set to 'no precipitation' (NOAA 1998). Another reason for the artificial decline of PWC drizzle reports after automation is a general reduction of positions allocated for Present Weather. Manual reports in the ISD data set allowed for up to 6 PWCs per observation (WMO 2004) while with automation the number of PWCs was reduced to a single PWC per precipitation observation, which could be generally used for other, more pressing weather events. We conclude that in North America and Norway we cannot expand drizzle climatologies after the automation dates (Ramsay 2002). In the mid-latitudes, this mishap may not be so important compared to the high latitudes. In the high latitudes, very light precipitation (aka drizzle) events are frequent and the loss of our ability to document (update) the frequency of drizzle occurrence created a substantial deficiency in the water budget assessments in the Arctic beyond the Russian boundaries. In North America during the pre-automated period, this deficiency was exacerbated by a low precision of gauge precipitation measurements. The lowest non-zero gauge measurements here are 0.24 mm in Alaska and 0.2 mm in Canada versus 0.05 mm in Norway and Russia that lead to disproportionally frequent reports of trace precipitation in the North American Arctic (up to 80% of rainy days versus 20%–30% in the Russian Arctic). When the gauge is reporting 'trace', the observer is more inclined to report some of light rain events as drizzle.
The above indicates that we cannot assess the freezing drizzle changes for the entire period of observations (1975–2014) over most of North America and Norway.
A2. METAR
The METAR weather reporting format was introduced in 1968 internationally and has been modified thereafter a number of times. Canada and the United States continued to use national Surface Aviation Observation codes for current weather conditions until summer 1996, when this report format was replaced with an approved variant of METAR. After implementation of METAR at automated stations (e.g., ASOS in the US), some 'secondary' meteorological characteristics became unexpectedly more/less frequent. For example, intense freezing rain reports in the United States became seven times more frequent; figure A2.
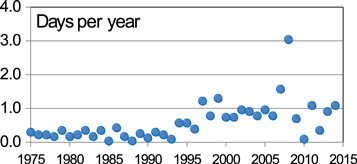
Figure A2. Region-wide mean changes in the frequency of moderate and heavy freezing rain events (d yr−1) that followed the introduction of METAR reporting formats in August 1996 over Northeastern US (east of 80 °W and north of 40 °N).
Download figure:
Standard image High-resolution imageBelow is a possible explanation of causes for these differences. Mixed precipitation can come as wet snow that affects the freezing rainfall sensor (FRS) similarly to freezing rain/drizzle. In these situations, if the precipitation indicator (PI) in ASOS reports snow, the algorithm reports PWC as snow without any freezing. According to NOAA (1998), when surface air temperatures are close to 0 °C, the PI may infrequently be blurred enough to report unknown precipitation or rainfall that, in the presence of the freezing reported by FRS, assigns the PWC as a freezing rain report. This is a small fraction of PI mishaps. However, because the wet snow and/or sleet can be quite intense, they can cause a dramatic increase in the frequency of heavy and/or moderate freezing rain event reports (that otherwise compose less than 10% of all freezing events).
The above indicate that we cannot analyze separately the long-term changes in intense/moderate freezing rainfall events over North America and Norway and are restricted only to assessments of changes in their total occurrence.
A3. Relocations
Station relocations occur from time to time at many reporting sites. However, the documentation of such changes varies from country to country. In the United States and the former USSR (as well as in Russia), relocations were documented, but station identifiers (IDs) remained the same. In Canada and Norway, most relocations (as well as other changes in observing practice) were accompanied by changes in IDs. As a result, a straightforward attempt to select long-term stations in these two countries was problematic. For example, among 405 Norwegian synoptic stations available in ISD, we found only 11 stations that had synoptic observations prior to 1975, that continued up to 2014, and that met our hourly data completeness requirements. Therefore, we created composite stations to avoid the data paucity problem in Norway and Canada due to site relocations. Specifically, for each long-term station in our ISD-list, we identified synoptic stations within a 10 km radius. Of the 136 long-term Norwegian stations, 31 had neighboring stations where synoptic observations were conducted for some period. Among 169 long-term Canadian stations, 155 had neighboring sites with synoptic observations. Thereafter, we replaced (appended) the missing values in the major baseline long-term station reports by synoptic observations from the neighboring sites. For Canada, this approach allowed us to increase the number of sites with 'sufficient' data from 48 to 71. For Norway, the use of composite stations did not add additional stations to our hourly (11 stations) and 3-hourly (25 stations) synoptic data sets but allowed us to better infill them.
We duplicated our analyses and conclusions based upon the original only and all original and composite stations' data sets. The results for both the climatologies and large-scale spatial and temporal changes were comparable, so we only present results based on composite stations.
A4. Frequency
Three-hour time step versus hourly data. Since 1966 in Russia, observations at the first order meteorological network have been made every three hours, while hourly observations are made in Canada, the United States, and some stations in Norway. If the freezing event duration is short enough (i.e., less than 3 h), it could be missed by the observer, and thus the freezing events climatology could be biased. To estimate the bias in the Russian stations (and to account for it), we used the Russian archive of Weather Phenomena with dates of 'gololed' occurrence, duration, and intensity. For each Russian station at each day with gololed, we calculated the total daily duration of these phenomena and counted the number of 3 h synoptic reports with their occurrence. Annual ratios, R, of gololed duration (in hours) to the number of 3 h reports of its presence cannot be higher than 3. At a sizable fraction of stations this ratio is close to 3, which means that for these stations three-hour reports have enough information about freezing on the ground. However, for 9% of the station-years with a non-zero number of freezing events, this ratio is ≤0.5, and at another 35% and 25% of station-years these ratios are in the range of 0.5–1.0 and 1.0–2.0, respectively (figure A3).

Figure A3. Annual number of hours with gololed when at least one freezing event was observed during the year sorted by R, ratio of the number of these hours to the number of 3 h. reports of freezing events over Russia. Archive of Atmospheric Phenomena for 444 Russian stations for the 1977–2011 period was used for this composite plot (http://meteo.ru/data).
Download figure:
Standard image High-resolution imageWe addressed this bias by using the following formula to estimate the true annual number of freezing events, NFE:
where R is in hours. We assume that if R is less 0.5 (i.e., 30 min that is an average time when observer attends meteorological site and always sees freezing events), the probability for him to notice an event is equal to 1/6. Thus, the scaling factor for NFE varies in the range from 1 (long freezing events 3 h or more prevail) to 6 (short freezing events of 30 min or less).
For Norway, about two thirds of the synoptic stations in our archive have only 3-hourly data, but there is no comparable archive of gololed. For consistency, we reduced the remaining third (11 stations) from 1 to 3 h reports. As a cross-check, we compared our 1 and 3 h long-term freezing event counts for these stations (table A1). Short-term freezing events in the 3 h data are underestimated by a factor of 1.7 to 2.5, which is close to the application of the R values of 1.2 to 1.75 in equation (A1) (note that for the entire Russia, the mean R value is equal to 1.6).
Table A1. Comparison of the mean annual frequency of the freezing rain events reported at 10 Norwegian stations by hourly and 3-hourly reports grouped into three regions: Southwest Maritime (SM; south of 63 °N and west of 8.2 °E), Eastern half of Southern Norway (SE), and the Arctic north of the Arctic Circle (A).
| Latitude, longitude, station | Hourly reports (days per year) | Subsampled 3-hourly reports (days per year) | Ratio |
|---|---|---|---|
| Southwest Maritime (SM); average | 2.46 | ||
| (60.3 °N, 5.2 °E); Flesland | 0.88 | 0.25 | 3.52 |
| (58.9 °N; 5.6 °E); Sola | 0.55 | 0.25 | 2.20 |
| (58.2 °N, 8.1 °E); Kjevik | 2.10 | 1.27 | 1.65 |
| Southeastern Norway (SE); average | 1.70 | ||
| (59.4 °N, 10.8 °E); Rygge | 1.75 | 0.95 | 1.84 |
| (60.2 °N, 11.1 °E); Gardermoen | 2.50 | 1.52 | 1.64 |
| (63.5 °N, 10.9 °E); Værnes | 1.88 | 1.12 | 1.68 |
| (63.7 °N, 9.6 °E); Orland | 0.98 | 0.60 | 1.63 |
| North of the Arctic Circle (A); average | 1.77 | ||
| (67.3 °N °N, 14.4 °E); Bodø | 1.27 | 0.85 | 1.49 |
| (69.1 °N, 18.5 °E); Bardufoss | 3.22 | 2.00 | 1.61 |
| (69.3 °N, 16.1 °E); Andøya | 0.20 | 0.10 | 2.00 |
| (69.7 °N, 18.9 °E); Tromsø | 2.95 | 1.50 | 1.97 |
For North America, all synoptic stations used in our analyses have hourly or better temporal resolution and we do not need to evaluate these ratios for our climatology and change analyses. However, we did the similar analysis as for Norwegian hourly station data just to check how much freezing rain information would be lost, if we were restricted to 3 h data. We found that over most of the United States the ratios are close to 1.7 and only in the regions with very infrequent freezing events (southernmost and dry northcentral regions of the conterminous United States), we observe significant loss of information about freezing rain events in 3 h data. Table A2 provides a few examples of these ratios estimated for the 1975–2014 period.
Table A2. Mean annual frequency of the freezing rain delivered at representative subset of US stations by hourly reports for the 1975–2014 period and the scale factor that would be required to receive these estimates from 3-hourly observations.
| Latitude, longitude; station | State | Hourly reports (days per year) | Ratio |
|---|---|---|---|
| (42.0 °N, 87.9 °W); Chicago, O'Hara | Illinois | 4.05 | 1.83 |
| (42.3 °N, 83.3 °W); Detroit | Michigan | 3.45 | 1.56 |
| (46.8 °N, 100.8 °W); Bismarck | North Dakota | 2.80 | 1.69 |
| (39.2 °N, 76.7 °W); Baltimore | Maryland | 2.72 | 1.42 |
| (33.7 °N, 101.8 °W); Lubbock | Texas | 2.40 | 1.70 |
| (42.4 °N, 71.0 °W); Boston | Massachusetts | 2.03 | 1.69 |
| (40.6 °N, 73.8 °W); New York, JFK | New York | 1.70 | 1.88 |
| (43.6 °N, 116.2 °W); Boise | Idaho | 1.38 | 1.53 |
| (33.6 °N, 84.4 °W); Atlanta | Georgia | 1.27 | 1.34 |
| (41.2 °N, 104.8 °W); Cheyenne | Wyoming | 1.00 | 2.09 |
| (64.8 °N, 147.9 °W); Fairbanks | Alaska | 0.82 | 1.75 |
| (47.4 °N, 122.3 °W); Seattle | Washington | 0.52 | 1.74 |
| (39.5 °N, 119.8 °W); Reno | Nevada | 0.22 | 2.75 |
| (35.0 °N, 106.6 °W); Albuquerque | New Mexico | 0.10 | 2.00 |
A5. Various estimates of change in annual frequency of freezing precipitation events
We use three statistics for estimation of changes in regional time series of annual frequency of freezing precipitation events. We used t-statistics to test the H0-hypothesis that the mean values of two samples X1 and X2 are the same (t-test; Kendall et al 1977). Here X1 and X2 are the regional time series for two periods (e.g., for 1975–2004 and 2005–2014). When a two-tail t-test rejected H0, we assumed that there is a change between X1 and X2. Additionally, we used two tests for monotonic trend. One of them, L-test, is based on linear regression. We test for statistical significance of the non-zero slope coefficient of linear trends of the 40 year long regional time series. The second test is a non-parametric test based on the Spearman's rank correlation coefficient, Rs, of the same time series (Kendall 1975). The Rs-test is working independently of the time series distribution and the form of the trend. While regional averaging effectively suppresses all deviations from the Normal distribution of resulting time series, the nonlinearity of changes (see figure 8) could be a problem for the L-test and requires special attention.
In our studies of change in annual frequency freezing events, we selected the last decade as the most important (practically) period that (a) is long enough to suppress to some extent the interannual variability (b) allows us to compare this period with previous 30 yr long period that could be conventionally considered as 'recent past', and (c) this last decade was the warmest decade for the period of instrumental observations in the past two centuries. This last 'argument' was elaborated further in the discussion section.
There is a reasonable question: 'The authors have 40 years of data. Why not to use a more even partition of this period, for example, to compare the first 20 years and the last 20 years?' It can be expected that the specifics of the shortest period used in the intercomparison (i.e., 2005–2014) will be better suppressed and the results (at least, for regional time series) will be more evident. We conducted this intercomparison for all our regional time series as well as for each station (figure A4). When we compared the first and the last 20 years of annual freezing rain and drizzle average frequencies using t-test, there were no new reports of statistically significant change in the regional time series listed in table 1. In one case, for North America north of the Arctic Circle (figure 8), the t-test shows insignificant differences between two 20 year long periods. The site by site intercomparison is shown in figure A4. The left column in this figure represents the copies of figures 5(A) and (B) with differences of mean annual freezing rain occurrence between 2005–2014 and 1975–2004 and a separate insert for Norway. The right column in the figure shows the same differences but between the 1995–2014 and 1975–1994 periods. The patterns of these differences are quite similar and for Northern Eurasia are undistinguished. For North America, particularly in the Northeastern and Midwestern United States, there are visibly more light blue dots (anomalies from −1 to −0.1) in the right column instead of beige dots (anomalies from 0.1 to 1) in the left column. However, these differences in the pattern are not converted into statistically significant changes. For example, for North America, between 36 °N and 50 °N east of 95 °W, we have in table 1 an anomaly equal to −0.05. In the comparison of two 20 year long periods, this anomaly changes its sign and becomes −0.21 but both of them are statistically insignificant.

Figure A4. Estimates of differences of mean annual freezing rain occurrence between (left) 2005–2014 and 1975–2004 and (right) 1995–2014 and 1975–1994 periods.
Download figure:
Standard image High-resolution image