


Abstract
Networks of tree-ring data are commonly applied in statistical reconstruction of spatial fields of climate variables. The importance of elevation to the climatic interpretation of tree-ring networks is addressed using 281 station precipitation records, and a network of 79 tree-ring chronologies from different species and a range of elevations in the eastern Mediterranean. Cluster analysis of chronologies identifies 6 tree-ring groups, delineated principally by site elevation. Correlation analysis suggests several of the clusters are linked to homogenous elevational moisture regimes. Results imply that climate stations close to the elevations of the tree-ring sites are essential for assessing the seasonal climatic signal in tree-ring chronologies from this region. A broader implication is that the elevations of stations contributing to gridded climate networks should be considered in the design and interpretation of field reconstructions of climate from tree rings. Finally, results suggest elevation-stratified tree-ring networks as a strategy for seasonal climate reconstruction.
Export citation and abstract BibTeX RIS
1. Introduction
The eastern Mediterranean (EM) region is influenced by climate mechanisms with global significance, including the El Niño Southern Oscillation (Ribera et al 2000), North Atlantic Oscillation (Mariotti et al 2002), East Atlantic Jet (Touchan et al 2005), South Asian Monsoon in summer (Raicich et al 2003) and Siberian High in winter (Xoplaki et al 2001). The main physical and geographical factors controlling the spatial distribution of climate over the Mediterranean are atmospheric circulation, latitude, elevation, orography, and land-sea interactions (Lolis et al 1999, Xoplaki et al 2004). Mediterranean climate is further influenced by the almost enclosed Mediterranean Sea itself (e.g. Trigo et al 1999, Mariotti et al 2002). The Mediterranean Sea is an important source of energy and moisture for cyclone development, and the complex land topography within the basin plays a crucial role in steering air flow and storm tracks (e.g. Trigo et al 1999).
Tree rings have been widely used for assessing long-term climate variability in the EM, mainly through reconstruction of precipitation (e.g. Touchan et al 1999, Hughes et al 2001, D'Arrigo and Cullen 2001, Touchan et al 2005, Griggs et al 2007, Akkemik et al 2008, Köse et al 2011). Elevation complicates precipitation reconstruction because the tree-growth response to climate variables can vary with elevation (e.g., Fritts et al 1965, LaMarche 1974, Salzer et al 2014). Complex topography and the influence of the sea on atmospheric moisture, stability, and the development and movement of storms further complicate the response.
Recent studies (Griggs et al 2013 and Touchan et al 2014a, 2014b) have addressed the importance of elevation to the relationship between tree rings and climate in the EM. Griggs et al (2013) reported that low-elevation Pinus brutia chronologies in Cyprus had high positive correlation with winter precipitation, while high-elevation chronologies of the same species had strongest correlation with precipitation in the growing season and the preceding fall. Touchan et al (2014b) found a similar elevation-dependence in precipitation signal using three tree species on Cyprus, and further reported pivotal importance of climatic data selected for the assessment: a May-July precipitation signal characteristic of higher-elevation trees was strong with station precipitation, but almost nonexistent with gridded (CRU TS 2.1; Mitchell and Jones 2005) precipitation. This difference was hypothesized to stem from the inability of the gridded data to represent the higher-elevation precipitation climate of Cyprus. Even with gridded climate data, however, some hint of elevation dependence in precipitation signal in tree growth can be seen over the broader region of the EM (Touchan et al 2014a).
Here we present the first large-scale analysis using station climate records to quantify elevation dependence in the precipitation signal in EM tree rings. Understanding of such dependence is critical to the proper design of climate reconstruction models. We apply cluster analysis to a network of 79 tree-ring chronologies, and link those clusters with monthly precipitation at 281 precipitation stations.
Principal component analysis (PCA) and correlation analysis are used to associate the tree-ring clusters with monthly station precipitation and identify elevation-related patterns of precipitation response. Elevations of both the tree-ring sites and the climate stations are considered in the analysis. The main questions addressed are the importance of elevation to the discrimination of a large multi-species network of tree-ring chronologies in the EM, and the implications for design of statistical models to reconstruct fields of climate variables from tree rings.
2. Data and methods
2.1. Tree-ring data and chronology development
The chronologies for this study represent multiple tree species and a range of elevations in a region bounded by 33°–42°N and 21°–43°E. The tree-ring network consists of 79 chronologies from Turkey, Syria, Lebanon, Cyprus, and Greece developed over the period 2000–2011 and ranging in elevation from 350 m to 2400 m above sea level (figure 1(A)). Species represented are Cedrus libani, Cedrus brevifolia, Juniperus excelsa, Pinus brutia, Pinus nigra, Pinus sylvestris, Pinus heldreichii, Pinus pinea, Abies cephalonica, and Abies cilicica. The tree-ring network consists of the same 79 chronologies used and described in Touchan et al (2014a), where detailed information can be found on sampling technique, sample preparation, dating, and chronology development. The expressed population statistic, or EPS (Wigley et al 1984, Cook and Kairiukstis 1990), was used to identify the period over which chronologies are well-enough replicated to capture the unknown common population tree-ring signal at a site. For all 79 chronologies, EPS exceeds the suggested minimum threshold of 0.85 for the 1919–2000 analysis period in this paper.
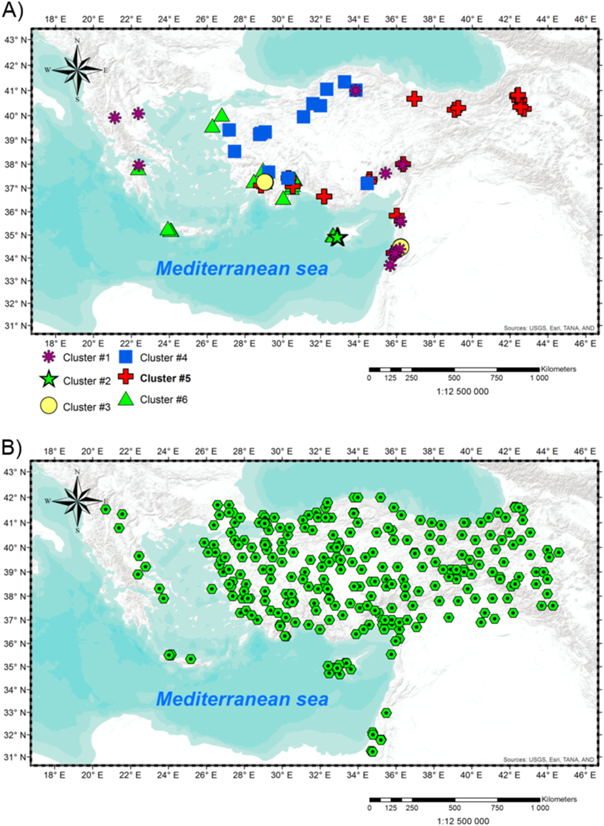
Figure 1. Maps are showing data locations and tree-ring cluster assignments. (A) Geographical distribution of the 79 eastern Mediterranean tree-ring sites coded by cluster. (B) Locations of the 281 climatic stations used in correlation analysis.
Download figure:
Standard image High-resolution image2.2. Climatic data
Monthly precipitation records for 281 climate stations were assembled to investigate the relationship between the climate data and the 79 tree-ring chronologies. Data for 241 stations in Turkey were obtained in the form of monthly averages or totals from the Turkish General Directorate of Meteorology. The records used span at least nine years, and no more than 20% of the monthly values are missing in any record. Seventy-five-percent of the 241 records start in 1961, 68% end in 1990, and the earliest (Istanbul) begins in 1880.
An additional set of daily climate records for 40 stations was obtained from the NOAA National Climatic Data Center (www.ncdc.noaa.gov/cdo-web/). Nine, 6, 2, 4, 2, 7 and 10 of these stations are in Cyprus, Greece, Macedonia, Crete, Syria, Israel and Turkey, respectively. We aggregated these daily data to monthly time series for use in this study. Locations for the complete set of 281 climate records used are mapped in figure 1(B).
2.3. Cluster Analysis9 and Principal Components Analysis
K-means cluster analysis (Webb 1999, Martinez and Martinez 2005) was used to organize the 79 tree-ring chronologies for their 82-year common period 1919–2000 into groups, or clusters, such that chronologies within a cluster are more similar to each other than they are to chronologies in another cluster. This analysis treated each chronology, an 82-element vector, as a separate object.
The optimal number of clusters was identified and the quality of the clusters measured using K-means clustering and linear-forward stepwise discriminant analysis (McLachlan 2004). For each number of clusters K = 1, 2,..., Wilk's lamda (Mardia et al 1979; see SM) was computed to measure the separation, or quality, of the clusters. Wilk's lambda, the ratio of within-group sum of squares to total sum of squares, can assume values in the range of 0 (perfect discrimination) to 1 (no discrimination). Following Shishov and Vaganov (2010), a plot of Wilk's lambda against K was used to select the final number of clusters. A schematic of the main steps in the classification analysis (Webb 1999) is shown in the SM (figure S1).
Principal components analysis (PCA; Cook and Kairiukstis 1990) was run on the chronologies in each identified cluster (1919–2000 period) to derive time series representing the common mode of tree growth in the cluster. The first principal component, PC1, by definition accounts for the highest percentage of common variance in the chronologies and most likely summarizes the climate signal. The scores of PC1 for individual clusters were accordingly used as time series for the correlation analysis described next.
2.4. Correlation analysis
To measure the strength of relationship of clusters with monthly station precipitation, Pearson correlations were computed between scores (time series) of PC1 of chronologies in each cluster and monthly precipitation at each of the 281 climate stations. The correlation analysis was restricted to the 15 months from October of the year preceding growth through December of the growth year of the trees. A total of 4215 (281 stations × 15 months) correlations were computed for each cluster. The p-values of those correlations significantly (p ≤ 0.05) different from zero were plotted against elevation of climate station, and the resulting scatterplots were smoothed by a distance-weighted least-squares procedure (McLain 1974, Briffa et al 2008; see SM) to summarize the dependence of strength of correlation on elevation.
The p-value of correlation rather than the correlation itself was used in the correlation plots because of the variable length and time coverage of the 281 station precipitation records. Assuming the sample correlation follows a Student's-t distribution, Pearson's correlation coefficient r can be considered as a function of sample size n and p-value (Cohen et al 2003); accordingly, the p-value can be compute from n and a Student's-t transformation of r. A lower p-value in this context means higher significance of correlation, and the same correlation receives greater weighting for higher n, or greater overlap of PC1 with precipitation series.
3. Results and discussion
Cluster analysis indicated that the 79 chronologies can be grouped optimally into the K = 6 clusters mapped in geographical space in figure 1(A). A further increase in the number of clusters K failed to yield a significant decrease in Wilk's lambda (figure S2). The six clusters cover a broad range of latitude and longitude, but are not systematically organized over contiguous parts of the EM (figure 1(A)).
As exemplified by tree-ring sites from the island of Cyprus, clusters are clearly not dictated by proximity of sites on the horizontal plane: sites on Cyprus separated by just 3–28 km are assigned to either cluster #2 or cluster #6 (figure 1(A)). A contrast in the Cyprus chronologies entering these different clusters is elevation. This contrast can be summarized by a 'cluster elevation', defined here as the mean elevation of chronologies in the cluster. The elevation of cluster #2 is almost 600 m higher than that of cluster #6, and these elevations differ significantly, as indicated by the separation of 95% confidence intervals (table 1, figure S3). On the other hand, elevations of some clusters do overlap, and some cluster elevations have extremely wide confidence intervals. The small number of chronologies in some clusters (e.g., 4 chronologies in cluster #3) contributes to the uncertainty in cluster elevation.
Table 1. Species makeup and statistics of tree-ring clusters.
| Cluster | t(0.05, n-1) | Cluster elevation (m) ± t(p = 0.05, n-1)*S.E. (m)a | Speciesb | No. of Chronologies | NTc Zd |
|---|---|---|---|---|---|
| 1 | 2.131 | 1686 ± 100 | PINI, CDLI, ABCI, PIHE | 16 | 491 1820 m |
| 2 | 2.571 | 1758 ± 211 | PINI, PIBR, CDLI, ABCI | 6 | 138 1805M* |
| 3 | 3.183 | 1520 ± 442 | CDLI, ABCI | 4 | 94 1885M* |
| 4 | 2.145 | 1427 ± 131 | PINI | 15 | 326 1660M |
| 5 | 2.101 | 1820 ± 254 | PISY, PINI, JUEX, PIPI, PIBR, CDLI | 19 | 412 1820M* |
| 6 | 2.101 | 1175 ± 206 | JUEX, CDLI, CDBR, PIBR, PINI, ABCE | 19 | 458 1210M* |
aCluster elevation, defined as the 95%-significance interval of tree-ring sites elevations in cluster. bPINI—Pinus nigra; CDLI—Cedrus libani; ABCI—Abies cilicica; PIHE—Pinus heldreichii; PIBR—Pinus brutia; PISY—Pinus sylvestris; JUEX—Juniperus excelsa; PIPI—Pinus penea; CEBR—Cedrus brevifolia; ABCE—Abies cephalonica. cNumber of trees summed over sites in the cluster. dElevation (m) of minimum of smoothed p-value plot (e.g., figure 2); M = global minimum, m = secondary minimum; asterisk marks minimum within the two standard errors of cluster.
Some clusters contain sites widely separated geographically. For example, cluster #6 has sites from Cyprus, Crete, the west coast of Turkey, and the southeastern coast of Greece (figure 1(A)). Cluster #4 similarly has a broad spatial extent, with sites from the coast of the Black Sea to the coast of the Mediterranean. Elevational dependence is also evident in these clusters (table 1). Cluster elevations for the six identified clusters differ by 70–100 meters. While confidence intervals around the average elevations of some clusters overlap (figure S3 and table S2), a one-way analysis of variance (ANOVA) test indicates that the null hypothesis of equal cluster elevations must be rejected (F(5, 73) = 7.01, p < 0.000 03). Species is expected to influence cluster membership (e.g., through similarities in phenology and climate sensitivity), but our clusters generally include multiple species (table 1).
The first principal component (PC1) of chronologies in each cluster explains between 33% and 76% of the variance of tree-ring chronologies in the cluster (table S1). The correlation of PC1 with station monthly precipitation for four of the six clusters tends to be strongest (lowest p-value) at station elevations near the cluster elevation (last column of table 1). For example, the minima in the smoothed scatterplots of p-values against elevation for clusters #2 and #6, at cluster elevations 1758 m and 1175 m, are reached at elevations of 1805 m and 1210 m, respectively. The minima in p-values for these two clusters fall within one standard error of the cluster elevation (table 1).
The p-value plots for clusters #2 and #6 are based on the 180 and 200 significant (p < 0.05) correlations, respectively, of 4215 computed correlations (15 months × 281 stations). Some influence of 'false positives' could be expected with this approach, as the large number of trials includes months for which little relationship is expected on physical grounds (e.g., after the end of the typical summer growing season). A Bonferroni adjustment (Snedecor and Cochrane 1989) of significance levels would, however, be counterproductive in raising the likelihood of false negatives and possibly obscuring real relationships. For that reason we have not adjusted the significance levels to account for running of multiple tests.
Moreover, the dominating months of significant correlation, annotated in figure 2, are consistent with earlier studies of climate influence on tree-growth in the EM. The lower-elevation cluster (#6) has proportionally greater representation than the higher-elevation cluster (#2) from months from the fall and winter preceding the growth year. This observation, illustrated by histograms in figure S8, is consistent with previously reported findings of season-specific climate signals at low and high elevations in Pinus spp. tree-ring data from Cyprus (Griggs et al 2007, Touchan et al 2014b).
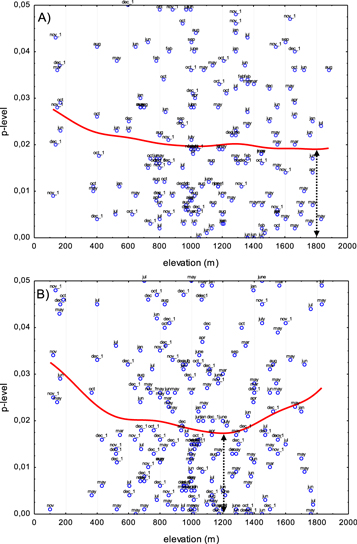
Figure 2. Strength of correlation of cluster tree-ring growth with monthly station precipitation as function of station elevation for tree-ring clusters #2 and #6. Each plotted point represents the p-value of correlation of PC1 of the tree-ring chronologies in the cluster with monthly precipitation at a climate station for the full overlap (excluding missing values) of time series of PC1 and precipitation. The red curve is a distance-weighted least squares smoothing of the scatterplot. Points are labeled by month, with '_1' indicating month prior to growth year. Global peak significance (lowest smoothed p-value, indicated dark arrow) of correlation occurs close to the average elevation of the tree-ring chronologies in the cluster: 1758 m for Cluster 2 (A) and 1175 m for Cluster 6 (see table 1).
Download figure:
Standard image High-resolution imageAnalogous p-value plots for the other 4 clusters are shown in the SM (figures S4–S7). While the minimum p-value for the highest-elevation cluster (#5) does fall close to that cluster's elevation of 1820 m, minima for two of the other clusters are not within 2 standard errors of the corresponding cluster elevations (table 1). The minimum for cluster #3 does fall within the confidence interval around the cluster elevation, which, however, is extremely uncertain (±442 m).
Results from the precipitation analysis suggest that tree-growth in at least some of the clusters is driven by a moisture regime associated with the cluster elevation. The idea of elevation-layered dendroclimatic signal is sketched in figures 3(A) and (B). The chaotic pattern in figure 3(B) is shows that the individual clusters representing a cluster elevation are spread over a wide geographical region. Elevation-dependence in tree-ring signal for precipitation could be explained by a combination of climatic and tree-growth factors. A high-mountain regime of precipitation anomalies associated with orographic effects could, for example, extend across the EM, such that trees in widely separate mountains experience similar moisture regimes and growth anomalies in a particular season. For low-elevation cluster #6, in particular, such a widespread coherence could be favored by proximity to the sea and the lack of large intervening land masses (figure 1(A)). The tendency for tree-ring coherency between regions could be amplified by phenology, with a longer growing season at low elevations, for example, favoring response to winter moisture due to a longer growing season for trees. Sensitivity of tree-growth to cool-season moisture variations at low-elevation sites would also be favored by the generally greater aridity at low elevations.

Figure 3. Schematic of tree-ring cluster relationship with elevation. (A) Clusters ordered left to right by cluster elevation. (B) Clusters mapped in geographical space (latitude-longitude), over the EM. Height of triangle corresponds to cluster elevation; width of base corresponds to number of chronologies in cluster; colored layers represent dry/warm (yellow) to cool/wet (grey) environment. To avoid clutter in B, coastlines, country boundaries, etc, are omitted.
Download figure:
Standard image High-resolution image
4. Summary and conclusions
This study is the first attempt to decipher possible elevation dependence in the large-scale dendroclimatic signal in the EM using station climate records. Such analysis would not be possible with gridded climate data, as interpolation from station to grid would mask differences in regional climate related to elevation.
For the EM, the cluster and correlation analyses indicate that a 79-site tree-ring network can be separated into 6 clusters of common growth variation related to elevation. Each of the six clusters has an elevation significantly distinguishable from that of the other clusters according to an ANOVA. Relationships of tree-growth in each cluster with station precipitation were summarized with correlation analysis by a smoothed plot of p-value of correlation against station elevation. Such plots support an elevation-related climate response in the common tree-growth variations in half of the clusters. Whether such a response exists in other regions depends on many factors, including climate, topography and quality of the tree-ring data, but would be especially interesting to investigate in other areas of high topographic relief, such as north Africa.
To explain our results, we postulate 'elevation layers' of tree-ring response to moisture regimes in the EM. These layers may represent preferred modes of climate variation (e.g., high-mountain climates) that similarly impact widely spaced mountainous regions. The layers likely also reflect species-dependent tree-growth filtering of the monthly climate signal—species that grow in a specific elevation tending to respond most to climate variations in a particular season. Results suggest elevation-stratified networks of tree-ring chronologies as a possible strategy for seasonal climate reconstruction in the EM. For example, in investigating the spatial extent of winter NAO influence, a network of low-elevation tree-ring sites in the EM would be most useful. While the long history of occupation and the removal of natural forests at low elevations in this region is an obstacle, such a network should be pursued using a combination of living trees and archaeological wood samples.
The results have general implications for dendroclimatic field reconstructions, which commonly rely on gridded climate networks. Field-reconstruction design in the EM and possibly elsewhere should include careful consideration of elevation both of the tree-ring chronologies and of the climate stations contributing to the gridded climate data. Caution should be exercised in use of interpolated gridded precipitation networks in reconstruction studies aimed at characterizing regional climate variability where topography is heterogeneous.
Acknowledgments
The authors wish to thank the Forestry Departments in Turkey, Greece, Cyprus, Lebanon, and Syria for their great help and support in making this study possible. We would like to thank the Cyprus Meteorological Service for providing us with climate data. We thank Professor Alexandros P Dimitrakopoulos, of the Laboratory of Forest Protection, School of Forestry and Natural Environment, Aristotle University of Thessaloniki, Greece, for his help and support. We thank Christopher Baisan, Russell Biggs, and Gurudas C Bock for their valuable assistance in the field. We also thank Russell Biggs, Victoria L Frazier, Alicia Stout, Gurudas C Bock, Jessica L Little, and Anthony P Trujillo for their assistance in sample preparation and measurement. We wish to thank the anonymous reviewers for their constructive comments and suggestions on the manuscript. Funding was provided by the US National Science Foundation under Grant Earth System History (Grant No. 0075956), ATM-GEO/ATM-Paleoclimate Program 0758486, and Paleo Perspectives on Climate Change (Award No. 1103314). V. Shishov (software development and data analysis) was supported by the Russian Science Foundation (Grant # 14-14-00219). The tree-ring data will be available at the International Tree-Ring Data Bank (ITRDB) web site (https://www.ncdc.noaa.gov/paleo/study/19016).
Footnotes
- 9
Detailed information is available on the cluster analysis method in the supplementary material (SM), available at stacks.iop.org/ERL/11/044020/media.