

Abstract
Satellites provide the only practical source of data for estimating biomass of large and remote areas such as the Alaskan Arctic. Researchers have found that the normalized difference vegetation index (NDVI) correlates well with biomass sampled on the ground. However, errors in NDVI and biomass estimates due to bidirectional reflectance distribution function (BRDF) effects are not well reported in the literature. Sun-sensor-object geometries and sensor band-width affect the BRDF, and formulas relating NDVI to ground-sampled biomass vary between projects. We examined the effects of these different variables on five studies that estimated above-ground tundra biomass of two common arctic vegetation types that dominate the Alaska tundra, moist acidic tussock tundra (MAT) and moist non-acidic tundra (MNT). We found that biomass estimates were up to 33% (excluding extremes) more sensitive than NDVI to BRDF effects. Variation between the sensors resulted in differences in NDVI of under 3% over all viewing geometries, and wider bands were more stable in their biomass estimates than narrow bands. MAT was more sensitive than MNT to BRDF effects due to irregularities in surface reflectance created by the tussocks. Finally, we found that studies that sampled only a narrow range of biomass and NDVI produced equations that were more difficult to correct for BRDF effects.
Export citation and abstract BibTeX RIS
1. Introduction
The Arctic is the focus of intensive climate-change and vegetation-change research as it is the part of the Earth that is warming the fastest (IPCC 2014). Responses to warming have already been documented, including changes to vegetation (Elmendorf et al 2012) and landscapes (Liljedahl et al 2016), as well as changes to wildlife and effects on communities that depend on these ecosystems (Hinzman et al 2005). The extent and rate of these types of changes is expected to increase with further warming (IPCC 2014). Due to its remoteness, much of the research and monitoring in the Arctic uses depends on satellite data, which also provide critical inputs for ecosystem modelling (Euskirchen et al 2014).
The most common index used to monitor vegetation is the normalized difference vegetation index (NDVI), which contrasts the reflectance in the red portion of the spectrum that is maximally absorbed by chlorophyll with the near-infrared (NIR) portion that is highly reflected by leaf and canopy structure. The difference between the reflectance of these two wavelengths is divided by the sum to normalize for variation in solar illumination (Tucker 1979). NDVI is related to a number of physical properties of vegetation, and has been found to correlate well with above-ground biomass in tundra ecosystems (Hope et al 1993, Boelman et al 2003, Walker et al 2003, Chen et al 2009, Goswami 2011, Epstein et al 2012, Raynolds et al 2012).
To retrieve vegetation indices such as the NDVI from remote sensing data can be challenging especially in the Arctic where frequent cloud cover, high sun zenith angles (SZA) and sub-optimal sun-object-sensor geometries can alter the remotely sensed signal (Kääb 2008, Buchhorn 2014). The effects of sun-object-sensor geometries can be summarized as effects of the bidirectional reflectance distribution function (BRDF). In a brief definition, BRDF defines how light is reflected, and depends on the angle of the incoming light relative to the Earth's surface and the angle of the sensor in relation to the surface (Nicodemus et al 1977). A more detailed definition of BRDF can be found in specific literature (Nicodemus et al 1977, Hapke 1981, Schaepman-Strub et al 2006, Buchhorn et al 2013a). In the Arctic, the low sun elevation (high solar zenith angle) increases the strength of the BRDF effect, so that measurements taken looking towards the Sun can be quite different from measurements taken looking away from the Sun (Middleton 1991, Vierling et al 1997, Sandmeier et al 1998, Buchhorn 2014). In addition, BRDF effects occur in remote sensing data due to the satellite sensor angles, both from off-nadir looking satellites such as SPOT and wide-swath sensors such as Landsat whose viewing angle increases from the centre outwards (Schaepman 2007).
The effects of BRDF on remote sensing data are particularly important for analyses of change over time (Bréon and Vermote 2012, Morton et al 2014, Nagol et al 2015). These time-series comparisons, analysing temporal and spatial variations in trends, require BRDF correction to increase their ability to detect significant trends, an important function for monitoring the changing Arctic. BRDF correction of satellite data depends not only on the angle of the incoming radiation (sun angle), but also on the wavelengths being analysed (band width), the viewing geometry (sensor angle for particular pixels), and the topography of the surface being measured (Strahler 2000). For tundra areas, this includes not only macrotopography such as slope, but also microtopography created by the vegetation and patterned-ground features common in the Arctic (Buchhorn 2014).
In this analysis we used data from five existing studies in the Alaska Arctic tundra to examine the BRDF effects on measurements of NDVI and their associated estimates of above-ground plant biomass. Our goal was to quantify the influence of the chosen sensor system and typical Arctic SZA on the BRDF effects on NDVI and the resulting estimates of tundra biomass. Moreover, we focused on the question of how robust the equations used to relate NDVI to biomass are under the influence of BRDF effects.
2. Materials and methods
2.1. Study area
The study area is northern Arctic Alaska (figure 1). This area is north of treeline, and includes the rolling foothills north of the Brooks Mountain Range and the flat coastal plain adjacent to the Chukchi and Beaufort Seas (the North Slope of Alaska). The most common vegetation type in the foothills is moist acidic tussock tundra (MAT). This vegetation type is dominated by the tussock sedge, Eriophorum vaginatum, forming tussocks that range in height from about 15 to 50 cm. Both prostrate ericaceous and erect dwarf shrubs (dwarf birch and willow) are common, with the latter sometimes overtopping the tussocks. Mosses are common, especially acidic mosses such as Sphagnum spp., Hylocomium splendens, and Dicranum spp., covering the ground between the tussocks. The lighter-coloured, branched 'reindeer lichen' are also common in MAT (Walker et al 1994).
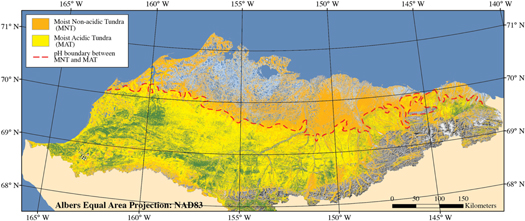
Figure 1. Distribution of moist acidic tussock tundra (MAT, yellow) and moist non-acidic tundra (MNT, orange) in northern Arctic Alaska (Muller et al 1999). Note: red dashed lines shows the spectral boundary separating the two vegetation communities. Some sandy acidic tundra with small tussocks and scattered prostrate dwarf-shrubs occurs north of the boundary between the Colville and Meade Rivers.
Download figure:
Standard image High-resolution imageThe most common vegetation type on the coastal plain is moist nonacidic tundra (MNT). This vegetation type is dominated by the non-tussock forming sedge, Carex bigelowii. Partially-vegetated circular features (frost boils) are common in this vegetation type (Kade et al 2005). The erect dwarf-shrubs differ from MAT, with fewer ericaceous shrubs, little birch, and different willow species (the most common Salix lanata, has lighter-coloured, hairier leaves and has a more scattered occurrence than the common willow in MAT, Salix pulchra). MNT has many flowering forbs, with twice the species richness of MAT (Walker et al 2001). Mosses are very common as in MAT, but the species in MNT tend to be browner, including Tomentypnum nitens and Aulacomnium turgidum. Lichens are also common, but are usually leafy and less conspicuous than the branched lichens in MAT (Walker et al 2001).
The contrast between these two vegetation types is quite noticeable on remote sensing images. Their signatures are distinctive and form a boundary that extends from west to east across the North Slope (figure 1). Biomass sampling showed that MAT has approximately twice the biomass of MNT, mostly due to greater sedge and shrub biomass (Walker et al 2003).
2.2. Biomass studies
We used five studies that reported data from NDVI and aboveground plant biomass in Arctic Alaska for this analysis. Three of the studies used space-borne data and two of the studies used field-based spectroscopy and spectral resampling to simulate space-borne sensor systems. This section only gives a brief summary of the studies. For more detailed explanations regarding the sampling scheme, instruments, and pre-processing of the field data please refer to the original publications. Table 1 summarizes the main differences in study location, sensor parameters, and input value ranges for the NDVI-biomass relationship established in the five studies. The studies are arranged by sensor system, from broad-band to hyperspectral studies.
Table 1. Studies used in the analysis of the effects of BRDF corrections on NDVI and biomass estimates. Note: range of NDVI and biomass values shows the amplitude of values used to create the NDVI-biomass regression in the specific study. The coordinates in this table show only the locations of the main vegetation type used in this study. All biomass values of the original studies were transformed in the same unit (kg/100 m2). AGB—above ground biomass, MAT—moist acidic tussock tundra, MNT—moist nonacidic tundra.
| Study 1 | Study 2 | Study 3 | Study 4 | Study 5 | |
|---|---|---|---|---|---|
| Study area | Circumpolar Arctic | Ivotuk, AK | North Slope, AK | Upper Kuparuk River, AK | North Slope, AK |
| Location MAT | 69.15°N, 148.85°W | 68.49°N, 155.74°W | 69.15°N, 148.85°W | 68.61°N, 149.30°W | 69.15°N, 148.85°W |
| Location MNT | 69.67°N, 148.69°W | 68.49°N, 155.74°W | 69.67°N, 148.69°W | 68.61°N, 149.30°W | 69.67°N, 148.69°W |
| Reference | (Raynolds et al 2012) | (Riedel et al 2005) | (Raynolds and Walker 2016) | (Shippert et al 1995) | (Buchhorn et al 2013b) |
| Sensor system | AVHRR | Broadband field spectrometer | Landsat 4–7 | SPOT | EnMAP simulation |
| Band range RED (nm) | 500–680 | 580–680 | 630–690 | 610–680 | 669–675 |
| Band width RED (nm) | 180 | 100 | 60 | 70 | 6.5 |
| Band range NIR (nm) | 725–1110 | 725–1060 | 760–900 | 790–890 | 860–868 |
| Band width NIR (nm) | 385 | 335 | 140 | 100 | 8 |
| Range of NDVI values | 0.26–0.94 | 0.63–0.84 | 0.20–0.49 | 0.40–0.53 | 0.48–0.69 |
| Range of biomass values (kg/100 m2) | 15–81 | 30–125 | 35–75 | 10–180 | 33–75 |
| NDVI-AGB-regression | NDVI = 0.383*ln(AGB)+0.994 R2 = 0.94, p < 0.001 | NDVI = 0.0002*AGB + 0.59 R2 = 0.66, p < 0.05 | NDVI = 0.0003*AGB + 0.2208 R2 = 0.51, p = 0.0088 | NDVI = 0.00013*(AGB + 1700) + 0.169 R2 = 0.93 | NDVI = 0.21*ln(AGB)−0.26 R2 = 0.83 |
The first study was a circumpolar study, with ground data from North America and Eurasia (Raynolds et al 2012). The NDVI data were from the AVHRR GIMMS3g time series (Pinzon and Tucker 2014). The biomass data were collected along two trans-Arctic transects stretching from close to treeline to the coldest parts of the Arctic. Sites that characterized the typical vegetation of the climate (zonal sites) were sampled with five biomass replicates at each site. The North American transect included six sites on the Alaska North Slope, and Banks Island, Prince Patrick Island and Ellef Ringnes Island in the Canadian Arctic (Walker et al 2009). The Eurasian transect included four sites on the Yamal Peninsula, Ostrov Belyy, and Franz Josef Land, all in Russia (Walker et al 2008).
The second study was from Ivotuk, in the foothills of the Brooks Range (Riedel et al 2005). Four vegetation types were sampled on 100 m × 100 m grids. NDVI was calculated from field spectroscopy data measured at 20 points in each grid using an Analytical Spectral Devices FieldSpec spectroradiometer, taking four representative measurements at each point, each with a 0.35 m2 footprint. Biomass was sampled with 10 replicate samples per grid (Riedel et al 2005). The third study used Landsat data to calculate NDVI for sites on the North Slope (Raynolds and Walker 2016). NDVI values were calculated for a 24 August 2007 Landsat scene, the available cloud-free scene closest in time to the 2006 biomass sampling date. Biomass data were from the same study described above (Raynolds et al 2008).
The fourth study was in the Upper Kuparuk River region of the Brooks Range foothills, including the Toolik Field Station and the Imnavait Creek watershed (Shippert et al 1995). The NDVI data that we compared was from a 29 July 1989 SPOT image and normalized with NDVI data derived from in situ field spectroscopy. The biomass data were collected from 60 plots in a wide variety of vegetation types typical of the area, with three replicates sampled for each plot (Shippert et al 1995).
The fifth study was from the North Slope of Alaska (Buchhorn et al 2013b). NDVI data were derived from GER1500 portable field spectroradiometer measurements and then resampled to the EnMAP spectral resolution using the response function of the sensor. Overall five sites from the foothills of the Brooks Range to the Coastal Plain were sampled in 2012. At each site a 10 × 10 m grid was established and measured in 1 m steps. To minimize variations along the sites, all measurements were taken during clear-sky conditions and at comparable SZA (48° ± 1°) (Buchhorn et al 2013b). Biomass data were from the same study described above (Raynolds et al 2008).
2.3. BRDF modelling approach and adaptation to sensor systems
The BRDF cannot be measured directly, but the anisotropic reflectance behaviour of a surface can be approximately determined by measuring the hemispherical conical reflectance factor (HCRF) in the field (Schaepman-Strub et al 2006, Buchhorn et al 2013a). We used a portable gonio-spectrometer consisting of a sensor platform called ManTIS (Manual Transportable Instrument Platform for Ground-Based Spectro-Directional Observations) and two attachable GER1500 hyperspectral spectro-radiometer (Buchhorn et al 2013a). A detailed description of the ManTIS gonio-spectrometer and its operation can be found in Buchhorn et al (2013a). In short, HCRF measurements for each site under a specific SZA were taken at view zenith angles of 0°, 5°, 10°, 20°, and 30° off-vertical, and at 12–16 different view azimuth angles. The total acquisition time for this measurement scheme (61 target, two reference panel, and 63 irradiance measurements) was approximately 18 min (Buchhorn et al 2013a). Overall for the two vegetation types, we measured typical zonal MAT and MNT vegetation under varying SZA (46°–69°) and several replicates in June–July 2012 (Strauss et al 2012). A visualization and description of all data can be found in Buchhorn (2014), and the original HCRF data can be downloaded from the PANGAEA data archive under the DOI: 10.1594/PANGAEA.855997 (Buchhorn et al 2015).
In order to apply the collected HCRF data to the five studies, the raw HCRF data were used to create BRDF models for each vegetation type and measured SZA. We used a trend surface analysis to fit the untransformed HCRF measurements as a 2nd-order polynomial function to the 61 view zenith and azimuth angles. Since BRDF effects are wavelength dependent, the trend surface analysis had to be done independently for all 414 measured wavelength bands. Second order trend surfaces were recommended by Diggle and Ribeiro (2007) as the maximum order polynomial to use for modelling spatial trends and still capture fine scale patterns. For validation of the BRDF models we used a 5-fold cross validation (table 2).
Table 2. Prediction accuracy of the BRDF models for moist acidic tundra (MAT) and moist non-acidic tundra (MNT) vegetation under varying sun zenith angles (SZA) created out of field spectro-goniometer measurements by using 5-fold cross validation. R2 = Coefficient of determination using all data; RMSE—Root mean squared error from 5-fold cross validation (reflectance percentage); bias—bias evaluated using 5-fold cross validation and mean error (reflectance percentage).
| BRDF model (SZA) | R2 | RMSE | bias |
|---|---|---|---|
| MAT (46°) | 0.68 | 0.041 | 0.012 |
| MAT (50°) | 0.63 | 0.035 | 0.010 |
| MAT (55°) | 0.59 | 0.034 | 0.010 |
| MNT (46°) | 0.84 | 0.014 | 0.005 |
| MNT (55°) | 0.90 | 0.021 | 0.008 |
| MNT (59°) | 0.88 | 0.018 | 0.006 |
| MNT (69°) | 0.61 | 0.023 | 0.007 |
In the next step, the BRDF models for each vegetation type and measured SZA were transferred into BRDF sensor models. By using the spectral response functions of the five sensors used in this study (figure 2), the continuous spectral data of the BRDF models were transferred to the red and NIR channels of the sensors. We used the spectral resampling function of the commercial ENvironment for Visualizing Images (ENVI) software (ENVI 2006) for this step. The ENVI software provided the spectral response functions for the SPOT, AVHRR, and Landsat sensors, where the spectral response functions for the EnMAP sensor were derived from the EnMAP end-to-end Simulation Tool (EeteS) (Segl et al 2012).
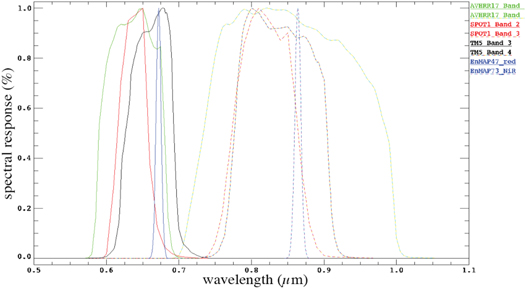
Figure 2. Response functions of satellite sensor systems used for calculation of the NDVI BRDF models. Note: AVHRR—Advanced Very High Resolution Radiometer, SPOT—Satellite Pour l'Observation de la Terre, TM5—Landsat Thematic Mapper 5, EnMAP—Environmental Mapping and Analysis Program.
Download figure:
Standard image High-resolution imageUsing the sensor bands for the red and NIR wavelength range, we calculated the NDVI following the approach described in Tucker (1979). We nadir-normalized the NDVI BRDF sensor models in order to apply the NDVI BRDF sensor models for each vegetation type and measured SZA of the data from the five studies.
2.4. Estimation of the BRDF effects on biomass and visualization
The nadir-normalized NDVI BRDF sensor models were applied to the average NDVI values of the vegetation types, as calculated from data from the 5 different sensor systems in the original studies (table 1). The effects of different sensor viewing geometries (sensor viewing azimuth and zenith angle) and SZA on the NDVI values of MAT and MNT vegetation in the original studies can be presented using a two-dimensional figure (figure 3(a)).

Figure 3. Diagrams of the presentation of the results of the NDVI models (a) and biomass estimations (b), showing viewing azimuth angles around the circle, and zenith viewing angles in concentric circles (adapted from Buchhorn et al 2013a). The amount of change caused by the BRDF effect is shown using a colour gradient in the two-dimensional NDVI figure, and using the third dimension (z axis) for biomass.
Download figure:
Standard image High-resolution imageThe modelled NDVI was used to calculate biomass, using the NDVI-biomass regression from each study (table 1). In order to quantify the influence of the anisotropy regarding the viewing geometry and to compare the BRDF effects in the calculated biomass over all SZA, vegetation types, and five studies, we developed the biomass Anisotropy Factor (bANIF). The bANIF is a simple nadir normalization of the BRDF biomass models, where values larger than 1.0 show increases in biomass (<1.0 are decreases in biomass) compared to the nadir sensor viewing position. We use a three-dimensional figure to visualize the bANIF and to show how the sensor-sun-object geometries (BRDF effects) affect the biomass estimates (figure 3(b)).
3. Results
3.1. Influence of sensor systems on biomass estimations
The spectro-directional effects on the NDVI in MAT vegetation generally caused a decrease in NDVI values for forward-looking angles relative to the Sun and an increase in the NDVI values for backward-looking angles (see two-dimensional NDVI graphs for the different sensor systems in figure 4). The results for the lower-microrelief MNT vegetation were reversed, with increases of the NDVI values in the forward-looking directions, especially for zenith angles >20°, and decreases of the NDVI values in the backward-looking directions (figure 4). Figure 4 shows also that the effects of BRDF on NDVI for the different sensor systems are least for the broadest-band sensors and most for the narrower-band sensors.
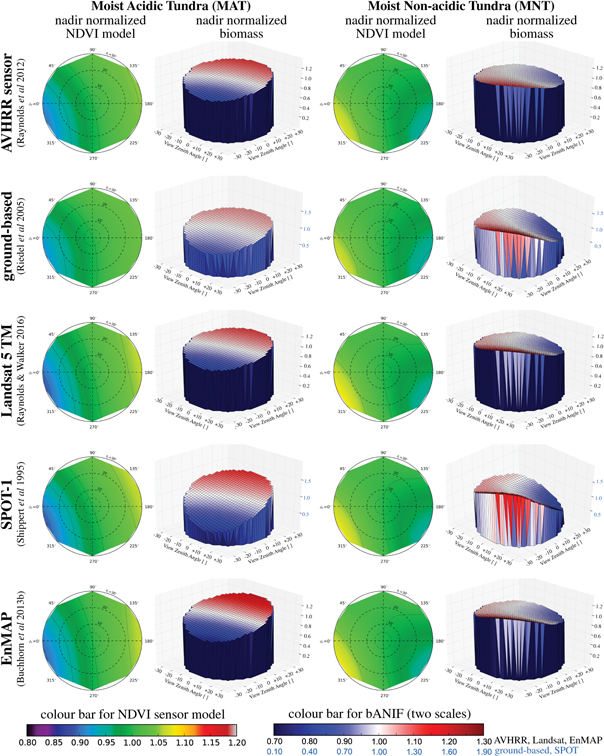
Figure 4. Influence of BRDF effects of different sensor systems on the nadir-normalized NDVI (shown in 2D) and the corresponding biomass estimations (bANIF) (shown in 3D) for two common tundra vegetation types, using the relationships between NDVI and biomass from five studies on the Alaska North Slope. The results for both NDVI and biomass are presented as proportional decrease or increase, where 1.0 = no change. For the two-dimensional NDVI graphs, no change is green, increases are yellow and decreases are blue. For the three-dimensional biomass graphs, no change is white, increases are red and decreases are blue. Note: please be aware of the adapted scale bar (in blue) for the ground-based and SPOT case studies.
Download figure:
Standard image High-resolution imageThe modelled BRDF effects on biomass for MAT and MNT vegetation were similar to the NDVI effects (see three-dimensional biomass graphs for the different sensor systems in figure 4), with less biomass for forward-looking angles for MAT vegetation and more biomass for forward looking angles for MNT vegetation. The effects were accentuated by the specific equation used to estimate biomass in the different studies (table 1). Linear equations derived from a small range of input NDVI values in the original NDVI-biomass regression were especially vulnerable to the nonlinear nature of NDVI. Our results showed that the estimates of biomass from the SPOT study were particularly vulnerable to BRDF effects, both for MAT and MNT vegetation.
Figure 5 show the maximum BRDF influence on the NDVI and corresponding biomass estimates for the five studies in the principal plane—an azimuthal plane where the illumination source, the target and the sensor are in one plane (Itten 1999, Sandmeier 2000) and BRDF effects are more strongly pronounced. The BRDF effects due to the viewing zenith angle changed the NDVI values from 5% to 10% (figures 5(a) and (b)) for both vegetation types. The BRDF effects increased with increasing viewing zenith angles. The changes in biomass followed the same trends but were much larger, mostly around 10%–30%, but again, the SPOT biomass equation was particularly susceptible to BRDF effects and showed a larger range of up to 90% biomass changes (figures 5(c) and (d)).

Figure 5. Influence of BRDF effects of different sensor systems on NDVI (a), (b) and corresponding biomass estimations (bANIF) (c), (d) in the principal plane (sun-object-sensor-viewing geometry with highest effects). Upper part shows the maximum BRDF influence on the NDVI values for MAT and MNT vegetation of different sensor systems. Lower part shows the maximum BRDF influence on the corresponding biomass estimations for MAT and MNT vegetation of the five studies included in this analysis. Note: all values have been nadir-normalized for better comparison.
Download figure:
Standard image High-resolution image3.2. Influence of high SZA on biomass estimations
Figure 6 visualizes the results of the effects of different solar zenith angles on the NDVI and resulting biomass estimations using AVHRR sensor data (SZA of 46°, 50° and 55° for MAT, and 46°, 50°, 59° and 69° for MNT were compared). The strength of the BRDF effects increased with SZA for MAT. For MNT, the strength of the BRDF effect on NDVI did not change much with SZA, though effects were still the strongest for the greatest SZA. Biomass estimates were much more strongly affected in MAT than MNT (figures 6 and 7). As shown in figures 4 and 5, the different sensors were all affected in a similar fashion by BRDF, so the effects shown in figures 6 and 7 for AVHRR would also apply to the other sensors.

Figure 6. Influence of high sun zenith angle (SZA) on the BRDF effects of nadir-normalized NDVI (shown in 2D) and the corresponding biomass estimations (bANIF) (shown in 3D) from two common tundra vegetation types, using the relationships between NDVI and biomass from five studies on the Alaska North Slope. The results for both NDVI and biomass are presented as proportional decrease or increase, where 1.0 = no change.
Download figure:
Standard image High-resolution imageFocused on the principal plane, the maximum BRDF effects due to the viewing zenith angle changed the NDVI values up to 10%–17% (figures 7(a) and (b)) in MAT vegetation with increasing SZA. Again, the BRDF effects increase with increasing viewing zenith angles. The maximum BRDF effects on NDVI in MNT vegetation were around 5%–8% in the higher viewing zenith angles for all four analysed SZA's. The changes in biomass follow the same trends for their vegetation type but were larger, mostly around 10 percentage points higher than the corresponding trend in NDVI (figures 7(c) and (d)).
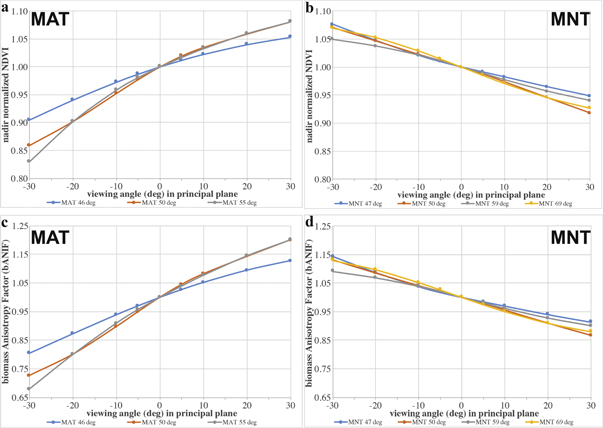
Figure 7. Influence of high sun zenith angles on NDVI (a), (b) and corresponding biomass estimations (bANIF) (c), (d) in the principal plane (sun-object-sensor-viewing geometry with highest effects). Upper part shows the maximum BRDF influence on the NDVI values for MAT and MNT vegetation at increasing sun zenith angles. Lower part shows the maximum BRDF influence on the corresponding biomass estimations for MAT and MNT vegetation. Note: all values have been nadir-normalized for better comparison.
Download figure:
Standard image High-resolution image4. Discussion
Ignoring BRDF effects can lead to faulty conclusions, as Morton et al (2014) showed for tropical rain forests, where seasonal changes in canopy radiance were due to changes in sun-sensor geometry, not changes in the forest canopy. BRDF affects NDVI values that are, in turn, used to estimate biomass. Since NDVI is an indexed value, with the difference of the contrasted bands divided by the sum of the bands, the BRDF effects are minimized, but not eliminated (Buchhorn 2014). The broader band-width sensors were more effective in minimizing this effect, due to the smoothing influence of averaging a wider portion of the spectrum. The differences between the five sensors examined in this study were much smaller than the BRDF response to variation in viewing azimuth and zenith. Variation between the sensors resulted in differences in NDVI of under 3%.
MAT vegetation, with its characteristic sedge tussocks, had stronger BRDF effects than MNT. The MAT physical surface properties caused large differences in NDVI depending on viewing azimuth and zenith angle, as well as large differences due to solar zenith angle. Other studies have also mentioned the different BRDF effects of these two vegetation types (Hope et al 1993, Stow et al 1993, Vierling et al 1997), though our study is the first we know of to quantify these effects on NDVI and biomass.
An unexpected result of this study was the anisotropic behaviour of the NDVI of MAT vegetation. Normally, the NDVI calculation reverses the anisotropic behaviour seen in the original reflectance data of vegetation. BRDF effects in tundra vegetation normally show a reflectance increase towards the backwards-viewing directions and a decrease towards the forward-viewing directions compared to nadir (Buchhorn 2014), whereas NDVI increased towards the forward-viewing directions and decreased towards the backwards-viewing directions for MAT. This can be explained by the wavelength dependency of BRDF effects and the NDVI calculation algorithm. In general, the higher the reflectance the lower the BRDF effects (Sandmeier et al 1998, Itten 1999, Buchhorn et al 2013a). Therefore, BRDF effects in the red wavelength bands are normally higher than in the NIR wavelength bands. Since the NDVI uses the difference of the NIR to the red band, the behaviour of the BRDF effects in NDVI is reversed. The anisotropy index (ANIX) can be used to visualize this effect (figure 8). ANIX spectrally quantifies the amplitude of the reflectance variation over all viewing geometries at a given SZA. The MNT vegetation model shows exactly this expected behaviour (figure 8(b); low BRDF effects in the NIR and higher BRDF effects in the red). Figure 8 also shows the ANIX of the MAT vegetation model used in this study. It is noticeable that the NIR bands (>725 nm) have ANIX values higher than in the red bands (500–690 nm). As a result, the BRDF behaviour of the MAT NDVI is not reversed and stays the same as in the reflectance data. This fact is important for the development of BRDF correction algorithms in MAT vegetation.

Figure 8. Wavelength dependency of BRDF effects in Arctic moist acidic tundra (MAT) and moist non-acidic tundra (MNT) vegetation under varying sun zenith angles. The anisotropy index (ANIX) spectrally quantifies the amplitude of the reflectance variation over all viewing geometries at a given sun zenith angle. Note the contrast between the bandwidths used to calculate NDVI (red = 500–690 nm, NIR = 725–1110 nm).
Download figure:
Standard image High-resolution image
The five studies examined in our analysis each developed its own equation to relate the ground or satellite NDVI measurements to ground-sampled biomass (table 1). Some studies had a large range of NDVI values as input for the NDVI-biomass regression, while others were investigating more subtle differences in NDVI between vegetation types. Similarly, the range of biomass values varied between the studies. In theory NDVI can vary from −1 to +1. Over the range of earth surface reflectance, the minimum is zero or slightly negative (water), to close to 1 (dense vegetation). NDVI is asymptotic to 1, and generally starts to saturate, with reduced response in NDVI despite increases in plant biomass, at around 0.7 (Walker et al 2003). Linear equations, especially linear equations that cover short ranges of high-value NDVI where the relationship is strongly nonlinear, are inaccurate outside of the sampled range. Thus, when applying a BRDF correction to NDVI of scenes with high viewing zenith angles and then using these NDVI values to calculate biomass, the resulting values can be unrealistic. This effect can be seen in the SPOT data example (figures 5(c) and (d)), where the original NDVI value for MAT sampled under nadir conditions was 0.46 (0.43 for MNT) for a sampled biomass of 55.95 kg/100 m2 (29.36 kg/100 m2 for MNT) (Shippert et al 1995), resulting in a steep slope in the linear NDVI-biomass regression (table 1). Adding BRDF effects on the NDVI values during the modelling resulted in NDVI values between 0.41–0.49 for MAT and 0.41–0.46 for MNT, resulting in BRDF-corrected biomass values up to 70% lower and up to 90% larger than the original nadir value. Increasing SZA would even increase these effects in biomass estimations, since it is well known that increasing SZA enhance BRDF effects (Jackson et al 1990, Middleton 1991, Huete et al 1992, Vierling et al 1997). We found that studies that sampled only a narrow range of biomass and NDVI produced equations that were more difficult to correct for BRDF effects.
5. Conclusions and recommendations
This study provides measurements of the BRDF effect on tundra reflectance and the basis for correcting biomass estimates for these BRDF effects. BRDF effects increased with narrow bandwidths, and increased with viewing zenith angle and solar zenith angle. The vegetation type with greater surface roughness, MAT, had greater BRDF effects than the smoother MNT.
In order to minimize the effects of BRDF, we recommend limiting satellite scene selections to those with sun-object-sensor-viewing geometries under 10°. If scenes with greater angles must be used, BRDF corrections should be applied. For studies where biomass is being estimated from NDVI, we suggest using a robust type of equation that is more correct outside the immediate range of sampled values. In this way, applying a BRDF correction to the NDVI values is less likely to lead to spurious biomass values. Overall, we found that BRDF effects on biomass estimates were up to one-third greater than the effects on the NDVI values (excluding extreme cases).
BRDF correction is particularly important for creating long-term time series of satellite data, and to allow comparison between measurements of NDVI and biomass from different sensors. These inter-sensor calibrations are especially important as we try to bridge the gap between the early satellite era sensors such as LANDSAT TM/ETM+ and AVHRR and the newer ones such as MODIS and EnMAP to provide long-term data records to monitor the changing Arctic.
Acknowledgments
Field work was carried out within the framework of a US-German expedition in summer 2012, and part of the hy-ARK-VEG (hyperspectral method development for ARCtic VEGetation biomes) project sponsored by the German research center for aeronautics and space (DLR) and funded by the German Federal Ministry of Economics and Technology (support code: 50 EE 1013) in preparation of the hyperspectral EnMAP space mission. Primary funds for this article and data analysis came from the USA National Atmospheric and Space Administration (NASA) Land Cover and Land Use Change Program (LCLUC) (Grant No. NNX14AD90G), and the National Science Foundation (NSF) Major Research Instrumentation (MRI) Program (Grant No. 1338193). The main author also wants to thank the Helmholtz Graduate School for Polar and Marine Research (POLMAR) for funding part of the field work.