

Abstract
Growing population and water demand have increased pressure on water resources in various parts of the globe, including many transboundary river basins. While the impacts of upstream water use on downstream water availability have been analysed in many of these international river basins, this has not been systematically done at the global scale using coherent and comparable datasets. In this study, we aim to assess the change in downstream water stress due to upstream water use in the world's transboundary river basins. Water stress was first calculated considering only local water use of each sub-basin based on country-basin mesh, then compared with the situation when upstream water use was subtracted from downstream water availability. We found that water stress was generally already high when considering only local water use, affecting 0.95–1.44 billion people or 33%–51% of the population in transboundary river basins. After accounting for upstream water use, stress level increased by at least 1 percentage-point for 30–65 sub-basins, affecting 0.29–1.13 billion people. Altogether 288 out of 298 middle-stream and downstream sub-basin areas experienced some change in stress level. Further, we assessed whether there is a link between increased water stress due to upstream water use and the number of conflictive and cooperative events in the transboundary river basins, as captured by two prominent databases. No direct relationship was found. This supports the argument that conflicts and cooperation events originate from a combination of different drivers, among which upstream-induced water stress may play a role. Our findings contribute to better understanding of upstream–downstream dynamics in water stress to help address water allocation problems.
Export citation and abstract BibTeX RIS

Original content from this work may be used under the terms of the Creative Commons Attribution 3.0 licence. Any further distribution of this work must maintain attribution to the author(s) and the title of the work, journal citation and DOI.
1. Introduction
Water stress and water quality are high on the world's science and policy agenda on global environmental change. There are concerns that the combination of resource depletion and increasing demand may increase competition and conflicts. Problems of allocation are brought to sharp focus when river basins cross political boundaries. Approximately 40% of the global population live in shared rivers and lakes that comprise two or more countries (UN Water 2013). The existing 276 transboundary lake and river basins cover almost one half of the globe's land surface and 60% of global water flow (UN Water 2013). Transboundary rivers create hydrological, social and economic interdependencies between societies, complicating transboundary water management. One of the key challenges is allocating shared water resources and their benefits between upstream and downstream countries.
It has been reported that cooperative or conflictive events associated with internationally shared water bodies are generally concerned with the allocation and use of water resources (Ravnborg 2004, UNDP 2006, WWAP 2012). Upstream water use would be expected to lead to increased water scarcity in downstream parts of the basin. Evidence of the direct causal relationship between water scarcity and conflict is rather limited, whilst there is greater evidence of water scarcity leading people to cooperate (Wolf et al 2003). Natural endowments of the physical river basin and annual water stress, which is assessed here, are only one part of the relationship between water stress, conflict and cooperation. Regulation of flow regime by dams, for example, is also linked to seasonal variability (Döll et al 2009) and environmental flows (Richter and Thomas 2007, Döll et al 2009). The politics of transboundary water negotiations between states are complex, influenced by power relationships (Mirumachi 2015). Nevertheless, the focus on annual water stress will shed light on the significance of water allocation problems in shared basins and add nuances to existing understanding of the drivers of conflict and cooperation.
1.1. Water scarcity and water stress
Water scarcity refers to either physical or social water scarcity (Falkenmark et al 2007). Physical water scarcity arises because of low availability of water resources, while social water scarcity is caused by unbalanced power relations, poverty and related inequalities (Falkenmark et al 2007). While social water scarcity also highlights important challenges, we focus on physical water scarcity as a first step to examine upstream water use on downstream water availability, especially as uneven distribution of renewable fresh water resource and population mean that 2–3 billion people live in highly water stressed areas (Oki and Kanae 2006, Kummu et al 2010, Wada et al 2011a, van Beek et al 2011). Physical water scarcity can be further divided into demand-driven scarcity (water stress) and population-driven water scarcity (water shortage) (Falkenmark et al 2007). Water stress occurs when the demand for water exceeds the available volume during a certain period or when poor quality restricts its use. It is often measured with the use-to-availability ratio (Rockström et al 2009). Growing population together with climate change are predicted to considerably increase water stress within the following decades (Döll 2002, Alcamo et al 2003) and it is estimated that by 2050 more than half the world's population will live in water-stressed areas (Schlosser et al 2014, Schewe et al 2014). Further, it has been proposed that the higher the water stress, the more vulnerable the population to changing water scarcity (van Beek et al 2011).
1.2. Transboundary water management and stress
Analyses of hydropolitical relationships of basin states and management practices demonstrate how conflict and cooperation occur (e.g. Wolf 1998, 1999, 2007, Jägerskog and Zeitoun 2009, Brochmann and Gleditsch 2012, Giordano and Wolf 2013, Gleick 2014). Quantitative analysis has evolved around the development of event datasets. Oregon State University developed the Transboundary Fresh Water Dispute Database (TFDD) over the years to aid assessment of water conflict and resolution processes (Oregon State University 2007). Other databases such as the Water Conflict Chronology (WCC) at the Pacific Institute accumulates water conflict data according to 'control of water resources', water as a 'military tool' or 'political tool', 'terrorism', 'military target' and 'development disputes' (Pacific Institute 2009). The Water-Related Intrastate Conflict and Cooperation (WARICC) dataset provides new insights by drawing on a wide range of events data (e.g. Bernauer et al 2012, Beck et al 2014, Böhmelt et al 2014) while the ICOW River Claims Data Set has been used to examine how disputes over rivers play out (Hensel 2015). Complementing this development are quantitative and qualitative regional analyses that provide insights into legal and institutional effectiveness of cooperative arrangements (e.g. Vinogradov and Langford 2001, Jacobs 2002, Schmeier 2013, Mitchell and Zawahri 2015).
Understanding how and when conflict or cooperation occur helps to evaluate the extent to which water scarcity matters. However, there is little systematic analysis linking events or cooperative arrangements with detailed water stress conditions within a basin. Moreover, critical scholarship argues that conflict and cooperation coexist, making it difficult to make sense of a single conflict or cooperation event without an understanding of the geopolitical factors, national politics and economic drivers of water demand (Mirumachi 2015). Upstream and downstream relations are influenced by political power asymmetry, in addition to asymmetries in hydrological and climatic conditions, and geographical position (Jägerskog and Zeitoun 2009). Negotiation strategies and diplomatic tactics, as well as the use of financial resources and knowhow in hydraulic infrastructure development all play a role in securing water allocation (Mirumachi 2015). Therefore, careful analysis is required to avoid oversimplified causal relations between water stress and conflict (or cooperation).
1.3. Aim of the article
The impact of water use in transboundary context has been studied globally only for transboundary aquifers (Wada and Heinrich 2013) while the knowledge on surface water stress is limited to individual case studies (Scott et al 2003, Nepal et al 2014) and no global assessment exists. In this study we aim to conduct a systematic assessment of the impact of upstream water use on downstream water stress in the world's transboundary river basins. With such an analysis, it is possible to identify the sub-basin areas (SBA) where water stress is intensified by upstream water use. We further evaluate the co-occurrence of water stress and conflict and cooperation events, based on TFDD and WCC datasets. The study attempts to further understand water stress dynamics in transboundary river basins with an aim to identify hotspots and quantify the impact of upstream water use on downstream water availability.
2. Data and methods
To conduct the study, we used the global hydrological model PCRaster Global Water Balance (PCR-GLOBWB) to simulate water use and water availability at grid cell resolution (30 arc-min or roughly 50 km by 50 km at the equator). We performed the analysis by first assessing the water stress due to SBAs' local water use and then adding the upstream water use to the calculations, representing the decreased water availability to the downstream part of a basin. Below we present the data and methods used for the assessment in more detail.
2.1. Data
The data used for the study is summarised in table 1 and can be divided into four categories: (i) basin area data, (ii) water resource availability data, (iii) water consumption (WC) data, (iv) water withdrawal (WW) data, and (v) population density data.
Table 1. Datasets used in the study together with their source.
| Data | Year | Source | Description |
|---|---|---|---|
| Basin area | 1960–2010 | Wada et al (2011a, 2013) | Global grid with 30 arc-min resolution |
| River discharge | 1960–2010 | Wada et al (2011a, 2013) | Monthly data at global grid with 30 arc-min resolution |
| Irrigation water use | 2010 | Wada et al (2011a, 2013) | Monthly data at global grid with 30 arc-min resolution |
| Industrial water use | 2010 | Wada et al (2011a, 2013) | Monthly data at global grid with 30 arc-min resolution |
| Domestic water use | 2010 | Wada et al (2011a, 2013) | Monthly data at global grid with 30 arc-min resolution |
| Population density data | 2010 | Klein Goldewijk et al (2010) and Grübler et al (2007) | Global spatial data; a combination of HYDE for year 2005 population and IIASA for year 2010 population |
River basin boundaries were obtained from Wada et al (2011a, 2013) at a resolution of 30 arc-min. We meshed these river basin boundaries with the country boundaries of similar resolution and used this basin-country mesh to define the SBA (i.e. sub-basin) areas. To calculate the water availability in each SBA, we used the average annual river discharge over the period of 1960–2010 based on PCR-GLOBWB 30 arc-min model results (Wada et al 2011a, 2013). PCR-GLOBWB is a conceptual, process-based water balance model, which in brief, simulates for each grid cell and for each time step (daily) the water balance in two vertically stacked soil layers and an underlying ground water layer, as well as the water exchange between the layers and between the top layer and the atmosphere (rainfall, evaporation and snowmelt) (Wada et al 2013). Discharge estimates from the model are extensively validated against observations from Global Runoff Data Centre (GRDC) in existing publications by Wada et al (2013, 2014).
To estimate water use, we included three sectors: irrigation, domestic, and industrial. These simulations represented the situation in year 2010. As is further justified in the next section, we estimated both WC and WWs. The water use data for these sectors were obtained from the same model as the discharge simulations (Wada et al 2011a, 2013). Water use estimates have also been previously validated against reported country data, notably FAO AQUASTAT, by Wada et al (2011a).
A population density dataset for year 2010 was derived by combining the HYDE dataset for year 2005 (Klein Goldewijk et al 2010) and IIASA population density data (Grübler et al 2007) for year 2010. The data were first aggregated from 5 arc-min to 30 arc-min resolution and then for each SBA.
2.2. Methods
We started the analysis by mapping the transboundary basins according to the data used. River basins were considered to be transboundary if they crossed at least one international political boundary. We limited our study to basins with a surface area of over 10 000 km2. Differences in datasets and the use of 30 arc-min resolution data also means that the basins identified may not completely match those in the TFDD (Oregon State University 2007).
We identified the upstream–downstream hierarchy of countries within each basin by using the following datasets, on top of the modelled discharge: (i) minimum altitude of each SBA within a basin in question, (ii) the river network (CIA World DataBank II 2004), and (iii) information from the TFDD (Oregon State University 2007). The classification 'downstream' does not relate to its topographical location but only to the relation of the SBA to other countries sharing the same basin.
Water availability for each SBA is estimated using the maximum annual discharge within the area. This represents the available water for the main sub-basin in the SBA, such that water available in smaller disconnected sub-basins may have been missed. We used the natural discharge (i.e. excluding human use) for our calculations in order to represent water availability independent of upstream water use.
Annual water use in each SBA was calculated by summing up the three water use sectors. Upstream water use for the SBA was estimated by summing up water use from all SBAs located upstream within the upstream–downstream hierarchy. Water use in excess of availability was considered to be fossil ground water use or other water sources that were not included in this calculation.
Water use can be calculated either by using WWs and WC. WW refers to the total amount of water used for each sector, much of which is returned to the water environment where it may be available to be withdrawn again. However, estimation of return flows is uncertain and they may not necessarily be available to downstream users, for example because of pollution, timing of the flows or infiltration to groundwater (Wada et al 2011b). Most existing water stress studies use WW, with which our results are therefore comparable. WW potentially overestimates the impact of upstream water use, such that our results can be usefully interpreted as an upper bound. In contrast, WC is the water use that is permanently abstracted or evaporated or consumed or otherwise removed from the immediate water environment (Kay 2002). While it would appear to be more appropriate to be used in our study (Brown and Matlock 2011), consumption-based water stress index (WSI) may understate the impact of upstream water use. We thus selected to use both WW and WC in our calculations, because they respectively result in maximum and minimum estimates of stress and changes in stress.
Water stress was measured with the WSI, which is calculated as a ratio of annual water use to available water resources (e.g. Falkenmark et al 2007). Water stress was first calculated for each SBA considering the available water resources for a sub-basin in question and its local water use. Water stress was then calculated considering also upstream water use, which decreases the available water resources in downstream SBA. Finally, we assessed the change in water stress level of each SBA due to upstream water use compared with the situation with only its local water use.
We followed the thresholds defining different levels of water stress from Falkenmark et al (2007):
- No stress: WSI < 20%.
- Moderate stress: WSI = 20%–40%.
- High stress: WSI = 40%–70%.
- Extreme stress: WSI > 70%.
An example calculation of a basin with four SBAs is shown in figure 1. Here, countries A, B, C and D are sharing the same river basin where SBAA (i.e. area of the basins within country A) is upstream to SBAC and SBAD, and SBAB and SBAC upstream to SBAD (figure 1(A)). Therefore, SBAA and SBAB are identified as upstream SBAs, SBAC as middle stream, and SBAD as downstream. The example calculations are based on hypothetical discharge and water use, as shown in figures 1(B)–(C). We show how the water stress would change due to upstream water use. As upstream areas of SBAC and SBAD use considerable amounts of water, their water stress increases from high to extreme and from moderate to high, respectively (figure 1(C)).
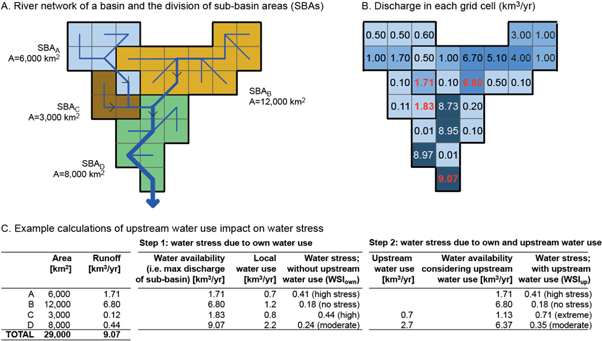
Figure 1. Schematic representation of upstream–downstream relationship in a basin that is shared by four countries (A) and discharge distribution (B) in a river basin, and example calculations for water stress (C) based only on local water use (Step 1) and for water stress where upstream water use is also taken into account (Step 2).
Download figure:
Standard image High-resolution image3. Results
3.1. Upstream and downstream SBAs
We identified altogether 205 transboundary basins larger than 10 000 km2 and a total of 140 countries that are riparian to one or more of these international basins. From that mesh of basins and countries, we delineated a total of 561 SBAs (figure 2). Transboundary basins cover large parts of Africa, Europe, Central Asia and Middle East while in areas with large countries, for example in East Asia and North America, many of the basins do not cross international borders (figure 2).

Figure 2. Identified upstream, middle stream and downstream countries within each transboundary basin.
Download figure:
Standard image High-resolution imageThese international basins cover an area of 65 million km2, roughly half of the world's ice-free land area, and were inhabited in the year 2010 by altogether 2.84 billion people (58% of world total) (table 2). Maps of population and water availability are shown in figure A1. About 20% of total transboundary area was identified as upstream, 26% as middle stream and 54% as downstream areas. When assessing the population between upstream and downstream for each middle stream and downstream SBA, we found that in 106 SBAs the upstream population was larger than the SBA's local population whilst the opposite was the case in 192 sub-basins, with downstream population larger than upstream population (figure 3(A)).
Table 2. Statistics about identified transboundary river basins. See also figure 2.
| Upstream | Middle stream | Downstream | Total | |
|---|---|---|---|---|
| Number of sub-basins | 263 | 97 | 201 | 561 |
| Area (million km2) | 13 | 17 | 35 | 65 |
| Population (millions) | 407 | 1174 | 1258 | 2839 |
| Water consumption (km3 yr−1) | 74 | 241 | 326 | 641 |
| Water consumption per capita (m3/cap/yr) | 182 | 205 | 259 | 226 |
| Water withdrawals (km3 yr−1) | 244 | 489 | 907 | 1640 |
| Water withdrawals per capita (m3/cap/yr) | 600 | 417 | 721 | 578 |

Figure 3. Local versus upstream (whole upstream area of a downstream SBA) results. (A) Population (billion); (B) water consumption (million m3 yr−1); (C) per capita water use (m3/person/year); (D) water stress. See graphs for water withdrawal in figure A2 in appendix.
Download figure:
Standard image High-resolution image3.2. Water use
According to our calculations, irrigation was the dominant water use in the transboundary river basins (76% of WC, 62% of WW). Industrial and domestic WC constituted 14% and 10% of WC, and 28% and 11% of WW respectively (table A1). In many middle stream and downstream SBAs, water use was higher than in their upstream SBAs (figures 3(B) and A2(B)). This may be related to lower population in upstream areas, as this effect was less substantial in per capita terms (figures 3(C) and A2(C)). However, more intense water use may also be a factor in downstream SBAs, as average WC per capita was marginally higher in downstream SBAs compared to upstream and middle stream SBAs, and average WWs per capita was significantly higher (table 2).
3.3. Water stress due to local water use
According to this analysis, 33% (947 million people, with WC) to 51% (1435 million people, with WW) of the total population living in assessed transboundary river basins was facing some level of water stress due to their local water use alone (i.e. excluding the possible upstream water use). About 3%–12% of the total transboundary population was living in areas that suffered from extreme water stress while 7%–22% and 16%–23% of the people were living in areas facing high and moderate stress, respectively (table 3).
Table 3. Population under different water stress categories (measured with water stress index; WSI) with consideration of local water use only or local and upstream water uses.
| Population under water stress (×106) | ||||
|---|---|---|---|---|
| Water stress calculation approach | Moderate (0.2 < WSI < 0.4) | High (0.4 < WSI < 0.7) | Extreme (WSI > 0.7) | Total (WSI > 0.2) |
| Local water consumption | 655 (23%) | 203 (7%) | 89 (3%) | 947 (33%) |
| Local and upstream water consumption | 654 (23%) | 203 (7%) | 90 (3%) | 947 (33%) |
| Local water withdrawals | 464 (16%) | 638 (22%) | 333 (12%) | 1435 (51%) |
| Local and upstream water withdrawals | 490 (17%) | 640 (23%) | 334 (12%) | 1464 (52%) |
Extreme stress solely due to the SBA's local water use was mainly identified in the Middle East, Northern Africa, some parts of Europe, Western US, and Central and South Asia (figures 4(A) and (B)). In Asia, extreme water stress was identified in basins such as the Indus, Jawai, Tigris, and Al Batin. In North America, extreme stress was identified in the Colorado River basin. In northern parts of Africa, basins like Al Maks, Fezzan were equally identified to be under extreme water stress conditions.
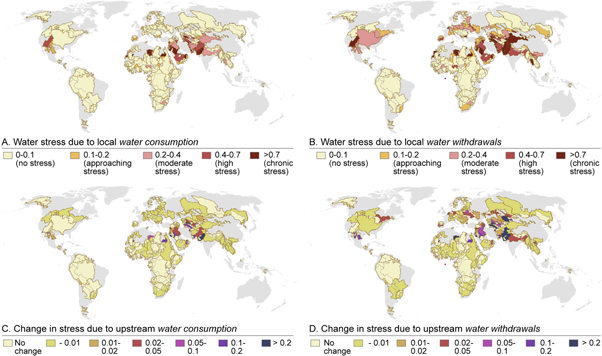
Figure 4. Mapped water stress (measured as water stress index—WSI): (A) water stress due to basin's local water consumption only; (B) water stress due to basin's local water withdrawals only; (C) change in stress index due to upstream water consumption; and (D) change in stress index due to upstream water withdrawals.
Download figure:
Standard image High-resolution image3.4. Impact of upstream water use on stress level
In some basins, water stress increased considerably when the upstream water use was taken into account. We identified 288 out of 298 SBAs (middle stream and downstream) where there was some change in stress for both withdrawal and consumption, with only 10 SBAs where no change was identified (table 4; figures 4(C) and (D)). Altogether 5–12 SBAs 'jumped' to the next category of water stress. For example, the most downstream SBA of Al Batin (Kuwait) was re-classified from moderate stress zone to the extreme stress zone while the most downstream SBAs in Kura (Azerbaijan) were re-classified from no stress zone to the moderate stress zone when upstream basin water uses were considered (figures 4(C) and (D)). We found that the stress level intensified in many areas: the results indicate that for about 294–1134 million people, stress level increased more than 0.01 (table 4). The basins with changes in stress greater than 0.2 are listed in table A2.
Table 4. Population under different water stress change level with consideration of local and upstream water consumption and withdrawal.
| Change in stress level | 0.01–0.05 | 0.05–0.2 | 0.2–1 | >1 | |
|---|---|---|---|---|---|
| Consumption | Number of sub-basins | 14 | 9 | 3 | 4 |
| Population (millions) | 226 (8%) | 4 (0.1%) | 3 (0.1%) | 61 (2%) | |
| Withdrawals | Number of sub-basins | 34 | 15 | 11 | 5 |
| Population (millions) | 822 (29%) | 93 (3%) | 156 (5%) | 63 (2%) | |
4. Discussion
In this study we assessed the change in water stress level due to upstream water use in the world's transboundary river basins. The results indicate that population in water stressed areas is already high when including only local water use. Although upstream water use only slightly increases the population under water stress (table 3), it intensifies the stress considerably in many areas. Increase in stress was substantial particularly in Central Asia, Europe and parts of North America, Middle East and Asia (figures 4(C) and (D)). We further found that 5–12 SBAs entered the next water stress level because of upstream water use.
Our study is valuable to both academia and policy as a first step assessment to identify basins strongly affected by upstream water use. Such findings are of interest to global, regional and national policy communities concerned with addressing water conflict and enhancing cooperation. Below we compare our findings to the conflict and cooperation databases and discuss the possible ways forward in further increasing the knowledge on transboundary basins.
4.1. Upstream water use: reasons for conflicts?
To assess whether there is a link between increased water stress due to upstream water use and the occurrence of conflictive and cooperation events in the transboundary river basins, we compared our findings with the two databases: (i) International Water Event Database (1988–2008) developed under the project of TFDD (Oregon State University 2007), and (ii) WCC (Pacific Institute 2009).
This TFDD database is comprised of international river conflict and cooperation events along with classification and intensity of these, known as the Basin at Risk (BAR) scale. The BAR scale was developed based on a wide range of factors that might affect conflict risk or the chances of cooperation within the basins. Events in the database were 'defined as instances of conflict and cooperation that occur within an international river basin, that involve the nations riparian to that basin, and that concern freshwater as a scarce or consumable resource (e.g., water quality, water quantity) or as a quantity to be managed (e.g., flooding or flood control, managing water levels for navigational purposes) or as a quantity to be managed' (Oregon State University 2007). For this analysis, we selected basins that had at least five conflict and cooperation events recorded in the 'The Basins at Risk project (BAR)' from 1988 to 2008 (Oregon State University 2007).
When the change in stress level per SBA (due to upstream WC) was compared with the number of these events per basin, no direct relationship between these two variables was found (figure 5(A)). However, in a number of basins with a high number of conflict and cooperation events, the stress index also increased considerably in some SBAs due to upstream water use. For example, change in stress was high in many of the Tigris River's SBAs and the number of events in this basin was also among the highest (272 events). On the other hand, in the cases of the Indus, Jordan, Ganges, Mekong and Nile the change in SBA's stress level was rather low compared to the Tigris but a high number of events (80–219) are recorded (figure 5(A)). This indicates that high concern for water use and management is not tied directly with changes to water availability downstream.
Restricting the analysis to highly conflictive events, similar results are obtained. With the TFDD database, this is achieved by using events rated between −4 and −6 on the BAR scale (figure 5(B)). The Aral River Basin has the highest number of conflict events with low impact on water stress, while the Tigris shows considerably high change in stress but not many conflict events. The WCC database only includes conflicts (figure 5(C)), but using a different event collection methodology than TFDD. The number of events therefore differs, but the results are similar: no direct relationship between these two variables was found. Conflict cannot be solely explained by water stress; increased concern for securing water resources does not necessarily result from implications of upstream–downstream water use. Therefore, our analysis supports the argument that while the increased stress due to upstream water use might explain some of the high number of events, there are many other, potentially more influential, factors involved, as mentioned earlier in section 1.2.
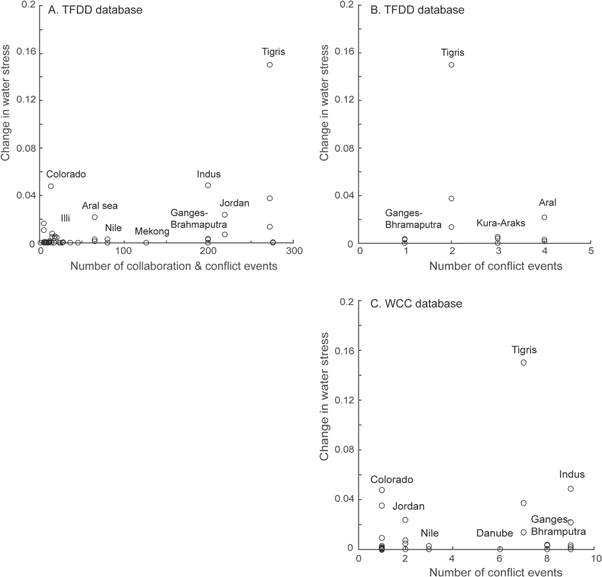
Figure 5. (A) Comparison of change in stress and number of events (both conflictive and cooperative ones, 1988–2008); (B) comparison of change in stress and number of conflicts (1988–2008), i.e. events rated between −4 and −6 on the BAR scale. Source for events and conflicts: International Water Event Database (Oregon State University 2007). (C) Comparison of change in stress and number of conflicts (1988–2008). Source: Water Conflict Chronology (Pacific Institute 2009).
Download figure:
Standard image High-resolution imageThis study provides—for the first time—detailed information about impact of upstream water use over all the transboundary river basins in the world. It is reported that a range of factors consisting of high population growth, urbanisation, increasing water pollution, over-abstraction of groundwater, water-related disasters, and climate change will most probably increase the tension among the riparian countries in the future (Asian Development Bank 2013). Understanding how and where water stress occurs within a basin is valuable to tease out the relationship of these multiple factors. As the results have shown, it may be difficult to obtain statistically significant findings given the large number of confounding social and political factors involved. Thus, case studies and mixed method approaches would complement this global insight.
4.2. Limitations and future research directions
In this study, agricultural, industrial and domestic water uses were included in the calculation of water stress. While environmental water requirements are taken into account in the water stress methodology (assumption that environment needs are 30%), those could be incorporated in much more, spatially explicit, detail (Gerten et al 2013, Pastor et al 2014). Additionally, water availability is highly variable over space and time, such that annual assessment of water stress may underestimate the total impact of upstream water use impacts, which might also be seasonal (van Beek et al 2011). Therefore, including seasonal variation of water availability and water used, as well as environmental flows in the calculation of water stress would provide additional information on the analysis of upstream–downstream relationships.
Upstream actions have often impacted on water quality too (UNEP-DHI 2011). The availability of usable water resources downstream might be reduced due to the industrial or domestic pollution in upstream parts of a basin. This aspect of water scarcity was not considered in this study and would need further research in the future.
Finally, identifying upstream and downstream parts of a basin was difficult in some, particularly very dry basins. There are a great number of riparian countries that do not have any clear upstream/downstream relationship. Some relationships do not have easy representations when using gridded data, for example dealing with small sub-basins, complex border geometries and boundaries that follow rivers. Given these challenges, there are opportunities for improving the dataset constructed for this study. We thus provide the dataset for other researchers for further development (available in supplementary). It could provide a starting point for a global spatial database on flow relationships within transboundary river basins, complementing for example the TFDD database (Oregon State University 2007).
5. Conclusions
While it is well recognised that upstream water use in transboundary river basins increases the water scarcity in downstream parts of the basin, this has not been quantified in the global scale. In this paper we aimed to produce this information by comparing the change in water stress level due to upstream WC in the downstream parts of the world's 205 largest transboundary basins. Further, we compared our results with two water event databases to assess the possible connection between the occurrence of cooperation and conflict events and increased stress due to upstream water use.
We found that water stress is already high even when considering only local water use. When including upstream water use, the population under water stress increased only slightly, but stress levels intensified considerably in many areas. When we compared the increased stress levels with occurrence of conflict or cooperative events in assessed river basins, we did not find a direct relationship between them. This supports the observation in the literature that cooperation and conflict is not directly dependent only on water stress or water use. There are other different drivers which are also important. In future research, our results could be combined with such factors to further assess their role in conflict and collaborative events in transboundary river basins.
Our findings provide useful information on the impacts of upstream WC and withdrawal on downstream water stress. These results can be used as background information when negotiating the water extractions within a basin and adopting regulatory measures for water extraction in different parts of a basin. The results help shed more light on water allocation among upstream and downstream countries to inform transboundary river management.
Acknowledgments
This work was funded by Maa- ja vesitekniikan tuki ry. Joseph Guillaume received funding from Academy of Finland funded project NexusAsia (grant no. 269901). Yoshihide Wada is supported by Japan Society for the Promotion of Science (JSPS) Overseas Research Fellowship (JSPS-2014-878). Matti Kummu received funding from Academy of Finland funded project SCART (grant no. 267463).
Appendix.: Detailed results
These tables and figures show additional detailed results, as referenced in the main text. Table A1 shows water use for different purposes according to the dataset used. Table A2 lists sub-basins where change in stress level is greater than 0.2 for water withdrawal. Figure A1 shows population and water availability for each sub-basin. Figure A2 shows results for water withdrawal, corresponding to the water consumptions results presented in figure 3.

Figure A1. Mapped input information. (A) Total population for each SBA (millions); and (B) available water for each SBA (km3 yr−1).
Download figure:
Standard image High-resolution image
Figure A2. Local versus upstream. (A) Water withdrawal (million m3). (B) Per capita water withdrawal (m3/person/year); (C) water stress; (D) water stress due to local water withdrawal versus local and upstream water withdrawal.
Download figure:
Standard image High-resolution image
Table A1. Water consumption and water withdrawal for domestic, industrial and irrigation purposes.
| Water use | Water consumption (km3 yr−1) | Water withdrawal (km3 yr−1) |
|---|---|---|
| Domestic | 92 (14%) | 174 (11%) |
| Industrial | 60 (10%) | 452 (28%) |
| Irrigational | 489 (76%) | 1014 (62%) |
| Total | 641 | 1640 |
Table A2. Sub-basins where change in stress level is above 0.2 for water withdrawal.
| SBA ID | Basin ID | Country name | Position in the basin | Population | Water stress (local water use) | Water stress (local and upstream water use) | Change in stress |
|---|---|---|---|---|---|---|---|
| 105507334 | 7334 | Libya | Downstream | 293 818 | 6.360 | 6.564 | 0.204 |
| 105907247 | 7247 | Pakistan | Downstream | 1 541 041 | 1.418 | 1.623 | 0.205 |
| 105907592 | 7592 | Pakistan | Downstream | 138 318 114 | 0.985 | 1.193 | 0.209 |
| 118606914 | 6914 | Iran | Middle stream | 278 740 | 1.013 | 1.223 | 0.211 |
| 119005096 | 5096 | Belgium | Downstream | 8 408 468 | 1.072 | 1.292 | 0.220 |
| 104406544 | 6544 | Turkmenistan | Middle stream | 65 450 | 0.026 | 0.271 | 0.245 |
| 118205545 | 5545 | Kazakhstan | Downstream | 3 221 579 | 0.373 | 0.650 | 0.277 |
| 104406292 | 6292 | Turkmenistan | Downstream | 2 151 733 | 0.822 | 1.103 | 0.281 |
| 119207047 | 7047 | Mexico | Downstream | 524 699 | 0.073 | 0.382 | 0.309 |
| 105207204 | 7204 | Iraq | Middle stream | 641 411 | 0.531 | 1.000 | 0.469 |
| 106907238 | 7238 | Saudi Arabia | Downstream | 707 485 | 6.551 | 7.442 | 0.891 |
| 123507561 | 7561 | United Arab Emirates | Downstream | 1 426 352 | 2.023 | 3.157 | 1.134 |
| 104406001 | 6001 | Turkmenistan | Downstream | 1 735 653 | 4.888 | 9.419 | 4.532 |
| 122207593 | 7593 | India | Downstream | 59 700 436 | 6.289 | 15.208 | 8.920 |
| 123007204 | 7204 | Kuwait | Downstream | 16 182 | 0.216 | 159.285 | 159.069 |
| 106807616 | 7616 | Mauritania | Downstream | 4 257 | 2633.395 | 7622.417 | 4989.022 |