

Abstract
Atmospheric responses to sea ice retreat in the Bering Sea have been linked to recent extreme winters in North America. We investigate the leading factor for the interannual variability of Bering sea ice area (SIA) in early winter (November–December), using canonical correlation analysis based on seasonally resolved atmosphere and ocean data for 1980–2014. We found that the 3-month leading (August–September) geopotential height at 500 hPa (Z500) in the Northern Hemisphere explains 29% of SIA variability. The spatial pattern of Z500 for positive (negative) sea ice anomalies is associated with negative (positive) anomalies over the Gulf of Alaska related to the Pacific transition (PT) pattern. The heat budget analysis indicates that summertime atmospheric conditions influence SIA through the ocean temperature anomalies of the Alaskan Coastal Current forced by atmospheric turbulent heat fluxes. The PT pattern highly correlates with convective precipitation in the western subtropical Pacific, implying that weakened subtropical forcing is the likely cause for the recent extreme winters in North America. Our results present a major factor for interannual variability in the Bering SIA, and further would contribute to the improvement of forecasting winter climate in North America.
Export citation and abstract BibTeX RIS

Content from this work may be used under the terms of the Creative Commons Attribution 3.0 licence. Any further distribution of this work must maintain attribution to the author(s) and the title of the work, journal citation and DOI.
1. Introduction
The importance of surface boundary conditions over the Arctic sea ice area (SIA) has been pointed out in terms of the driving forces for planetary waves and blocking events in the Northern Hemisphere (Screen and Simmonds 2013a, 2013b, 2014, Cohen et al 2014, Vihma 2014, Overland et al 2015). Recent severe winters in Eurasia continent, which is known to be the warm-Arctic cold-Siberian, is thought to be an atmospheric response to turbulent heat fluxes caused by a decrease trend in sea ice cover in the Barents and Kara Seas (Honda et al 2009, Petoukhov and Semenov 2010, Inoue et al 2012, Mori et al 2014) and a remote atmospheric response to surface heating in the Gulf Stream front (Sato et al 2014).
Similar to Eurasia, North America has recently experienced extreme winters in 2009–2010, 2010–2011, and 2013–2014 (Wallace et al 2014). Several studies have reported that extreme atmospheric conditions are related to increased waviness of westerly jet streams secondary to polar amplification of global warming (Francis and Vavrus 2012, Liu et al 2012, Francis and Vavrus 2015). This hypothesis has been supported by theoretical and observational evidence (Tang et al 2013a, 2013b). Conversely, several studies have suggested that the influence of Arctic amplification on wavier jet streams and blocking over the mid-latitudes is minor compared with natural climate variability (Barnes 2013, Barnes et al 2014, Hassanzadeh et al 2014).
A recent numerical investigation demonstrated that the anomalous atmospheric circulation responsible for the severe winter in 2013–2014 is in part induced by low SIA in the Bering Sea (Lee et al 2015). In fact, the Bering SIA in early winter (November–December), when the release of turbulent heat flux to the atmosphere is prominent, is significantly correlated with surface air temperature (SAT) and sea level pressure (SLP) in the northeastern part of North America after one month (December–January), indicating that the wintertime SAT in North America tends to be relatively low, when the 1-month leading SIA in the Bering Sea is small (figure 1). The composite analysis of the wintertime SAT for light and heavy SIA years supports that the sea ice retreat precedes severe winters in North America (figure S1). The similar results were also obtained from the analysis based on the regional SAT time series over the East-Siberian-Chukchi Sea region (Kug et al 2015). Thus, it is suggested that the recent extreme winters are part of the natural climate variations regulated by the SIA change in the Bering Sea.
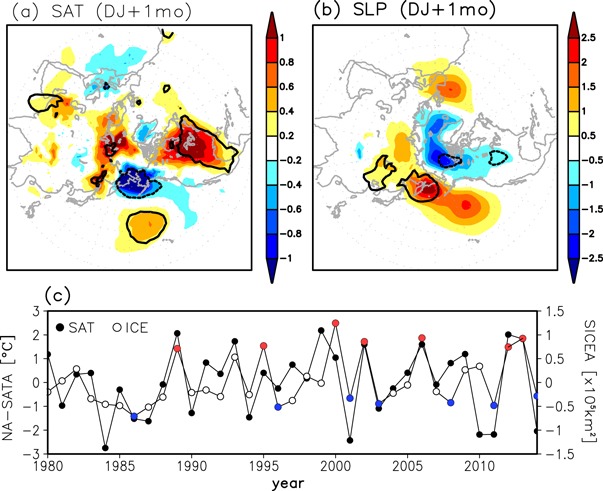
Figure 1. Regression maps (colors) of December–January (a) SAT and (b) SLP onto the time series of 1-month leading (November–December) sea ice area averaged over the Bering Sea (53°–65°N, 165°E–155°W; shown in figure S2). The contours indicate the regions where the correlation is significant at the 95% confidence level. (c) Time series of SAT in northeastern North America (30°N, 90°E; filled circles) in December–January and 1-month leading Bering Sea ice area (ICE; open circles). Heavy and light sea ice years used in the composite analysis for SAT (figure S1) are indicated by red and blue filled circles, respectively. Sea ice and atmospheric data are derived from NCEP-CFSR data (Saha et al 2014).
Download figure:
Standard image High-resolution imageSo far, causes of the SIA variability in the Bering Sea have been investigated in terms of large-scale atmospheric circulation anomalies (Walsh and Sater 1981, Cavalieri and Parkinson 1987, Niebauer 1988, Fang and Wallace 1998, Honda et al 1999, Deser et al 2000, Sasaki and Minobe 2005, Yamamoto et al 2006, Ukita et al 2007), cyclone activity (Overland and Pease 1982, Screen et al 2011), and local winds and ice influx from the Arctic Ocean (Zhang et al 2010). Taken together, these studies suggest that wind anomalies over the Bering Sea play a dominant role in SIA variability. However, these previous studies have focused on the role of atmospheric conditions on mid-winter SIA variability in the Bering Sea, but effects on SIA variability in early winter are not well understood. In fact, SIA variability in early winter (November–December) is not well explained by SIA variability in mid-winter (February–March) (table 1).
Table 1. Correlations between 2-month averaged SIA in the Bering Sea from 1980 to 2014.
| November–December | December–January | January–February | February–March | March–April | |
| November–December | — | 0.91 | 0.62 | 0.33 | 0.23 |
Bold numbers indicate correlations exceeding the 95% confidence level based on the Monte Carlo simulation (Kaplan and Glass, 1995).
Here we present new dominant factor underlying interannual variability of SIA in the Bering Sea in early winter based on seasonally resolved atmosphere and ocean data, with emphasis on the sea ice retreat. To explore the leading factors for the SIA variability in the Bering Sea, we used canonical correlation analysis (CCA).
2. Data and methods
The SIA and atmosphere–ocean data used for the CCA were derived from a new coupled global National Centers for Environmental Prediction-Climate Forecast System Reanalysis (NCEP-CFSR) dataset for 1980–2014 (Saha et al 2014). All available in situ and satellite observations and Argo float data since 2000 are assimilated in this dataset. The SIA was determined from the area weighted by sea ice concentration (SIC). Since the SIC data in reanalysis have various biases and errors (Lindsay et al 2014), we evaluated the reliability of SIC and ocean temperature in the Bering Sea, before we use the NCEP-CFSR data for the CCA. The climatological sea ice edge is very similar to that of the Hadley Centre Sea Ice and Sea Surface Temperature dataset version 1 (HadISST; Rayner et al 2003) (figures S2(a) and S2(b)). Also, the time series of SIA in the Bering Sea shows good correspondence between the NCEP-CFSR and observed data (r = 0.84, figure S2(c)), although the difference between them is relatively large from the late 1990s. Since the assimilated SIC data were changed in 1996/1997 from the Goddard Space Flight Center (Cavalieri et al 1996) to the NCEP operational ice analysis (Grumbine 1996), this difference might be related to the source data for the assimilation. A relatively warm water tongue along the coast of Alaska also comparable to the climatological ocean temperature of World Ocean Atlas 2013 (WOA13) (Locarnini et al 2013), indicating that the advective heat fluxes associated with the Alaskan coastal current (ACC) (Woodgate and Aagaard 2005) are well represented (figure S3). The near-surface temperature (25 m) in the Bering Strait calculated from NCEP-CFSR data for 1991–2009 is highly correlated with the mooring data (Woodgate et al 2012) (r = 0.80, figure S3). These comparisons confirm that the interannual variations of SIA and near-surface ocean temperature in the Bering Sea are accurately represented in the NCEP-CFSR data.
The leading factors (hereafter predictor) for SIA variability in early winter were investigated by CCA, which is multivariate statistical technique to objectively identify correlation relationship between multidimensional variables (Barnett and Preisendorfer 1987). The preprocessing and procedure for CCA is mostly identical to Nakanowatari et al (2014), but the choices of predictors and predictand are different. The predictand was the average November–December SIA in the Bering Sea (53°–65°N, 165°–155°W) from 1980 to 2014. The CCA were conducted for 2-month averages of each predictor at lead times from 0 to 11 months. The forecast skill for each predictor was evaluated by field-averaged cross-validated correlation (FCC) between observed and modeled data (Barnston 1994). According to earlier studies, six climate variables were tested as potential predictors: 2-month-averaged local SST, SAT, zonal (Usfc) and meridional (Vsfc) 10 m wind in addition to Northern Hemisphere SLP and geopotential height at 500 hPa (Z500). The areas analyzed for local predictors (SST, SAT, Usfc, and Vsfc) were somewhat extended meridionally and zonally (50°–65°N, 160°E–150°W) to evaluate the effect of ocean advection from the North Pacific such as the Gulf of Alaska. However, the result of CCA is not essentially affected by this slight modification of the study area.
3. Results
The forecast skills of November–December SIA are shown for each lead times of 0- to 11-month (figure 2). The highest forecast skill (FCC = 0.25) was obtained for Z500 at a 3-month lead time (August–September). Z500 had a forecast skill with a cross-validated correlation >0.5 in the eastern Bering Sea, covering 21% of the study area (figure S4). The forecast skill for Z500 decreased from autumn (2-month lead time) to early winter (1-month lead time), while the forecast skill for SST increased (figure 2). This result implies that summertime atmospheric conditions indirectly affect SIA through the persistency of ocean temperature anomaly, which was excited in summer. On review of the CCA modes (1–5) in the Z500 experiment, along with the percentage of the original variance in the predictand explained by the CCA mode, the first CCA mode (CCA1) from the 3-month lead time Z500 predictor experiment explained 30% of the original variance in the predictand. Therefore, the forecast skill of Z500 was essentially explained by CCA1.

Figure 2. Forecast skill of the SIA in the Bering Sea in early winter for 0-month (November–December) to 11-month (December–January) lead times from local SST, Usfc, Vsfc, SAT, Northern Hemisphere SLP, and Z500. The forecast skill from Z500 is highlighted by red. The horizontal dashed lines indicate the confidence level at 95%.
Download figure:
Standard image High-resolution imageThe canonical correlation maps and time series for CCA1 are shown in figure 3. A negative correlation for Z500 (significant at the 95% confidence level) was found over the Gulf of Alaska (figure 3(a)), accompanied by wave-like anomalies of positive correlations over the western North Pacific and North America. Conversely, a positive correlation for SIA (significant at the 95% confidence level) was found in the eastern Bering Sea (figure 3(b)). The canonical correlation time series exhibited year-to-year variability with a positive linear trend, indicating that CCA1 explained the increasing trend in Bering Sea SIA in early winter (figure 3(c)). The positive correlation in Z500 over the western North Pacific (figure 3(a)) is consistent with the significant increase in SLP in Autumn (Simmonds 2015). This result implies that these wave-like anomalies are barotropic structures and thus Rossby wave propagations from the tropics (Hoskins and Karoly 1981). To understand the atmospheric circulation pattern for Z500 in CCA1, correlation analyses between CCA1 for Z500 and teleconnection pattern indexes from the National Oceanic and Atmospheric Administration (NOAA) Climate Prediction Center were conducted. The correlation between the CCA1 (Z500) and the Pacific transition (PT) pattern index in September (obtained from the NOAA Climate Prediction Center; http://www.cpc.ncep.noaa.gov/data/teledoc/pt.shtml) was 0.74, which was significant at the 95% confidence level based on a Monte Carlo simulation using a phase randomization technique (Kaplan and Glass 1995). The PT pattern is the major teleconnection pattern in transition seasons from spring to summer (Barnston and Livezey 1987) and its signal is observed in total ozone variability at high latitude (Hansen and Svenøe 2005).

Figure 3. Canonical correlation maps of (a) Z500 in August–September and (b) SIA in November–December (canonical correlation is 0.84). (c) Canonical correlation time series of the SIA (red) and the Z500 (blue). Colored regions in (a) and (b) indicate areas where the correlations are significant at the 95% confidence level. In (a), the region for SIA used in CCA is indicated (red dashed line).
Download figure:
Standard image High-resolution imageThe negative anomaly in Z500 over the Gulf of Alaska was accompanied by a northwesterly wind anomaly from the high latitudes to the Bering Sea. Therefore, the atmospheric preconditioning possibly affects SIA in the Bering Sea through the advection of ocean temperature anomaly. To check this possibility, lead-lag regressions between the Z500 canonical correlation time series for CCA1 and the monthly SST were examined (figure 4, left column). Since the Z500 canonical correlation time series is positively correlated with the SIA in the Bering Sea, the negative (positive) regression means the decreasing (increasing) SST for positive (negative) SIA. At a lag of 1 month, a negative regression appeared over the Gulf of Alaska. The negative regression moved westward along the coast of Alaska at a lag of 2 months, then entered the Bering Sea through the Unimak Pass (red cross in figure 4, left lower panel). This permits flow of a portion of the ACC into the shallow eastern Bering Sea (Stabeno et al 2002). Conversely, the negative regression in Z500 disappeared at a lag of 2–3 months, although the positive regression persists over the western North Pacific (figure 4, middle column). To confirm whether this advection process is valid or not, we checked the surface current speed in and around the Gulf of Alaska, based on the climatological surface current data in the NCEP-CFSR data. In September–November, the surface current data shows the inflow of ACC with 5–10 cm s−1 through the Unimak Pass (164°E) (figure S5). The satellite tracked drifter data support that the inflow of ACC has the surface current speed larger than 20 cm s−1 (Stabeno and Hristova 2014). Therefore, the water mass takes 2–4 months or less to travel from south of the Aleutian Islands to the eastern Bering Sea (∼500 km). This advection time is roughly comparable to the time lag between the SST anomaly in the Gulf of Alaska and Bering Sea.

Figure 4. Lead-lag regression maps (colors) of the 2-monthly mean SST (°C, left), Z500 (m, middle) and CP (mm/day, right) onto the Z500 canonical correlation time series (CCA mode 1) at 0-month (top) to 3-month (bottom) lag times. The contours indicate the regions where the correlation is significant at the 95% confidence level. The red cross in the left lower panel indicates the location of Unimak Pass. In the right upper panel, the area-averaging region for the CP time series in figure 5 is shown (green dashed line).
Download figure:
Standard image High-resolution imageTo isolate the physical processes responsible for changes in SST in the Gulf of Alaska, the individual terms in the ocean heat content (OHC) tendency equation were examined. The heat budget equation is derived by multiplying by density and the specific heat of water and vertically integrating over a layer spanning from the surface to 55 m, which approximately corresponds to the mixed layer depth (MLD) in August–September, calculated from the NCEP-CFSR data:
where subscripts x, y, and z indicate a zonal, meridional, and vertical partial derivative, respectively. Equation (1) equates the heat storage tendency in a MLD to the integrated effect of ocean heat advection, surface heat fluxes (sensible heat, latent heat, longwave, and shortwave radiation fluxes), and a residual term. The residual term includes diffusion and the numerical error associated with calculating discrete derivatives in time and space. Since the reanalysis data largely depend on the data assimilation system, surface heat flux data tend to have large uncertainties and model biases (Trenberth et al 2009, Wang et al 2011). To assess the heat budget analysis based on the NCEP-CFSR data, we also examined the observational estimates of surface heat flux from OA Flux data from 1980 to 2014 (Yu and Weller 2007). For shortwave and longwave radiation fluxes, we used the International Satellite Cloud Climatology Project radiation products from 1984 to 2009 (Zhang et al 2004).
In the regression analysis onto CCA1 for Z500, the negative anomaly in the OHC tendency was well explained by both the ocean advection term and surface heat flux (table 2). The dominant term for ocean heat flux is vertical advection, indicating that the dynamical mixing entrains relatively low temperature water from the bottom of the MLD. The net surface heat flux is largely determined by latent heat fluxes. This heat budget analysis indicates that the anomalous northwesterly wind induces surface cooling by evaporation and breaks the vertical stratification of the upper water column, which results in the negative SST anomaly. The heat budget analysis based on the OA Flux data supports that latent heat flux has large contribution on the summertime heat budget (table 2). On the other hand, the contribution of shortwave radiation flux is comparable to that of the latent heat flux. These results are consistent with previous study in which the summertime heat budget related to the atmospheric teleconnection excited by El Niño-Southern Oscillation (ENSO) events is examined (Alexander et al 2004). Thus, northwesterly (southeasterly) wind anomaly and the resultant low-level cloud also may reinforce (relax) the cooling in the Gulf of Alaska.
Table 2. Regressions of monthly mean terms in August–September averaged over the Gulf of Alaska (45°–55°N, 140°–160°W) onto the geopotential height at 500 hPa (Z500) time series of canonical correlation analysis mode 1 (CCA1) from 1980 to 2014. The values in the parenthesis indicate the regressions calculated from the OA Flux data.
| Ocean advection | Surface heat flux | ||||||
|---|---|---|---|---|---|---|---|
| Storage tendency | uTx + vTy | wTz | QSN | QLA | QSH | QLO | Residual |
| −12.1 | −2.40 | −7.19 | −0.98 (−0.82) | −4.21 (−2.25) | −0.31 (−1.62) | −0.98 (1.84) | 3.98 |
| −9.58 | −6.48 | ||||||
uTx, vTy, and wTz, zonal, meridional, and vertical component of ocean heat advections; QSN, sensible heat flux; QLA, latent heat flux; QSH, shortwave radiation flux; QLO, longwave radiation flux.
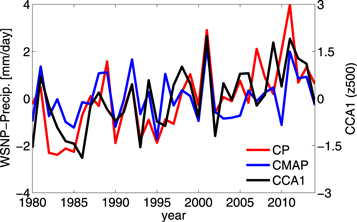
The PT pattern is likely caused by atmospheric convection change leading to the geopotential height anomaly, because the Z500 signal originates from the western subtropical North Pacific (WSNP) region, which corresponds to a warm pool region. The relationship between the leading mode of Z500 and convective precipitation (CP), which is an index for the convective activity, in the NCEP-CFSR data was briefly examined. The lead-lag regression map of CP in August–September onto the Z500 canonical correlation time series of CCA1 is shown in figure 4 (right). At a lag of 0 to 1 months, a positive anomaly was found over the WSNP, indicating that the wave-like pattern of Z500 is particularly evident (figure 4, middle) when the WSNP convection is strengthened. The time series of the CP averaged over the WSNP (20°–30°N, 145°–170°E) revealed year-to-year variability with a weak positive trend during the past 35 years (figure 5). The correlation between WSNP–CP and the Z500 canonical correlation time series of CCA1 was 0.67, which was significant at the 95% confidence level based on the Monte Carlo simulation. The satellite estimated precipitation data (NCEP-CFSR merged analysis of precipitation; (CMAP)), in which the reanalysis precipitations were not incorporated (Xie and Arkin 1997), was also significantly correlated with the Z500 canonical correlation time series of CCA1 (r = 0.58, significant at the 95% confidence level). When the correlation map between the SAT in the following winter (December–January) and the CP time series was calculated, significant positive and negative correlations around the North Pacific and Bering Sea, similar to those in figure 1(a), were retained (figure S6). Therefore, the weakened summertime atmospheric convection in the WSNP is the likely cause for the recent extreme winters in North America. In fact, the time series of the CMAP precipitation anomaly shows relatively low values in 2010 and 2013, although the CP anomaly in 2010 was not so low (figure 5).
Figure 5. Time series of NCEP-CFSR convective precipitation (red) and CMAP precipitation (blue) averaged over the western subtropical North Pacific (WSNP) (20°–30°N, 145°–170°E, as shown in the right upper panel of figure 4) in August–September and Z500 canonical correlation time series for canonical correlation analysis mode 1 (CCA1; black). The scale for the Z500 canonical correlation time series is indicated on the right axis.
Download figure:
Standard image High-resolution image
The time series of WSNP-CMAP indicates that the atmospheric convection in the WSNP is also weakened in 1980, 1985, 1990, 1995, and 2000. In these years, the SIA in the Bering Sea is suppressed and the SAT in North America after one month is relatively low over North America (figure 1(c)). It is noted that the air temperature in 1991, which is relatively high, is not explained by the above scenario. Since the year of 1990 in winter corresponds to negative PNA pattern, the influence of Bering Sea ice may be overwhelmed by this large-scale atmospheric pattern (Assel 1992). The correspondence between the interannual variability in the CMAP precipitation and SAT during the several decades suggests that recent severe winters in North America are amplified by the natural climate variability originated from the subtropics.
4. Discussion
An increasing number of extreme weather events have occurred over North America in recent winters, including 2013–2014. It has been suggested that the atmospheric circulation anomaly related to the extreme winter in 2013–2014 was caused by anomalous SST in the North Pacific and low SIA in the Bering Sea (Lee et al 2015). In the present study, the leading factors for the interannual variability of SIA in the Bering Sea in early winter (November–December), which is significantly correlated with the SAT in North America after one month, were investigated based on seasonally resolved atmosphere and ocean data.
The CCA revealed that the highest forecast skill for SIA in early winter was obtained from the 3-month leading Z500 over the Northern Hemisphere. By using the 3-month leading Z500 data, SIA variability in 21% of the Bering Sea was skillfully predicted, particularly in the eastern Bering Sea. The Z500 for a positive (negative) SIA anomaly exhibited a negative (positive) anomaly over the Gulf of Alaska. The negative (positive) Z500 anomaly over the Gulf of Alaska was accompanied by positive (negative) Z500 anomalies over the WSNP and North America and was related to the PT pattern. The CCA diagnostics revealed that the leading mode of Z500 was negatively correlated with SST in the Gulf of Alaska, and the correlation signal in SST travels to the eastern part of the Bering Sea in 2 months. Considering the distance between the eastern Bering Sea and the Gulf of Alaska, the negative (positive) Z500 anomalies over the Gulf of Alaska likely affect the advance (retreat) of the SIA in early winter through the ACC advection of the negative (positive) SST anomaly.
The physical mechanisms underlying the change in SST were explored by ocean heat budget analysis of NCEP-CFSR data. Examination of the mechanisms responsible for SST variability revealed that anomalous northwesterly (southeasterly) winds mainly induce (reduce) surface cooling by evaporation and mixing the upper water column, which results in the negative (positive) SST anomaly. Li et al (2005) have previously demonstrated the influence of the PT pattern on the MLD in the Gulf of Alaska. The findings of the present study are consistent with that earlier study and suggest that the PT pattern affects the OHC in the Gulf of Alaska and further SIA variability in the Bering Sea. Therefore, the use of summertime atmospheric preconditions as well as SST data for the Gulf of Alaska might lead to further improvement of the forecast accuracy for the North America climate in winter.
The SIA in the Bering Sea is reported to be increasing slightly, although the SIA has decreased significantly in the Beaufort Sea north of Alaska and in the Arctic Ocean as a whole (Parkinson and Cavalieri 2008). The strength of the Aleutian low in winter, which suppresses sea ice advance in the Bering Sea, corresponds to the weak phase in the strong interdecadal fluctuation that occurs on a 50- to 70-year time scale, which is associated with the Pacific decadal oscillation (PDO) (Minobe 2000). Therefore, the PDO is the likely cause for the recent increase in SIA in the Bering Sea (e.g. Wendler et al 2014). In the present study, the leading mode of Z500, which is similar to the PT pattern, was highly correlated with the SIA in the Bering Sea. The time series of the leading mode of Z500 showed a positive trend, therefore the weak positive trend in the SIA in the Bering Sea might have been caused by the intensified PT pattern and the accompanying cooling trend in SST in the Gulf of Alaska in summer.
The results of the CCA also suggest that the wave-like pattern of Z500 is generated by CP variability over the WSNP. The importance of the remote planetary wave atmospheric response from the outside the Arctic on the Arctic sea ice retreat has been indicated by several studies (Simmonds and Govekar 2014). Recently, Sato et al (2014) clearly showed that the Barents Sea ice retreat and cold Eurasian winters are forced by a teleconnection pattern originated from the Gulf Stream heating with model experiments. These earlier studies support our hypothesis that the planetary waves excited by the atmospheric convection in the WSNP influences the SIA in the Bering Sea. Considering that the convective signal is confined to the western subtropical region and occurs late in the summer, this convection signal might be related to the ENSO cycle and/or tropical cyclone intensity. However, the correlation between the PT index and the Niño 3 index (obtained from the NOAA Climate Prediction Center) is negligible (r = 0.05) in September. Conversely, the positive trend in summertime CP is consistent with the increasing destructiveness of tropical cyclones in the western North Pacific since the 1980s (Emanuel 2005), although future projections of tropical cyclones based on theory and high-resolution dynamical models indicate that there is a large uncertainty in the global frequency of tropical cyclones (Knutson et al 2010, Ying et al 2012). Furthermore, several studies have shown that the width of the tropical belt has increased since 1979, accompanied by poleward expansion of the Hadley circulation (Seidel et al 2008, Hu et al 2011). This widening of the tropical belt is also evident in precipitation patterns (Zhou et al 2011). Thus, further investigations are needed to clarify the mechanism of CP variability and the associated atmospheric responses.
Acknowledgments
The mooring data in the Bering Strait were provided by the Polar Science Center, University of Washington. We wish to thank two anonymous reviewers for their constructive comments. This work was funded by a Grant-in-Aid for Scientific Research (no. 24241009) and the Green Network of Excellence (GRENE) Arctic Climate Change Research Project of the Ministry of Education, Culture, Sports, Science, and Technology in Japan.